2026 07 03
Global Financial Briefing — Friday, 3 July 2026
Market Overview
Global risk appetite is firmly positive heading into the US Independence Day weekend, but market leadership has shifted decisively toward Asia. Wall Street closed Thursday (2 July) mixed at the index level: the Dow Jones rose 1.14% to a record close of 52,900.07, while the S&P 500 finished flat at 7,483.24 and the Nasdaq 100 fell 1.6% as semiconductors sold off for a second straight session (the SMH semiconductor ETF dropped 4.5%). The catalyst was a clear miss in the June jobs report — nonfarm payrolls rose just 57k, roughly half of expectations — which markets are reading as a green light for Federal Reserve easing later this year, even though the unemployment rate ticked down to 4.2%.
Asia ran with that easing narrative today. Korea's Kospi surged 5.8% to 8,088 — the index has roughly doubled in 2026 — powered by an AI-chip rally after Korean June exports topped 100 billion USD for the first time on a near-tripling of semiconductor shipments, and by reports that Samsung is in talks with Anthropic to develop custom AI chips. The Nikkei added 1.5% to 69,744, Hong Kong rose 1.3% and Australia gained 1.4%. Europe is trading flat to modestly higher mid-session, with the STOXX 600 (649) within about 0.4% of its 52-week high.
The tension in the data is between an equity market priced for perfection and a US macro picture deteriorating on both sides of the Fed's mandate: headline CPI re-accelerated to 4.2% YoY in May (core 2.8%) while job creation is stalling. Credit spreads are historically tight and the S&P 500 earnings yield is now below the 10-year Treasury yield — a negative equity risk premium — leaving little valuation cushion if either inflation or growth disappoints further.
Global Indices Snapshot
Americas
US markets are closed today for Independence Day (observed) and Brazil had not yet opened at publication time, so day changes are not shown.
| Index | Level | Source |
|---|---|---|
| S&P 500 | 7,483.24 † | yfinance ^GSPC |
| Nasdaq 100 | 29,329.21 † | yfinance ^NDX |
| Dow Jones | 52,900.07 † | yfinance ^DJI |
| Brazil IBOV | 172,787.62 ‡ | yfinance ^BVSP |
† All US levels reflect the 2 Jul close — Independence Day (3 Jul, observed): US markets closed today (per the holiday calendar). ‡ Brazil IBOV reflects the 2 Jul close — the Sao Paulo session had not opened when data was fetched.
Europe
| Index | Level | Day Chg | Day Chg % | Source |
|---|---|---|---|---|
| Euro STOXX 600 | 649.35 | +1.00 | +0.15% | yfinance ^STOXX |
| Euro STOXX 50 | 6,380.18 | +19.71 | +0.31% | yfinance ^STOXX50E |
| CAC 40 | 8,467.34 | -7.52 | -0.09% | yfinance ^FCHI |
| DAX | 25,695.21 | +114.33 | +0.45% | yfinance ^GDAXI |
| FTSE 100 | 10,639.65 | -13.22 | -0.12% | yfinance ^FTSE |
| SMI (Swiss) | 14,333.18 | -19.80 | -0.14% | yfinance ^SSMI |
European figures are live intraday levels (3 Jul, ~10:45 CEST, markets open); day changes are vs the 2 Jul close.
Asia-Pacific
| Index | Level | Day Chg | Day Chg % | Source |
|---|---|---|---|---|
| Nikkei 225 | 69,744.07 | +1,010.92 | +1.47% | yfinance ^N225 |
| Hang Seng | 23,350.03 | +295.00 | +1.28% | yfinance ^HSI |
| Shanghai Comp | 4,043.64 | +14.74 | +0.37% | yfinance 000001.SS |
| ASX 200 | 8,844.40 | +119.90 | +1.37% | yfinance ^AXJO |
| Kospi (Korea) | 8,088.34 | +440.25 | +5.76% | yfinance ^KS11 |
Asia-Pacific data reflect today's close (3 Jul).
Emerging Markets
| Index | Level | Day Chg % | Source |
|---|---|---|---|
| MSCI EM (EEM) | 65.70 † | — | yfinance EEM |
| India Nifty 50 | 24,269.20 | +0.39% | yfinance ^NSEI |
| South Africa (EZA) | 64.00 † | — | yfinance EZA |
† EEM and EZA are US-listed ETFs: levels reflect the 2 Jul close and US markets are closed today (Independence Day, observed). Nifty 50 is a live intraday level (3 Jul).
Index Valuations & Investment Risk
Valuation Table
| Index | Trailing P/E (live) | Hist avg trailing P/E (†) | Premium vs hist midpoint |
|---|---|---|---|
| S&P 500 | 26.7x | ~16-18x | +57% |
| Nasdaq 100 | 32.7x | ~25-30x | +19% |
| Euro STOXX 600 | 18.5x | ~15-17x | +16% |
| CAC 40 | 17.7x | ~14-16x | +18% |
| DAX | 18.8x | ~15-17x | +17% |
| FTSE 100 | 18.0x | ~13-15x | +28% |
| Nikkei 225 | 23.8x | ~20-22x | +13% |
| MSCI EM | 17.4x | ~13-15x | +24% |
(†) Historical averages are static long-run reference constants. Live trailing P/E from yfinance ETF proxies (SPY, QQQ, EXSA.DE, CAC.PA, EXS1.DE, ISF.L, 1321.T, EEM), fetched 3 Jul 2026. Premiums in bold exceed 20% of the historical midpoint.
Investment Risk Assessment for ETF Investors
United States (S&P 500 / Nasdaq ETFs). The S&P 500 trades at 26.7x trailing earnings, roughly 57% above its long-run average — historically stretched territory (above the 40% threshold). Earnings yield is (1÷26.67) = 3.75%, against a 10Y Treasury at 4.48% (FRED DGS10, 2026-07-01): the equity risk premium is about -0.7%, i.e. Treasuries out-yield the S&P 500 earnings yield. The 10Y TIPS real yield of 2.25% (FRED DFII10, 2026-07-01) is a further headwind for long-duration growth stocks. Technically the index sits 1.8% below its 52-week high (7,620.9), above its 50-day (7,395) and 200-day (6,943) moving averages. With CPI re-accelerating to 4.2% while payroll growth stalls at +57k, the market is leaning heavily on Fed easing that sticky inflation may complicate. Concentration in AI-linked mega-caps remains a key vulnerability — US semiconductors have fallen for two consecutive sessions even as Asian chip names rally.
Europe (STOXX 600 / CAC 40 / DAX ETFs). Valuations are elevated but far less extreme: 18.5x for the STOXX 600 (+16% vs history), 17.7x for the CAC 40, 18.8x for the DAX. Euro earnings yield is (1÷18.54) = 5.39% against a eurozone AAA 10Y yield of 2.96% (ECB YC API, 2026-07-01) — an equity risk premium of roughly +2.4%, dramatically healthier than the US. Europe also trades at a ~31% P/E discount to the S&P 500. For EUR-based investors, US exposure carries currency risk with EUR/USD at 1.1403 (FRED DEXUSEU, 2026-06-26); French fiscal risk remains a watch item for OAT-heavy portfolios (OAT spread not retrieved today).
Japan (Nikkei / TOPIX ETFs). The Nikkei at 23.8x is about 13% above its historical range midpoint after a very strong run — the index trades 27% above its 200-day average but 4.2% below its 52-week high (52-week range 39,289-72,832). The BOJ raised its policy rate to 1.00% on 16 June (highest since 1995) and signals further hikes; with USD/JPY at about 161 the yen remains very weak, so unhedged JPY exposure has been costly while boosting exporter earnings. Rising JGB yields (10Y above 2.7%) are the main domestic valuation risk.
Emerging Markets (MSCI EM ETFs). EEM trades at 17.4x — about 24% above its own historical range, so the usual EM discount argument is weaker than normal, though EM still trades well below US multiples. Korea (Kospi roughly doubled in 2026) and the AI supply chain dominate returns; China lags (Hang Seng 17% below its 52-week high, below its 200-day average). Currency and concentration risk are elevated after such a vertical move in Korean equities.
Overall Risk Score: High valuation risk / low margin of safety in the US; moderate-to-elevated elsewhere. The negative US equity risk premium, a 57% P/E premium to history, tight credit spreads and re-accelerating headline inflation argue for caution on US-heavy ETF allocations; Europe offers a meaningfully better valuation cushion; Asia momentum is strong but increasingly speculative.
Disclaimer: This is financial information, not personalised investment advice. Past valuations do not guarantee future returns. Consult a financial advisor before investing.
US Economic Indicators (FRED - authoritative)
| Indicator | Current | Prior | Delta | Reference Date | FRED Series |
|---|---|---|---|---|---|
| CPI YoY % | 4.17% | 3.78% | +0.39pp | May 2026 | CPIAUCSL |
| Core CPI YoY % | 2.82% | 2.74% | +0.08pp | May 2026 | CPILFESL |
| Unemployment Rate | 4.2% | 4.3% | -0.1pp | Jun 2026 | UNRATE |
| Nonfarm Payrolls | +57k | +129k | -72k | Jun 2026 (monthly chg) | PAYEMS |
| 10Y TIPS Real Yield | 2.25% | 2.20% | +5bp | 2026-07-01 | DFII10 |
Note: CPI references May 2026 (June CPI is due mid-July); the June jobs report was released ahead of the 3 July market holiday. The striking feature is the divergence between hot headline inflation (4.2% YoY, up from 3.8%) and much tamer core inflation (2.8%) — pointing at food/energy and tariff-sensitive goods — landing at the same time as the weakest payroll print of the year.
Other economic releases today (web search): Eurozone Services PMI (June, final) came in at 48.9 vs 48.5 expected and 47.7 prior — a three-month high, but still in contraction; input-price and output-price inflation eased.
Fixed Income & Bond Analysis
Policy Rates
| Central Bank | Rate | Source |
|---|---|---|
| Fed Funds (upper) | 3.75% | FRED DFEDTARU (2026-07-02) |
| Fed Funds (lower) | 3.50% | FRED DFEDTARL (2026-07-02) |
| Effective FFR | 3.63% | FRED DFF (2026-07-01) |
| ECB Deposit Rate | 2.25% | FRED ECBDFR (2026-07-02) |
| BOJ Policy Rate | 1.00% | web search (hiked 16 Jun 2026, highest since 1995) |
| BOE Bank Rate | ~3.73% (SONIA/FRED) | FRED IUDSOIA (2026-06-30) |
Government Bond Yields
| Country | 2Y Yield | 10Y Yield | 30Y Yield | Day Chg (10Y) | Source |
|---|---|---|---|---|---|
| USA | 4.17% | 4.48% | 4.97% | +4bp | FRED (2026-07-01) |
| Eurozone AAA (Bund proxy) | 2.47% | 2.96% | 3.48% | — | ECB YC API (2026-07-01) |
| France | (not retrieved) | (not retrieved) | (not retrieved) | — | web |
| UK | (not retrieved) | 4.80% | (not retrieved) | — | web (2 Jul) |
| Japan | (not retrieved) | ~2.7% | (not retrieved) | — | web (2 Jul, 3-week high) |
| Italy | (not retrieved) | (not retrieved) | (not retrieved) | — | web |
Yield Curve Spreads (FRED pre-computed):
- 10Y-2Y spread: +35 bps (FRED T10Y2Y, 2026-07-02) — positively sloped, modestly above flat territory.
- 10Y-3M spread: +67 bps (FRED T10Y3M, 2026-07-02) — no inversion; the classic recession signal is not flashing.
Both spreads widened over the week as weak payrolls pulled the front end down relative to the long end: markets are pricing Fed easing while sticky headline inflation and heavy supply keep 20Y-30Y yields near 5%.
OAT-Bund Spread: not retrieved today (French yields unavailable from the sources used); flagged rather than estimated.
Yield Curve Charts
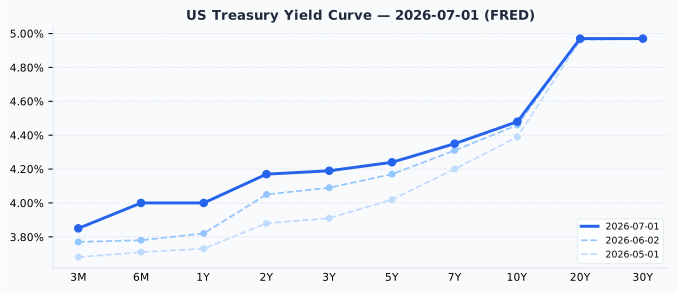
The US curve is upward sloping from 3.85% at 3 months to 4.97% at 30 years, with a notably flat belly between 2Y and 10Y. Versus a month ago (2 June), the front end and belly rose about 8-12 bps while the 20Y-30Y sector was essentially unchanged.
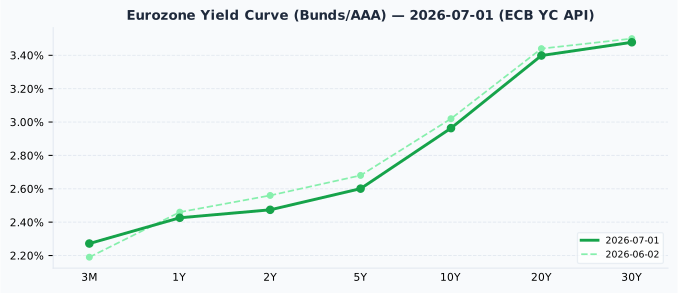
The eurozone AAA curve rises gently from 2.27% (3M) to 3.48% (30Y), consistent with an ECB on hold at 2.25%. Versus a month ago the curve bull-flattened modestly: 2Y fell ~9 bps and 10Y ~6 bps while the 3M rose ~8 bps.
Sanity check: the US 3M yield (3.85%) sits 22 bps above the Fed funds target midpoint (3.625%) — within normal range, no anomaly.
Credit Markets (from FRED - authoritative)
| Market | OAS Spread | Series ID |
|---|---|---|
| US Investment Grade | 76 bps | BAMLC0A0CM (2026-07-01) |
| US High Yield | 274 bps | BAMLH0A0HYM2 (2026-07-01) |
| Euro High Yield | 271 bps | BAMLHE00EHYIOAS (2026-07-01) |
All three are historically tight: US IG at 76 bps sits below its typical 80-150 bps range, and US HY at 274 bps is under the 300-500 bps norm. Credit is priced for a benign outcome — spreads this tight signal complacency rather than stress, and offer little compensation if growth data keep softening.
Bond Portfolio Implications
- S&P 500 ERP = earnings yield (1÷26.67) = 3.75% minus DGS10 4.48% = -0.73%. A negative ERP means 10Y Treasuries out-yield the S&P 500 earnings yield — historically a warning signal for forward equity returns and a direct argument for bonds over US equities on relative value.
- Euro ERP = (1÷18.54) = 5.39% minus eurozone AAA 10Y 2.96% = +2.43% — European equities still offer a real cushion over Bunds.
- With the 10Y at 4.48% and 30Y at 4.97%, US bonds offer meaningful nominal carry, and a positive 2.25% real yield on 10Y TIPS is attractive by post-2008 standards. Duration risk remains: a 100 bp rise in yields would cost roughly 8-9% on a 10Y bond. Given easing expectations at the front end and sticky headline inflation at the long end, intermediate maturities (2Y-5Y, yielding 4.17-4.24%) offer the best risk/reward balance.
Currencies & Commodities
Currencies:
| Pair | Rate | Source |
|---|---|---|
| EUR/USD | 1.1403 | FRED DEXUSEU (2026-06-26 — H.10 lags; one week old) |
| USD Index (broad) | 120.89 | FRED DTWEXBGS (2026-06-26) |
| USD/JPY | 160.98 | web search (3 Jul) |
| GBP/USD | ~1.326 | web search (29 Jun) |
| USD/CHF | 0.8028 | web search (3 Jul) |
The yen stands out: at ~161 per dollar it remains very weak despite the BOJ having hiked to 1.00% in June — the market clearly doubts the pace of further tightening. The franc is strong at 0.80 per dollar.
Commodities (yfinance front-month futures, 3 Jul):
| Commodity | Price | Day Chg % | Ticker | Source |
|---|---|---|---|---|
| Brent Crude (USD/bbl) | 71.67 | -0.18% | BZ=F | yfinance |
| WTI Crude (USD/bbl) | 68.44 | -0.36% | CL=F | yfinance |
| Gold (USD/oz) | 4,195.50 | +1.69% | GC=F | yfinance |
| Silver (USD/oz) | 63.09 | +3.31% | SI=F | yfinance |
| Copper (USD/lb) | 6.23 | +0.96% | HG=F | yfinance |
| Nat Gas (USD/MMBtu) | 3.25 | +1.78% | NG=F | yfinance |
Precious metals are rebounding today but remain deep in a correction: gold at 4,195.50 is 24.9% below its all-time high of 5,586.20, a peak set within the past 52 weeks (52-week range 3,263.90-5,586.20). Silver at 63.09 is 48.0% below its all-time high of 121.30, also a 52-week extreme — the metal has roughly halved from its peak, and today's +3.3% bounce should be read in that context. Copper at 6.23 is 6.4% below its all-time high of 6.65, set within the past year. Crude is subdued: WTI at 68.44 is 53.5% below its all-time high of 147.27 and near the middle of its 52-week range (54.98-119.48). Nat gas at 3.25 sits in the lower half of its 52-week range (2.48-7.83).
Sector & Theme Highlights
- The AI trade is rotating, not dying. US semiconductors fell for a second straight session (SMH -4.5% on 2 Jul), yet Asian chip suppliers surged today on Korea's export data and the Samsung-Anthropic custom-chip reports. Memory/HBM suppliers, not US mega-caps, are today's AI winners.
- EV divergence: Tesla sank as much as 7.3% on its Q2 delivery and production report, while Rivian jumped about 5% after raising 2026 delivery guidance.
- Korean financials rallied alongside chips (Shinhan +4.9%, KB Financial +3.4%) — the Kospi move is broadening beyond semiconductors.
- Defensive rotation in the US: the Dow's record close against a falling Nasdaq 100 points to money shifting from growth/semis toward value and cyclicals into the long weekend.
- Precious metals bounce (+1.7% gold, +3.3% silver) after a historic drawdown — a counter-trend rally within a deep correction, not a return to highs.
Top Stories (Global)
- Dow closes at a record 52,900.07 (+1.14%) ahead of the July 4 holiday; S&P 500 flat, Nasdaq 100 -1.6% as semiconductors extend their decline (TheStreet, Yahoo Finance).
- June US payrolls rise just 57k — about half of expectations — while unemployment dips to 4.2%; rate-cut expectations firm (Schwab, BLS via FRED).
- Korea's Kospi jumps 5.8% to 8,088, extending a year in which the index has roughly doubled; June exports topped 100 billion USD on a near-tripling of semiconductor shipments (Yahoo Finance, CNBC, TradingEconomics).
- Samsung reportedly in talks with Anthropic to develop custom AI chips, adding fuel to the Asian semiconductor rally (Yahoo Finance).
- BOJ policy rate stands at 1.00% after the 16 June hike — the highest since 1995 — with the June Summary of Opinions signalling more increases; JGB 10Y above 2.7%, a three-week high (CNBC, BOJ, TradingEconomics).
- Tesla falls as much as 7.3% after its Q2 delivery and production report; Rivian gains about 5% on raised 2026 guidance (Yahoo Finance).
- Eurozone June services PMI (final) improves to 48.9, a three-month high but still in contraction (S&P Global/HCOB).
Looking Ahead
- US markets are closed today (Fri 3 Jul, Independence Day observed — 4 Jul falls on Saturday) and reopen Monday 6 July. No other market closures through 8 July among the tracked countries (US, GB, DE, FR, JP, AU, CH, CA, KR, BR, IN) per the holiday calendar; next up is Bastille Day in France on 14 July.
- Fed policy path: after the payrolls miss, markets will parse Fed speakers and the June FOMC minutes for confirmation of easing; the hot May headline CPI (4.2%) is the complication.
- US June CPI (mid-July) becomes the pivotal release: another headline acceleration would collide with the easing expectations now embedded in equity prices.
- Q2 earnings season ramps up from mid-July; with the S&P 500 at 26.7x trailing earnings, delivery matters more than usual.
- Asia watch: whether the Kospi's vertical move (+5.8% today, roughly 2x in 2026) consolidates; JGB yields at three-week highs keep BOJ normalisation in focus.
Data sources: FRED (fredgraph CSV endpoint — FRED MCP was unavailable this session), ECB Yield Curve API (2026-07-01), yfinance batch script (3 Jul 2026 ~08:53 UTC), web searches on 3 Jul 2026. US markets closed 3 Jul (Independence Day observed).