2026 07 16
Global Financial Briefing — Thursday, July 16, 2026
Market Overview
Global markets turned risk-off on Thursday, driven by an abrupt profit-taking wave in AI-linked semiconductors that hit hardest in Asia. South Korea's Kospi plunged 6.37% — its worst single-day fall in years — as Samsung Electronics (-8.8%) and SK Hynix (-11.5%) were slammed by a combination of AI-valuation profit-taking and a surprise Bank of Korea rate hike (the first since 2023, aimed at inflation pressure tied to the Iran conflict's effect on oil prices). The selloff triggered a circuit breaker on the Korea Exchange. The same AI-capex-payoff anxiety showed up globally: TSMC posted a 77% annual earnings gain yet its shares fell more than 4%, dragging chipmakers and the Nasdaq 100 lower (-1.39% intraday) even as the Dow (-0.25%) and broader S&P 500 (-0.42% intraday) held up better.
Europe was comparatively resilient — the STOXX 600 (+0.16%), STOXX 50 (+0.29%) and FTSE 100 (+0.54%) all closed higher, while the CAC 40 (-0.05%) and DAX (-0.34%) were roughly flat to modestly lower. US Treasury yields ticked up across the curve (10Y at 4.58%) alongside continued US military action against Iran, which is keeping a geopolitical risk premium in crude even as prices fell today. US June retail sales rose a softer-than-expected 0.2% m/m (vs 0.3% consensus), a modest but not alarming consumer-spending signal.
Fixed income and credit markets are sending a calmer message than equities: the US Treasury curve is modestly upward-sloping and no longer inverted (10Y-2Y at +42 bps), credit spreads remain historically tight (US IG ~79 bps, US HY ~271 bps), and the VIX at 15.67 sits just above the "low/complacent" threshold — none of which yet reflects the scale of today's Asian equity shock. The divergence between calm credit markets and a violent single-country equity crash is worth watching: it may reflect an idiosyncratic Korea/semiconductor story rather than a systemic risk-off event, but a look at the equity risk premium below shows US equities already priced for very little margin of safety.
Global Indices Snapshot
Note: Americas figures below are from the open session on 16 July, not the closing print. Europe and Asia-Pacific reflect today's completed close in local time.
Americas
| Index | Level | Day Chg | Day Chg % | Source |
|---|---|---|---|---|
| S&P 500 | 7,540.26 | -32.14 | -0.42% | yfinance ^GSPC |
| Nasdaq 100 | 29,092.09 | -410.51 | -1.39% | yfinance ^NDX |
| Dow Jones | 52,525.41 | -133.23 | -0.25% | yfinance ^DJI |
| Brazil IBOV | 173,678.78 | -2,332.13 | -1.33% | yfinance ^BVSP |
Americas data is from the open session on 16 Jul, not the closing print.
Europe
| Index | Level | Day Chg | Day Chg % | Source |
|---|---|---|---|---|
| Euro STOXX 600 | 643.73 | +1.02 | +0.16% | yfinance ^STOXX |
| CAC 40 | 8,377.86 | -4.57 | -0.05% | yfinance ^FCHI |
| DAX | 24,915.49 | -84.04 | -0.34% | yfinance ^GDAXI |
| FTSE 100 | 10,572.24 | +56.32 | +0.54% | yfinance ^FTSE |
| SMI (Swiss) | 14,267.19 | -40.12 | -0.28% | yfinance ^SSMI |
European data reflects today's close (16 Jul).
Asia-Pacific
| Index | Level | Day Chg | Day Chg % | Source |
|---|---|---|---|---|
| Nikkei 225 | 66,835.54 | -1,915.96 | -2.79% | yfinance ^N225 |
| Hang Seng | 25,008.60 | +327.50 | +1.33% | yfinance ^HSI |
| Shanghai Comp | 3,882.41 | -73.17 | -1.85% | yfinance 000001.SS |
| ASX 200 | 8,840.70 | -0.40 | -0.00% | yfinance ^AXJO |
| Kospi (Korea) | 6,820.60 | -463.81 | -6.37% | yfinance ^KS11 |
Asia-Pacific data reflects today's close (16 Jul). Kospi's -6.37% move triggered a Korea Exchange circuit breaker — see Top Stories.
Emerging Markets
| Index | Level | Day Chg % | Source |
|---|---|---|---|
| MSCI EM (EEM) | $64.23 | -2.04% | yfinance EEM |
| India Nifty 50 | 24,072.75 | -0.02% | yfinance ^NSEI |
| South Africa (EZA) | $62.93 | -1.27% | yfinance EZA |
Index Valuations & Investment Risk
Valuation Table
| Index | Trailing P/E (live) | Hist avg trailing P/E (†) | Premium/discount |
|---|---|---|---|
| S&P 500 | 27.03x | ~16-18x | +59% (stretched) |
| Nasdaq 100 | 31.40x | ~25-30x | +14% |
| Euro STOXX 600 | 18.62x | ~15-17x | +16% |
| CAC 40 | 17.61x | ~14-16x | +17% |
| DAX | 18.22x | ~15-17x | +14% |
| FTSE 100 | 17.68x | ~13-15x | +26% (elevated) |
| Nikkei 225 | 21.72x | ~20-22x | +3% |
| MSCI EM | 16.55x | ~13-15x | +18% |
(†) Hist avg trailing P/E: static long-run reference constants.
Trailing P/E (live): sourced from yfinance trailingPE on ETF proxies (SPY, QQQ, EXSA.DE,
CAC.PA, EXS1.DE, ISF.L, 1321.T, EEM). Premium/discount computed vs the historical range midpoint.
S&P 500 at ~59% above its long-run average trailing P/E is historically stretched (>40% threshold) — the most valuation-extended market in this table, consistent with today's AI-capex jitters hitting US tech hardest. FTSE 100's +26% premium mostly reflects that UK equities trade on structurally low multiples historically, so the gap looks larger in percentage terms even though the absolute P/E (17.68x) is unremarkable globally.
Investment Risk Assessment for ETF Investors
United States (S&P 500 / Nasdaq ETFs) SPY trailing P/E of 27.03x is well above its ~16-18x historical average — earnings yield is (1÷27.03) = 3.70%. Against the 10Y Treasury yield of 4.58% (FRED DGS10, 2026-07-14), the Equity Risk Premium is -0.88% — negative, meaning Treasuries currently out-yield the earnings yield on US equities. This is a historically weak setup for forward equity returns and reinforces today's AI-valuation-driven selloff narrative. QQQ (Nasdaq 100) is less stretched at +14% over its historical range, but concentration risk in a handful of AI/semiconductor names remains the dominant single risk factor, as today's TSMC-led selloff demonstrated. The 10Y TIPS real yield (FRED DFII10) at 2.33% is also historically high, adding further pressure on long-duration growth-stock valuations via the discount-rate channel.
Europe (STOXX 600 / CAC 40 / DAX ETFs) EXSA.DE trailing P/E of 18.62x gives an earnings yield of (1÷18.62) = 5.37%. Using the ECB euro-area AAA yield curve 10Y (3.15%, ECB YC API, 2026-07-15) as a Bund-equivalent reference (the ECB AAA curve substitutes for a direct German Bund quote), the euro-area ERP is +2.22% — comfortably positive and far more attractive than the US, reinforcing Europe's relative-value case versus the US. Currency risk (EUR/USD) matters for non-EUR holders; today's flows were unremarkable. Geopolitical exposure (Iran-related oil price pressure and any spillover to European energy costs) is a live risk to monitor.
Japan (Nikkei / TOPIX ETFs) Nikkei fell 2.79% today, in sympathy with the broader Asian chip-stock selloff. The Bank of Japan hiked its policy rate 25 bps to 1.00% on June 16, 2026 (effective June 17) — the highest since 1995 — with board guidance pointing toward a further gradual path to a ~2% neutral rate. Rising Japanese rates are a headwind for JPY-hedged equity ETF holders and increase JGB competition for equity capital; the Nikkei's trailing P/E (1321.T proxy, 21.72x) is only modestly above its historical range (+3%), so valuation itself is not the main risk here — policy normalization is.
Emerging Markets (MSCI EM ETFs) EEM trades at 16.55x trailing earnings, +18% over its historical range — a smaller premium than developed markets but not the deep discount EM has traded at historically. Today's -2.04% EEM move and the Kospi crash underline concentrated single-country/single-sector risk within the EM basket (Korea's heavy semiconductor weighting via Samsung/SK Hynix). China weight (Shanghai Composite -1.85% today, still 36.6% below its historical peak) remains a structural drag on the index.
Overall Risk Score (qualitative, not financial advice): - US large-cap / Nasdaq: High valuation risk, low margin of safety — negative ERP, P/E historically stretched. - Europe (STOXX 600/CAC/DAX): Moderate — fair-to-attractive relative valuation, positive ERP vs euro-area AAA yields. - Japan: Moderate — valuation reasonable, but BOJ policy-normalization risk rising. - Emerging Markets: Moderate, elevated near-term volatility — Korea/semiconductor concentration risk crystallized today.
Disclaimer: This is financial information, not personalised investment advice. Past valuations do not guarantee future returns. Consult a financial advisor before investing.
US Economic Indicators (FRED - authoritative)
| Indicator | Current | Prior | Delta | Reference Date | FRED Series |
|---|---|---|---|---|---|
| CPI YoY % | 3.46% | 4.17% (May) | -0.71 pp | June 2026 | CPIAUCSL |
| Core CPI YoY % | 2.57% | 2.82% (May) | -0.26 pp | June 2026 | CPILFESL |
| Unemployment Rate | 4.2% | 4.3% (May) | -0.1 pp | June 2026 | UNRATE |
| Nonfarm Payrolls | 158,984k | 158,927k (May) | +57k | June 2026 | PAYEMS |
| 10Y TIPS Real Yield | 2.33% | 2.31% (2026-07-09) | +0.02 pp | 2026-07-14 | DFII10 |
Headline CPI eased to 3.46% y/y (from 4.17% in May) and core CPI eased to 2.57% (from 2.82%) — a welcome cooling, though headline CPI remains above the Fed's 2% target. Unemployment ticked down to 4.2% and payrolls grew a modest +57k, consistent with a labor market that is neither overheating nor breaking down.
Other economic releases today (from web search): US Advance Retail Sales for June rose 0.2% m/m, below the 0.3% consensus — a modest miss suggesting some softening in consumer spending momentum. US Initial Jobless Claims and the Philadelphia Fed Manufacturing Survey were also on today's calendar; specific print values were not available.
Fixed Income & Bond Analysis
All US Treasury yields from FRED. European yields from the ECB Yield Curve API; UK/Japan from web search.
Policy Rates
| Central Bank | Rate | Source |
|---|---|---|
| Fed Funds (upper) | 3.75% | FRED DFEDTARU |
| Fed Funds (lower) | 3.50% | FRED DFEDTARL |
| Effective FFR | 3.63% | FRED DFF (2026-07-14) |
| ECB Deposit Rate | 2.25% | FRED ECBDFR (2026-07-16) |
| BOJ Policy Rate | 1.00% | web search — hiked 25bps 2026-06-16, effective 2026-06-17 |
| BOE Bank Rate | 3.73% | FRED IUDSOIA (SONIA proxy, 2026-07-14) |
Government Bond Yields
| Country | 2Y Yield | 10Y Yield | 30Y Yield | Source |
|---|---|---|---|---|
| USA | 4.18% | 4.58% | 5.08% | FRED |
| Eurozone (AAA proxy) | 2.68% | 3.15% | 3.62% | ECB YC API |
| UK | 4.36% | 4.94% | (not retrieved) | web |
| Japan | (not retrieved) | 2.70% | (not retrieved) | web |
| Germany/France/Italy | (not retrieved) | (not retrieved) | (not retrieved) | — |
Note: no separate German Bund, French OAT or Italian BTP figures today. The euro area AAA curve above, used as a Bund-equivalent proxy, is the source for the region, and the OAT-Bund spread is therefore not available today.
Yield Curve Spreads (FRED pre-computed): - 10Y-2Y spread: +42 bps (2026-07-15) — positive and modestly upward-sloping; no longer inverted, and well short of a historically "steep" curve (>~75bps). - 10Y-3M spread: +72 bps (2026-07-15) — positive, not signaling recession risk by this classic predictor.
Both spreads point to a normalizing, non-inverted curve — consistent with a market pricing continued (if gradual) monetary easing rather than imminent recession, even as equity markets convulsed in Korea today.
Yield Curve Charts
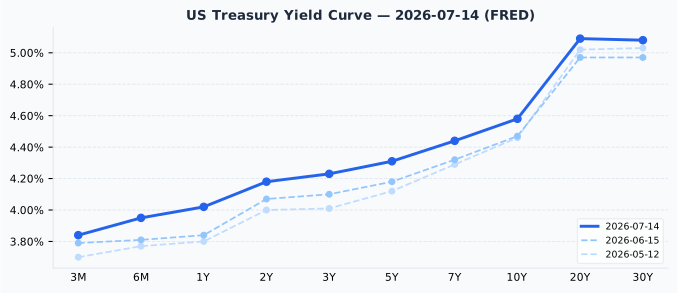
The US curve is upward-sloping across its full length with a modest hump-free progression from 3.84% (3M) to 5.08% (30Y) — a textbook "normal" shape, no inversion segment anywhere on the curve. Versus one month ago (2026-06-15), the entire curve has shifted up by roughly 8-12 bps across most maturities (e.g. 10Y: 4.47% → 4.58%), reflecting the modest back-up in yields alongside sticky-but-improving inflation data.
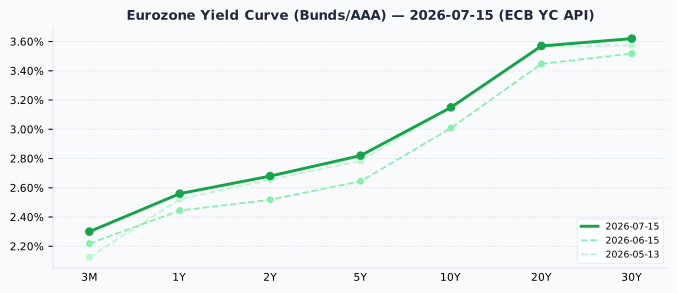
The euro-area AAA curve is also normally upward-sloping (2.30% at 3M to 3.62% at 30Y) and notably flatter in the front end than the US curve, reflecting the ECB's lower policy rate (2.25% deposit facility vs 3.50-3.75% Fed funds). Versus one month ago, the curve has shifted up modestly at the short-to-medium end (2Y: 2.52% → 2.68%) while the very long end (30Y) is roughly unchanged, a modest bear-flattening at the margin.
Credit Markets (from FRED — authoritative)
| Market | OAS Spread | Series ID |
|---|---|---|
| US Investment Grade | 79 bps | BAMLC0A0CM |
| US High Yield | 271 bps | BAMLH0A0HYM2 |
| Euro High Yield | 251 bps | BAMLHE00EHYIOAS |
Both US IG (79 bps, below the typical 80-150 bps range) and US HY (271 bps, below the typical 300-500 bps range) are historically tight — credit markets are pricing very little default/liquidity risk, a signal of complacency rather than stress. This stands in sharp contrast to today's 6%+ single-day Kospi crash: credit spreads have not (yet) repriced any of the AI-valuation anxiety visible in Asian and US tech equities. Euro HY at 251 bps is similarly tight.
Bond Portfolio Implications
The negative US equity risk premium (-0.88%, computed above) is the single clearest signal in today's data that US equities offer little valuation cushion relative to bonds — a 10Y Treasury yielding 4.58% now out-earns the S&P 500's 3.70% earnings yield. By contrast, the euro-area ERP is comfortably positive (+2.22%), making European equities the relatively more attractive of the two on a bonds-vs-stocks basis. With tight credit spreads offering little compensation for taking on corporate credit risk, and the yield curve now positively sloped, government bonds — particularly at the front end (3M–2Y, yielding 3.84–4.18%) — screen as a reasonably attractive, low-duration parking spot for capital in the current environment. Duration risk remains material further out the curve: a 100 bps rise in yields would imply roughly an 8-9% price loss on a 10-year bond, a live risk given yields have already backed up ~8-12 bps over the past month.
Currencies & Commodities
Currencies:
| Pair | Rate | Source |
|---|---|---|
| EUR/USD | 1.1438 | FRED DEXUSEU (2026-07-10) |
| USD Index | 120.50 | FRED DTWEXBGS (2026-07-10) |
| USD/JPY | 162.22 | web search |
| GBP/USD | 1.3385 | web search |
| USD/CHF | 0.8113 | web search |
Note: FRED's EUR/USD and USD Index series lag to 2026-07-10 (most recent published observation); more current levels may differ modestly.
Commodities (all from yfinance front-month futures):
| Commodity | Price | Day Chg % | Ticker | Source |
|---|---|---|---|---|
| Brent Crude | $84.13 | -0.97% | BZ=F | yfinance |
| WTI Crude | $78.13 | -1.25% | CL=F | yfinance |
| Gold ($/oz) | $3,992.00 | -1.48% | GC=F | yfinance |
| Silver ($/oz) | $56.03 | -2.45% | SI=F | yfinance |
| Copper ($/lb) | $6.31 | -0.47% | HG=F | yfinance |
| Nat Gas ($/MMBtu) | $2.85 | -2.46% | NG=F | yfinance |
Both crude benchmarks eased today despite the ongoing US-Iran military conflict, and both remain well below their all-time highs: WTI is 47% below its $147.27 ATH and Brent 43% below its $147.43 ATH (both set during the 2008 spike) — the "near recent highs" language used in some news wires today refers to the past few weeks' range, not historical extremes.
Gold at $3,992/oz is 28.5% below its all-time high of $5,586.20 (also its 52-week high) — a meaningful pullback, not "near highs" language. Silver at $56.03/oz is 53.8% below its all-time high of $121.30 (also its 52-week high) — a large gap that should temper any "silver near records" framing seen elsewhere. Copper at $6.31/lb is 5.1% below its $6.65 all-time high — modestly below, not at highs. Natural gas at $2.85/MMBtu is far below its nominal all-time high of $15.78 (an extreme 2005/2008 spike unrepresentative of typical trading ranges); the more relevant context is its 52-week range of $2.48–$7.83, within which today's price sits near the low end.
Crypto: no notable (>3%) moves reported in today's search results — omitted.
Sector & Theme Highlights
The dominant global theme today is a re-pricing of AI-capex payoff expectations, triggered by TSMC's strong headline earnings (77% annual growth) being met with share-price declines rather than gains — a classic "priced for perfection" reaction that rippled through semiconductors worldwide, hitting South Korea's Samsung Electronics and SK Hynix hardest (both are heavily weighted in the Kospi and MSCI EM indices). US mega-cap tech (Nasdaq 100 -1.39%) underperformed the broader market for the same reason. Energy and defensive-leaning markets (UK, Swiss, European blue chips) outperformed on a relative basis. Geopolitical risk (continued US strikes on Iran) remains an underlying support for crude prices and a headline risk for broader risk sentiment.
Top Stories (Global)
- Kospi crashes 6.37%, triggers KRX circuit breaker — Samsung Electronics -8.8%, SK Hynix -11.5%, on AI-semiconductor profit-taking plus a surprise Bank of Korea rate hike (first since 2023).
- TSMC earnings beat (+77% y/y) but shares fall >4%, dragging global chipmakers and the Nasdaq lower on AI-valuation anxiety.
- US retail sales rise a softer-than-expected 0.2% m/m for June (vs 0.3% consensus).
- US continues military strikes on Iran; crude holds a geopolitical risk premium even as prices eased today.
- UnitedHealth Group +5.6% on a strong Q2 earnings beat; Abbott Labs +4% on an EPS beat and raised FY2026 guidance.
- United Airlines -3% after issuing weak Q3 guidance on rising fuel costs, despite an EPS beat.
- SpaceX (SPCX) falls below its $135 IPO price for the first time, amid launch-competition concerns and a looming increase in tradeable share supply.
Looking Ahead
Key events in the next 1-5 trading days: - Bank of Korea just delivered a surprise rate hike today (2026-07-16) — watch for follow-through commentary and market stabilization efforts from Korean authorities after the circuit-breaker event. - US economic data: Initial Jobless Claims and the Philadelphia Fed Manufacturing Survey were released today; watch for revisions and market reaction into Friday. - Bank of Japan normalization path continues to be watched after its June 16 hike to 1.00%, with board commentary suggesting further gradual hikes toward a ~2% neutral rate. - Q2 earnings season continues in the US following today's UnitedHealth, Abbott, and United Airlines reports — more large-cap prints expected over the coming days.
Market closures (from holiday calendar, next 5 calendar dates):
| Date | Country | Holiday |
|---|---|---|
| 2026-07-17 | South Korea | Constitution Day |
| 2026-07-20 | Japan | Marine Day |
| 2026-08-01 | Switzerland | Swiss National Day |
| 2026-08-11 | Japan | Mountain Day |
| 2026-08-15 | France | Assumption Day |
Notably, the Korean market — already reeling from today's crash — is closed tomorrow (2026-07-17) for Constitution Day, giving investors a one-day pause before the next session.