2026 08 25
Global Financial Briefing — Tuesday, 25 August 2026
Americas index levels, commodities and day changes reflect the 25 August closing print; the US Treasury row, curve spreads, real yields and US yield curve chart use Treasury's settled 25 August par curve. Euro area bond rows, the ECB curve chart, FX and macro figures are dated inline.
Market Overview
Oil did the work today. Brent settled at $87.27, down 3.61%, and WTI at $82.36, down 3.12%, a second consecutive decline after a run of 13 gains in 14 sessions, and it happened despite the US announcing fresh sanctions on Iran, which is the tell. The supply-risk premium that had been building through August is being taken back out even as the geopolitical headline escalates, which suggests the market had priced disruption that has not arrived. Everything else today follows from that single move: with the inflation impulse from energy fading, US Treasury yields fell across the settled curve, the 10-year to 4.64%, −6 bp on the day, the 30-year to 5.17%, −6 bp, and equities took the relief.
Gains were broad and firmed into the close. The S&P 500 finished up 0.32% at 7,677, the Nasdaq 100 up 0.64% and the Dow up 0.30%, each roughly double the advance showing at mid-afternoon; Europe closed firmer with the DAX +0.61% on a genuinely good domestic data day, and Asia-Pacific finished green across the board. The exception was France, where the CAC 40 fell 0.16%, the one major index in the red today, and the only large European market whose fiscal story keeps reasserting itself independently of the global tape. Emerging markets outperformed everything: EEM +1.72%, the strongest single figure in the snapshot below, with a weaker dollar and softer oil both helping. Implied volatility is unremarkable: the VIX closed at 15.85 (FRED VIXCLS, 24 Aug), squarely in the moderate 15–20 band, showing neither the complacency of a sub-15 reading nor any sign of stress.
Germany supplied the day's macro. The Ifo business climate index came in at 88.8 against 87.2 expected, its highest reading in a year and a fourth consecutive monthly rise, with the forward-looking expectations component jumping to 89.1 from 86.8. Read that as direction, not level: 88.8 is still weak in absolute terms, but expectations leading means the forward-looking component is turning rather than current conditions merely stabilising. Q2 GDP at +0.3% q/q adds only loose support, since the revision is unsettled and the composition is export-led with household consumption up 0.1%.
Two cross-asset signals corroborate a cyclical bid rather than a broad risk-on move: copper settled within 0.21% of its record on a day crude fell more than 3%, and the sector split ran industrials and materials up, energy down. But the DAX's +0.61% led Europe while the CAC 40 closed red, and the broader index gains owed more to falling oil and the 6 bp drop in US yields than to the German data. Set against all of it: euro-area long-term borrowing costs have been rising all summer, with the AAA 30-year at 3.73%, up 11 bp from a month ago. Equity investors are pricing a German cyclical recovery while bond investors raise the cost of financing it. Whether that recovery outpaces its own rising discount rate, rather than how European valuations compare with US ones, is the live question for a euro-based investor.
Global Indices Snapshot
Americas
| Index | Level | Day Chg | Day Chg % | Source |
|---|---|---|---|---|
| S&P 500 | 7,677.28 | +24.42 | +0.32% | yfinance ^GSPC |
| Nasdaq 100 | 29,209.23 | +186.05 | +0.64% | yfinance ^NDX |
| Dow Jones | 53,577.40 | +160.24 | +0.30% | yfinance ^DJI |
| Brazil IBOV | 174,576.80 | +2,670.08 | +1.55% | yfinance ^BVSP |
Americas data reflects the 25 Aug close. FRED SP500 publishes the same 7,677.28 for
2026-08-25, confirming the S&P 500 close to the cent.
Europe
| Index | Level | Day Chg | Day Chg % | Source |
|---|---|---|---|---|
| Euro STOXX 600 | 656.48 | +2.27 | +0.35% | yfinance ^STOXX |
| Euro STOXX 50 | 6,455.63 | +7.65 | +0.12% | yfinance ^STOXX50E |
| CAC 40 | 8,439.20 | −13.81 | −0.16% | yfinance ^FCHI |
| DAX | 26,266.14 | +159.54 | +0.61% | yfinance ^GDAXI |
| FTSE 100 | 10,886.16 | +31.84 | +0.29% | yfinance ^FTSE |
| SMI (Swiss) | 14,525.29 | +78.10 | +0.54% | yfinance ^SSMI |
European data reflects today's close (25 Aug).
Asia-Pacific
| Index | Level | Day Chg | Day Chg % | Source |
|---|---|---|---|---|
| Nikkei 225 | 65,856.43 | +328.34 | +0.50% | yfinance ^N225 |
| Hang Seng | 25,511.10 | −6.23 | −0.02% | yfinance ^HSI |
| Shanghai Comp | 3,889.44 | +7.44 | +0.19% | yfinance 000001.SS |
| ASX 200 | 9,164.60 | +61.50 | +0.68% | yfinance ^AXJO |
| Kospi (Korea) | 6,742.74 | +45.78 | +0.68% | yfinance ^KS11 |
Asia-Pacific data reflects today's close (25 Aug).
Emerging Markets
| Index | Level | Day Chg % | Source |
|---|---|---|---|
| MSCI EM (EEM) | 67.25 | +1.72% | yfinance EEM |
| India Nifty 50 | 24,334.55 | +0.48% | yfinance ^NSEI |
| South Africa | 72.51 | +1.65% | yfinance EZA |
EEM and EZA are US-listed ETFs shown at the 25 Aug close; Nifty 50 reflects the Mumbai close.
Where the indices sit against their records. No major index is at a record today. The S&P 500 is 1.8% below its all-time high of 7,816.70 and the FTSE 100, STOXX 600, SMI and DAX are each about 1% below theirs: close, but none inside the range that would justify calling it a record high. Further back: the Nasdaq 100 is 5.0% below its peak and, notably, closed below its 50-day moving average (29,209 vs 29,316) while holding well above its 200-day, the first technical crack in the AI-led leadership. The Nikkei is 9.6% below its high and also under its 50-day. The Kospi remains 28% below its record after July's 22.2% drawdown, and today's +0.68% is part of a slow stabilisation rather than a recovery.
Index Valuations & Investment Risk
Valuation Table
| Index | Trailing P/E (live) | Hist avg trailing P/E (†) | Premium to hist avg midpoint |
|---|---|---|---|
| S&P 500 | 25.76x | ~16–18x | +51.6% |
| Nasdaq 100 | 30.34x | ~25–30x | +10.3% |
| Euro STOXX 600 | 18.11x | ~15–17x | +13.2% |
| CAC 40 | 17.32x | ~14–16x | +15.5% |
| DAX | 19.02x | ~15–17x | +18.9% |
| FTSE 100 | 18.29x | ~13–15x | +30.6% |
| Nikkei 225 | 22.19x | ~20–22x | +5.7% |
| MSCI EM | 17.38x | ~13–15x | +24.2% |
(†) Static long-run reference constants, not live data. Live trailing P/E from yfinance
trailingPE on ETF proxies (SPY, QQQ, EXSA.DE, CAC.PA, EXS1.DE, ISF.L, 1321.T, EEM), fetched
25 Aug 17:27 CEST. Bold marks a premium above 20%.
The distribution matters more than any single row. The S&P 500's 51.6% premium is far and away the largest, and it is not being driven by the Nasdaq: the Nasdaq 100 sits only 10.3% above its own historical range, because that range is already high. In other words the expensive part of the US market on this measure is the broad index relative to its own history, not the tech complex relative to tech's history. Europe is uniformly mid-teens premium, 13% to 19% across four indices, a tight cluster. The two surprises are the FTSE 100 at +30.6%, which has quietly re-rated out of its long-standing discount, and MSCI EM at +24.2%, which undercuts the reflexive "EM is the cheap asset class" framing: at 17.38x it now trades at a premium to its own history and only a 33% discount to the S&P, narrower than the headline suggests.
Investment Risk Assessment for ETF Investors
United States (S&P 500 / Nasdaq ETFs). At 25.76x trailing, the S&P 500 earnings yield is (1÷25.76) = 3.88%, against a settled 10-year Treasury at 4.64%, an earnings yield gap of −0.76 pp. Bonds pay more current income than equities today. On the real-yield version, which corrects for the fact that equity earnings grow with inflation while a bond coupon does not, the gap flips positive: 3.88% − 2.32% (10Y TIPS) = +1.56 pp. The size of that correction, 2.32 pp, is larger than the gap itself, which is exactly why the nominal figure alone should not carry the argument. The Nasdaq 100 is thinner still, at a 3.30% earnings yield, −1.34 pp against the 10-year nominal.
Neither number forecasts returns. What they say is narrow and useful: an investor allocating money today can lock a 4.64% nominal Treasury coupon or accept US equity risk at a 3.88% earnings yield, of which only the dividend-and-buyback portion actually arrives as cash; the rest is retained by the company. Real yields at 2.32% remain the binding constraint on the multiple; they have not fallen materially, and the S&P's 51.6% premium to its historical average is being sustained against that backdrop rather than because of an easing in it. Concentration risk in the mega-cap AI complex is unchanged, and the Nasdaq 100 closing below its 50-day average is the first mild technical signal to watch there.
Europe (STOXX 600 / CAC 40 / DAX ETFs). The STOXX 600 at 18.11x yields 5.52%, against a euro AAA 10-year of 3.28%, a euro earnings yield gap of +2.24 pp (or +2.28 pp measured against the Bund at ~3.24%). On the real basis, using the euro real 10-year of 1.24% derived below, the gap widens to +4.28 pp. Europe therefore offers meaningfully more current income relative to its own bond market than the US does, but part of that difference is simply the gap between US and euro-area inflation and policy paths rather than a difference in risk compensation, so the pairing needs the real-yield version alongside it, which is what the +1.56 pp / +4.28 pp comparison provides.
Today's Ifo print is the constructive part of the case, though a German one rather than a European one: a one-year high with the expectations component leading, which is the component that matters for the earnings behind those multiples. Read it as a turn in direction off a still-weak level, not as evidence that European earnings are already reaccelerating. The offsetting risks are the French fiscal position (the OAT-Bund spread at ~84 bp on a 21 Aug reference, and the CAC the only major index down today) and the euro long end, where the AAA 30-year at 3.73% is 11 bp higher than a month ago.
On currency: a euro-based investor holding EUR-quoted European funds has no FX effect on the quoted value of the holding, but real FX exposure remains inside the earnings: CAC 40 and STOXX 600 constituents are multinationals earning abroad, and today's dollar softness cuts both ways for them. The exposure is smaller, slower and partly hedged by foreign cost bases, not absent.
Japan (Nikkei / TOPIX ETFs). The Nikkei at 22.19x is the least stretched major index against its own history (+5.7%). The dominant risk is policy: the BOJ's underlying inflation gauge held at 2.3% in July, above target, and the market is positioning for a September hike from the current 1.00%. With USD/JPY at 159.29 a hike is as much an FX event as a rates one, and the currency decision, hedged or unhedged, is likely to matter more to a euro-based holder's return than the index level. The Nikkei sitting 9.6% below its high and under its 50-day average reflects that uncertainty being priced.
Emerging Markets (MSCI EM ETFs). EEM's +1.72% was today's best major move, helped by softer oil and a weaker dollar. But the valuation case has eroded: 17.38x trailing is 24% above EM's own historical average and gives a 5.75% earnings yield, better than the US, worse than Europe's STOXX 600. The discount to developed markets is now a discount to the US specifically, not to developed markets generally. China weight remains the structural swing factor, and the Shanghai Composite is below both its 50- and 200-day averages.
Overall Risk Score: Moderate: fair value with mixed signals, tilted regionally. The US carries high valuation risk / low margin of safety on both the P/E premium and the negative nominal earnings yield gap. Europe and Japan sit closer to fair value with better income compensation relative to their own bond markets. EM has lost most of its valuation cushion.
Disclaimer: This is financial information, not personalised investment advice. Past valuations do not guarantee future returns. Consult a financial advisor before investing.
US Economic Indicators (FRED, authoritative)
| Indicator | Current | Prior | Delta | Reference Date | FRED Series |
|---|---|---|---|---|---|
| CPI YoY % | 3.30% | — | — | Jul 2026 | CPIAUCSL |
| Core CPI YoY % | 2.47% | — | — | Jul 2026 | CPILFESL |
| Unemployment Rate | 4.1% | — | — | Jul 2026 | UNRATE |
| Nonfarm Payrolls | 158,858k | 158,881k | −23k | Jul 2026 | PAYEMS |
| 10Y TIPS Real Yield | 2.32% | — | — | 2026-08-25 | DFII10 (US Treasury real curve) |
FRED macro data is monthly and lags 4–6 weeks; July remains the latest reference month, so nothing here has changed since yesterday. The combination is still the awkward one: headline CPI at 3.30% with core at 2.47%, alongside an outright −23k contraction in payrolls. Today's oil decline, if it holds, works on the headline side of that, since energy is most of the wedge between 3.30% and 2.47%. That is precisely why the front end barely moved while the belly and long end rallied: the 3-month par yield eased 1 bp to 3.86% while the 2-year fell 7 bp and the 10- and 30-year each fell 6 bp.
Other economic releases today. Germany's Ifo business climate index was the headline: 88.8 in August against 87.2 consensus, the highest in a year and a fourth consecutive increase, with expectations at 89.1 (from 86.8) and current conditions at 88.5 (from 86.5). Reporting on the German Q2 GDP final also puts the quarter at +0.3% q/q, revised up from the +0.2% flash. Note that yesterday's Destatis detailed accounts were reported at +0.2%, so treat the third decimal as unsettled until the next official confirmation. Composition, on both readings, is export-led (exports +2.0% q/q) with household consumption up only 0.1%. In Japan, the BOJ's underlying inflation gauge (ex-fresh-food, ex-policy-effects) rose 2.3% y/y in July, keeping a September hike live.
Fixed Income & Bond Analysis
Policy Rates
| Central Bank | Rate | Source |
|---|---|---|
| Fed Funds (upper) | 3.75% | FRED DFEDTARU (2026-08-25) |
| Fed Funds (lower) | 3.50% | FRED DFEDTARL (2026-08-25) |
| Effective FFR | 3.63% | FRED DFF (2026-08-21) |
| ECB Deposit Rate | 2.25% | FRED ECBDFR (2026-08-25) |
| BOJ Policy Rate | 1.00% | web search (held at Jul 2026 MPM; +25 bp in June) |
| BOE Bank Rate | ~3.73% | FRED IUDSOIA (SONIA proxy, 2026-08-21) |
Government Bond Yields
| Country | 2Y Yield | 10Y Yield | 30Y Yield | Day Chg (10Y) | Source |
|---|---|---|---|---|---|
| USA | 4.17% | 4.64% | 5.17% | −6.0 bp | US Treasury par curve (2026-08-25) |
| Euro AAA | 2.80% | 3.28% | 3.73% | — | ECB YC API (2026-08-24) |
| Germany | (not retrieved) | ~3.24% | (not retrieved) | — | web (2026-08-21 ref) |
| France | (not retrieved) | 4.08% | (not retrieved) | — | web (2026-08-21 ref) |
| UK | (not retrieved) | 5.06% | (not retrieved) | — | web (2026-08-24 ref) |
| Japan | (not retrieved) | ~2.88% | (not retrieved) | — | web (2026-08-25) |
| Italy | (not retrieved) | (not retrieved) | (not retrieved) | — | — |
The USA row is settled data for 25 August throughout, with the day change measured against the 24 August par curve (10Y 4.70% → 4.64%), so this row and the spreads below describe the same session as the equity and commodity tables. The "Euro AAA" row is the ECB's AAA-rated euro area composite, the term structure used for the chart and the real-yield work below; the Germany row is the Bund specifically. UK 2-year, German 2-year and Italian BTP levels could not be retrieved and are left blank rather than estimated or carried forward.
Yield Curve Spreads (US Treasury par curve, 2026-08-25):
- 10Y–2Y: +47 bp, positively sloped and not inverted, but well short of the ~75 bp that would count as steep historically. The curve has been normalising through the summer without yet reaching a normal shape.
- 10Y–3M: +78 bp, comfortably positive, so no recession signal from the classic measure.
Read together, the two spreads say the market expects policy to stay roughly where it is: the front end is anchored near the Fed funds midpoint (the 3-month par yield of 3.86% sits 23.5 bp above the 3.625% midpoint, so the bill market is not discounting a near-term cut), while the term premium is doing the work further out. The UK is the outlier in the table: a 10-year gilt above 5% is 42 bp over the equivalent Treasury and roughly 180 bp over the euro AAA curve.
OAT-Bund Spread: ~84 bp (21 Aug reference, web). Still elevated by pre-2024 standards and the reason the CAC underperformed a broadly green European tape today. This is a stale reference; no fresher print was retrievable.
Yield Curve Charts
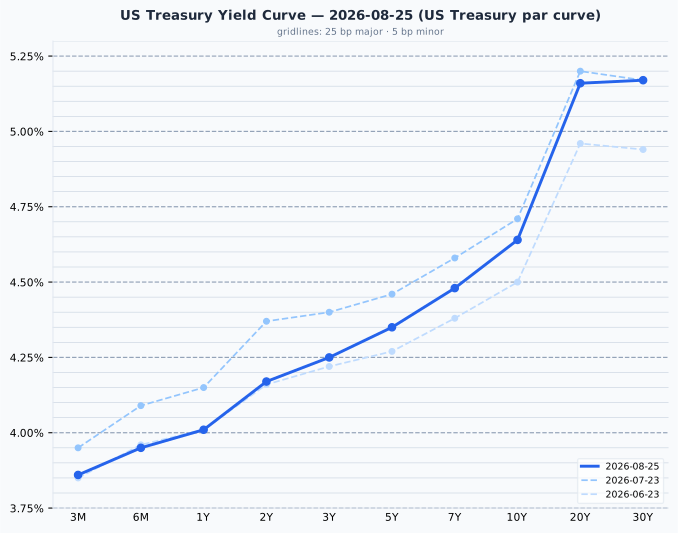
The US curve is upward-sloping across its whole length with a pronounced steepening beyond 10 years; the 10s30s segment alone accounts for 53 bp. Against a month ago (27 July) the whole curve sits lower, but unevenly: the front and belly have fallen hardest (2Y −20 bp, 3M −9 bp, 5Y −11 bp) while the very long end is unchanged (30Y flat at 5.17%, 20Y −4 bp). That is a bull steepening, the front end rallying on a softening labour market while the term premium at 30 years refuses to come in.
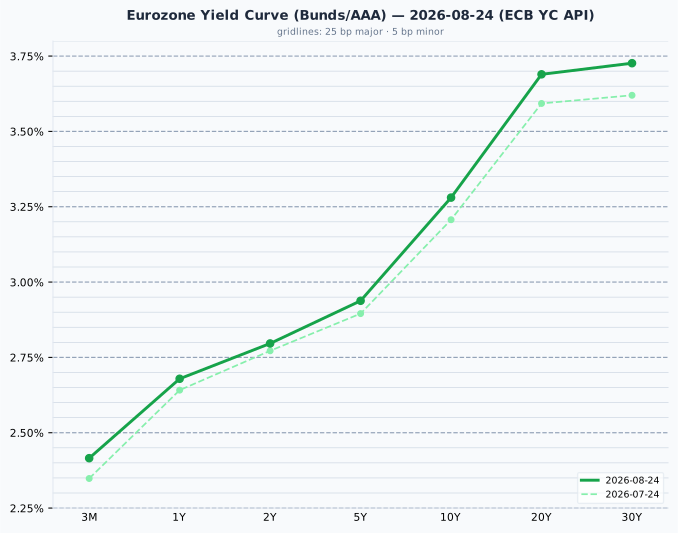
The euro AAA curve is uniformly upward-sloping and steeper in relative terms than the US, at 131 bp from 3M to 10Y against the US's 78 bp, reflecting a policy rate anchored much lower. Against 24 July the whole curve has shifted up, and disproportionately at the long end (10Y +7 bp, 20Y +10 bp, 30Y +11 bp against 3M +7 bp): euro-area investors are being asked for more term premium than a month ago, at the same time as the growth data is improving.
Credit Markets (FRED, authoritative)
| Market | OAS Spread | Series ID | Reference Date |
|---|---|---|---|
| US Investment Grade | 81 bp | BAMLC0A0CM | 2026-08-24 |
| US High Yield | 269 bp | BAMLH0A0HYM2 | 2026-08-24 |
| Euro High Yield | 254 bp | BAMLHE00EHYIOAS | 2026-08-24 |
All three are historically tight. US high yield at 269 bp sits below the 300–500 bp range that is normal for the asset class, and investment grade at 81 bp is at the very bottom edge of its 80–150 bp normal band. This is a market pricing essentially no credit stress. The read is either complacency or genuine confidence in corporate fundamentals, and the two are indistinguishable from the spread alone. What it does mean concretely is that credit risk is being poorly paid: an extra 188 bp for stepping from IG to HY is thin compensation for the default risk difference. Euro HY at 254 bp is tighter still than its US counterpart.
Real Yields (US and Euro Area)
| Region | Nominal 10Y | Expected inflation | Real 10Y | How the real yield is obtained |
|---|---|---|---|---|
| United States | 4.64% | 2.32% (residual) | 2.32% | Measured. TIPS trade, so the market quotes a real yield directly; expected inflation is the residual (the breakeven) |
| Euro area | 3.28% | 2.04% (measured, ECB SPF 2026-Q3) | 1.24% | Constructed. No euro inflation-linked benchmark is published, so a survey expectation is subtracted from the nominal yield |
The two rows are built in opposite directions and only one of them is a price. The US real yield of 2.32% is something an investor can actually buy; expected inflation is what falls out of it. The euro real yield of 1.24% is a residual, the AAA nominal less a survey expectation, and nobody trades it. Treat it as the softer number of the pair. Two further mismatches when comparing them: the US breakeven embeds an inflation risk premium that a survey does not, and the SPF horizon is five years against the bond's ten.
Decomposing the 136 bp nominal gap between the US 10-year and the euro AAA 10-year: only 28 bp of it is a difference in expected inflation (2.32% vs 2.04%), while 108 bp is a difference in real rates (2.32% vs 1.24%). This is overwhelmingly a real-rate story, not an inflation story. That is the same conclusion as earlier in the month, though the real component has narrowed from 130 bp on 7 August as the euro long end has backed up and US real yields have eased.
The US–euro real rate gap is not an investment opportunity
The 108 bp real advantage the US 10-year shows over the euro AAA curve is a structural feature (higher US trend growth, euro-area excess savings, Bund scarcity, US fiscal supply) and has been positive in every quarter since 2014. It is not something a euro-based investor can capture. Hedging the currency cancels it almost exactly, because the forward rate is set to remove the interest differential; unhedged, buying Treasuries for the yield pickup is a bet on the dollar, not a bond decision. A real yield is real in its own currency: 2.32% means 2.32% above US inflation, which is not a real return for someone who spends euros. Read the gap as a statement about relative policy stance and growth expectations, and draw no portfolio conclusion from it.
Bond Portfolio Implications
On current income alone, US bonds beat US equities and European equities beat European bonds. The S&P 500 earnings yield gap is −0.76 pp nominal (3.88% vs 4.64%) and +1.56 pp real (3.88% vs 2.32%); the euro gap is +2.24 pp nominal (5.52% vs 3.28%) and +4.28 pp real (5.52% vs 1.24%). Two caveats belong with every one of those figures. First, the gap ignores earnings growth entirely: a bond coupon is fixed for a decade while the earnings behind the equity yield grow roughly with inflation, which is why the real-yield version is the cleaner statement and why the 2.32 pp correction on the US side is large enough to flip the sign. Second, an equity holder does not receive the full earnings yield in cash; only the dividend and buyback portion arrives, and the remainder is retained.
The cross-regional comparison needs the same care. Europe's larger gap is partly the euro area's lower nominal rate structure showing through, not a cleaner risk-reward, though after the real correction Europe still comes out ahead (+4.28 pp vs +1.56 pp), and the decomposition above shows that difference is mostly real rates rather than inflation.
For forward-looking valuation work, lean on earnings yield relative to each index's own history rather than on this gap, which describes today's trade-off and nothing beyond it.
Duration. With the 10-year at 4.64% settled and the 30-year at 5.17%, a 100 bp rise in yields costs roughly 8–9% on a 10-year bond and closer to 17–19% on a 30-year. The curve's shape argues for the short-to-intermediate part: the 2-year at 4.17% captures 90% of the 10-year's yield with a fifth of the duration risk, and the extra 53 bp from 10 to 30 years is poor compensation for more than doubling the interest-rate exposure, especially with the long end still repricing upward in both currency blocs.
Currencies & Commodities
Currencies:
| Pair | Rate | Source |
|---|---|---|
| EUR/USD | 1.1684 | FRED DEXUSEU (2026-08-21) |
| USD Index | 118.06 | FRED DTWEXBGS (2026-08-21) |
| USD/JPY | 159.29 | web search |
| GBP/USD | 1.3644 | web search |
| USD/CHF | 0.8118 | web search |
The FRED pairs carry a 21 August reference date; those are the freshest published observations, not today's rates. USD/JPY near 159 is the number to watch: with the BOJ possibly hiking in September, this is the level that makes a hike an FX event rather than a rates one.
Commodities:
| Commodity | Price | Day Chg % | Ticker | Source |
|---|---|---|---|---|
| Brent Crude | 87.27 | −3.61% | BZ=F | yfinance |
| WTI Crude | 82.36 | −3.12% | CL=F | yfinance |
| Gold ($/oz) | 4,694.50 | −0.07% | GC=F | yfinance |
| Silver ($/oz) | 68.682 | +0.13% | SI=F | yfinance |
| Copper ($/lb) | 6.7140 | +1.65% | HGU26 | yfinance |
| Nat Gas ($/MMBtu) | 2.821 | −0.49% | NG=F | yfinance |
Day changes are settlement (25 Aug) vs settlement (24 Aug), the market convention for a completed session. These are the exchange settlement prices, not the last trades of the evening session, which ran on until 17:00 ET.
Crude is the story and the second down day in a row. Brent's −3.61% and WTI's −3.12% unwind a
notable part of the August run-up, and they came against the direction of the news flow: the US
tightened sanctions on Iran the same day. Both grades sit well inside their 52-week ranges (WTI
between $54.98 and $119.48, Brent between $58.72 and $126.10), which is the useful context here;
their all-time highs date from July 2008 and say nothing about a market that has been structurally
rebuilt since. Two contract notes. The Brent generic has rolled: BZ=F now points at the November
contract (BZX26), while Yahoo's expiry field still shows the October date, so a level discontinuity
against the previous quote is a contract change rather than a market move. Copper's generic has
rolled too, from the September contract (HGU26) to December (HGZ26), since these figures were taken.
The copper row above is priced from HGU26, the contract these figures describe, so a reader
comparing it against a current HG=F screen quote will see a higher number: that gap is the roll,
not a move.
Gold settled essentially flat at $4,694.50 (−0.07%), and sits 16.0% below its all-time high of $5,586.20 (set 29 January 2026), a meaningful distance, not "near" its record on any reading. Silver settled at $68.682 (+0.13%), 43.4% below its all-time high of $121.30, also from 29 January; the precious metals complex has not recovered from that peak and a flat session does nothing to change that. The absence of a bid in gold on a day when yields fell 6 bp is itself worth noting: the metal is not currently trading as a rates instrument.
Copper is the other side of the ledger: +1.65% to $6.7140/lb, effectively at all-time highs: its record of $6.728 was set on 6 August, just 0.21% above the settlement. A metal within a fifth of a percent of its record on the same day crude falls more than 3% is a fairly clean split between the growth trade and the geopolitical-supply trade, and the German data fits that reading. Natural gas settled at $2.821 (−0.49%), near the bottom of its 52-week range ($2.483–$7.827).
Crypto: no moves above the 3% threshold retrieved for today; omitted.
Sector & Theme Highlights
Energy was the day's worst place to be, on both the commodity and, by extension, the equity side; a fall of more than 3% in crude does not leave producer margins untouched. The mirror image was industrial and materials exposure, with copper settling a fifth of a percent shy of its record and the German data supporting the cyclical case; the DAX's +0.61% leading Europe is consistent with that rotation rather than with a broad risk-on move.
Three cross-market themes stand out today:
- The energy-inflation link is unwinding. This is the mechanism connecting almost everything in this briefing: oil down → the headline-inflation impulse fades → long yields fall → equities and duration both rally. It also explains why the front end did not move: the Fed's problem is the labour market, not energy.
- AI leadership is wobbling, not breaking. The Nasdaq 100 gained 0.64% but closed below its 50-day average for the first time in this run, and the Kospi, dominated by two AI beneficiaries, is still 28% below its high after July's drawdown despite today's +0.68%.
- The German growth story got its best data point in a year. Ifo at a 12-month high with expectations leading is the forward-looking component turning, not just current conditions stabilising, though 88.8 is a recovery in direction from a depressed level rather than a strong economy. Copper within 0.21% of its record supports the cyclical read; the CAC 40 closing red is the reminder that this is German rather than European. The bond market's response, a long end that has risen 11 bp at 30 years over the month, is the counterweight.
Top Stories (Global)
- Oil falls for a second session, Brent settling −3.61% at $87.27 and WTI −3.12% at $82.36, following a run of 13 gains in 14 days. The decline eased bond-market inflation concerns and supported equities worldwide. (AP / BNN Bloomberg)
- The US announced new sanctions on Iran, escalating tension, and crude fell anyway. The supply-risk premium built up through August is being unwound faster than the geopolitical headlines would suggest. (AP / US News)
- German Ifo business climate hit 88.8, a one-year high and well above the 87.2 consensus, its fourth consecutive monthly rise, with the expectations component jumping to 89.1. (Reuters)
- German Q2 GDP is now reported at +0.3% q/q, revised up from the +0.2% flash, though yesterday's detailed Destatis accounts were reported at +0.2%; growth on either reading is export-led with household consumption up just 0.1%. (Reuters / Investing.com)
- The BOJ's underlying inflation gauge stayed above target at 2.3% y/y for July, reinforcing expectations of a September rate hike from the current 1.00%. JGB 10-year yields rose to ~2.88%. (Bloomberg)
- US Treasury yields fell across the settled curve as the energy-driven inflation impulse faded: the 10-year par yield −6 bp to 4.64%, the 30-year −6 bp to 5.17% and the 2-year −7 bp to 4.17%, while the 3-month eased just 1 bp. (US Treasury par curve, 25 Aug)
- South Korea's Kospi added 0.68%, one of the world's larger moves, continuing to steady after plunging 22.2% in July. (AP)
Looking Ahead
Central banks. The BOJ's September meeting is now the most consequential date on the calendar: underlying inflation above target and a 1.00% policy rate have the market positioned for a hike, with USD/JPY at 159 amplifying the stakes. No Fed or ECB decision falls in the next five sessions; watch instead for speakers, given a US labour market showing an outright payrolls contraction.
Data. German consumer confidence (GfK) and euro-area sentiment indicators follow this week's Ifo. US new home sales and the second estimate of Q2 GDP are the notable American releases, with the next payrolls report the genuinely market-moving one; after a −23k print, the follow-up matters more than usual.
Energy. Whether crude's two-day decline extends is the single biggest swing factor for the rates and equity picture described above. The current setup, falling prices into rising sanctions pressure, is unstable in both directions.
Market closures (Nager.Date holiday calendar):
- Monday 31 August. United Kingdom: Summer Bank Holiday. London markets closed.
- Monday 7 September. United States (Labour Day), Canada (Labour Day), Brazil (Independence Day). Three of the four Americas markets in this briefing closed.
No closures in Germany, France, Japan, Australia, Switzerland or South Korea in the next two weeks. (India's entry in that calendar is empty, so Indian closures are not covered by this list.)
Special Analysis: How the Ifo Business Climate Index Works, and Where It Fails
Added 26 August 2026. The Ifo index that drove today's German cyclical bid is a monthly survey of roughly 9,000 firms, and its reliability rests not on the sample resembling the German economy but on its being a stable panel asked deliberately crude questions. That design tells you reliably which way German business conditions are turning but not by how much, which is why the 88.8 print above is read as a turn in direction rather than as a measurement of German economic strength.
Two questions, 9,000 firms
The Ifo Institute in Munich has run the survey since 1972. It asks each firm in manufacturing, services, trade and construction two things: how it judges its current business situation (good, satisfactory or poor), and what it expects for the next six months (more favourable, unchanged or more unfavourable). The headline Business Climate index is the geometric mean of the balances of those two answers, normalised to 2015 = 100. Ifo publishes all three numbers, and the Expectations sub-index is usually the market mover, with Current Assessment confirming where the economy already is. A divergence between them, expectations falling while the current reading holds up, is the classic early warning of a turn.
What the numbers on the scale mean
The single most misread thing about Ifo is that 100 is not a neutral point. It is a base year. The series is scaled so that the average of 2015 equals 100, and 2015 was simply a reasonable year for Germany, chosen as a reference. Nothing about 100 marks a boundary between growth and contraction, and a reading below it does not mean the economy is shrinking. Today's 88.8 says conditions are judged materially worse than they were on average in 2015, and by itself it says nothing more precise than that.
This is worth stating plainly because the two indicators most often quoted alongside Ifo do have meaningful reference points, and the habit transfers:
| Indicator | Reference point | Does it mean anything on its own? |
|---|---|---|
| Ifo Business Climate | 2015 = 100 | No. An arbitrary base year |
| INSEE Business Climate | 100 = long-run average, sd 10 | Yes. 90 is one standard deviation below normal |
| S&P Global / HCOB PMI | 50 | Yes. By construction, the expansion/contraction line |
The PMI's 50 is a genuine threshold because a diffusion index measures the share of firms reporting improvement against the share reporting deterioration, so 50 is the point where they balance. INSEE's 100 is genuine because the index is explicitly normalised to its own history. Ifo's 100 is neither. It is where the index happened to sit in a year somebody picked.
The consequence runs through everything below. An Ifo level can only be read against Ifo's own past, which is the deeper reason this briefing treats the print as a direction rather than a measurement: the number has no intrinsic zero to measure from. What carries information is the change, the run of four consecutive rises, and the position relative to the index's own recent range, which is what "highest in a year" is doing in the reporting above.
All three published figures, the headline and both sub-indices, sit on the same 2015 = 100 basis, so today's 88.5 current conditions and 89.1 expectations are directly comparable with each other and with the 88.8 headline.
Why a panel of that size can carry a signal
Sample size is the least of the objections: 9,000 firms is enormous by survey standards, when national election polls run on 1,000 to 2,000 respondents. Three design features do the actual work.
It is a panel, not a fresh sample. The same firms answer every month, so the survey is not trying to measure the level of German business conditions in any absolute sense. It measures the change in what a fixed set of respondents says. Firm-specific bias, a chronically gloomy finance director, a sector that always describes itself as squeezed, is roughly constant month to month and cancels out of the difference. The panel does not need to be representative for that to work. It needs to be stable, and to move when the economy moves.
The questions are ordinal, not numeric. "Better, same, worse" is a question a firm can answer accurately with little effort and little incentive to shade. Ask instead for a revenue forecast and the answer picks up anchoring, strategic shading, and whoever happened to fill in the form. The balance statistic, the share saying better minus the share saying worse, then discards magnitude and keeps only direction, which is the part firms know reliably.
Weighting is stratified, not one firm one vote. Responses are weighted by sector and firm size against the national business register, since a plant employing 8,000 people carries more of German output than a twelve-person workshop.
The justification for the whole apparatus is then empirical rather than theoretical. Nobody proved from first principles that this should track GDP. It was checked against five decades of subsequent hard data, and the correlation with industrial production and GDP one to two quarters out held up. That is the entire case for the indicator.
Where the scepticism is warranted
- Survivorship and non-response. Firms in serious trouble stop replying before they fail. The panel is quietly biased toward survivors, which flatters the reading exactly when it matters most.
- Reflexivity. Respondents read the same newspapers as everyone else. Some of what the expectations component captures is media narrative rather than order books, which is why it can move on sentiment with no change in underlying activity.
- Structural drift. Ifo's roots are manufacturing-heavy, and manufacturing is a shrinking share of German output. The panel is refreshed and the index re-based, but there is always some lag behind the real composition of the economy.
- Level readings are weak. The survey is good at direction and turning points and mediocre at magnitude. Treating 94.2 as meaningfully different from 95.1 is over-reading the instrument.
- Post-2020 divergence. Since the pandemic the survey has repeatedly signalled downturns far deeper than the output data later showed. Part of the reason is arithmetic: the balance counts how many firms say conditions worsened, never by how much, so a mild problem affecting nearly every firm produces the same reading as a severe one affecting a few. Energy price spikes and supply disruption hit in exactly that shape, mildly but almost everywhere, which is why they push the index down harder than they push output down. Why the gap has stayed so wide since 2020 is unresolved.
Reading today's 88.8
Applied to this briefing: 88.8 is a fourth consecutive rise off a depressed base with the expectations component leading, which is a genuine turn in direction. It is not an economy in good shape, and the absolute level says so. What the print licenses is the reading that the forward-looking component has turned; what it does not license is a claim that German output is already reaccelerating. That is why the corroboration matters more than the print itself: copper settling within 0.21% of its record on a day crude fell more than 3%, and a sector split running industrials and materials up against energy down, are cross-asset confirmation of a cyclical bid that no single survey could establish on its own.
The same caution applies to the surprise. Consensus was 87.2, so the 1.6-point beat is what moved the market, and the market reaction to Ifo is generally driven by the gap to consensus rather than by the absolute number.
The French equivalents
France runs two comparable surveys, and they are different instruments. INSEE's Business Climate Indicator is the closer analogue: roughly 27,000 firms, with the composite extracted by principal component analysis rather than Ifo's geometric mean, and normalised so the long-run average is 100 with a standard deviation of 10. That normalisation matters for reading it, since 95 on INSEE is one standard deviation below normal rather than the much weaker signal 95 would represent on Ifo's scale. The Banque de France Monthly Business Survey polls around 8,500 firms and carries the central bank's quarterly GDP nowcast, which tends to move OAT spreads more than the INSEE composite does, and it publishes earlier in the month.
The practical rule for cross-country work is that Ifo and INSEE levels are not comparable. A French 97 and a German 97 are not the same statement about their economies, and each index has to be read against its own history.