2026 09 15
Global Financial Briefing — Tuesday, 15 September 2026
Americas index levels, commodities and day changes reflect the 15 September closing print; the USA row of the bond table, the curve spreads, the US real yield and the US yield curve chart use the settled 15 September Treasury curves. The euro area yield rows, credit, FX and macro figures are dated inline.
Market Overview
The day before the Fed meets, the two prices that matter most to it both moved the wrong way. The 10-year Treasury yield traded through 5% overnight, reached 5.04% at the session high and settled at 5.00% on the 15 September par curve, +3 bp on the day, the highest settlement since 2007 and the first at 5% in this briefing's history, with the 30-year at 5.36% (+2 bp), the 20-year at 5.40% (+3 bp), the 5-year at 4.83% (+3 bp), the 2-year at 4.67% (+2 bp) and the 3-month bill unchanged at 4.11%. Oil did the rest: WTI's October contract settled up 4.38% at $105.83 (against Monday's $101.39 settlement) and Brent's December contract up 2.91% at $108.75, with Saudi Arabia's East-West pipeline still offline after last week's drone strikes, Yanbu exporting from stocks that were put at five to seven days on Monday, and the physical market far above the futures: Dated Brent is reported above $130 and Dubai and Oman crudes near $128. CNBC's arithmetic that oil and the 10-year yield have not moved this closely together since 2019 is the day's summary. The oil price is the inflation, the bond market is the Fed's reaction to it, and the equity market is caught between the two. The S&P 500 closed down 0.45% at 7,585.73, back under its 50-day average (7,610), the Nasdaq 100 down 0.65% and the Dow down 0.63% (−328 points) with the banks lower for a second day after Bank of America's Monday warning on investment-banking fees; the Dow had been down 0.79% at midday and recovered part of it into the close, while the Nasdaq 100 weakened through the afternoon. The VIX closed Monday at 17.10 (FRED VIXCLS, 14 September), moderate, and is quoted around 17.5 intraday. The Fed begins its two-day meeting today with a 25 bp hike to 3.75% to 4.00% priced at 90% to 93% on futures, up from 85% to 88% on Monday, and the front of the curve has priced it: the settled 3-month bill at 4.11% is 48.5 bp above the current target midpoint.
Europe closed lower for a third day and the STOXX 600 at 634.18 (−0.28%) is at its lowest close since 12 June. The rotation was the one the day's inputs dictate: energy up 1.3%, banks down 0.9% and financial services down 1.9%, with UBS the index's worst stock at −3.4%, LVMH down 2.6% (L'Oréal overtook it as France's most valuable listed company, the first non-luxury name at the top since 2017) and Puig down 2.2% on its €1.2 bn purchase of ISDIN. The CAC 40 fell 0.34% to 8,090.28 and remains the only major European index under both its 50-day and 200-day averages; the DAX was the most resilient at −0.15%, the FTSE 100 fell 0.37% and the SMI 0.50% on UBS. The German ZEW expectations index rose to 34.7 from 34.2 against 37.0 expected, while the euro-area reading fell to 25.8 from 31.4: German investors are marginally more constructive, the rest of the bloc distinctly less so with Brent above $105 and the ECB having raised its deposit rate to 2.50% on 10 September, its second hike this year after June's move to 2.25%. The euro AAA curve for 14 September, published today, is the sharpest front-end move of this cycle: the 2-year rose 10 bp to 3.23%, the 1-year 7 bp to 3.03% and the 5-year 6 bp to 3.30%, while the 10-year rose 2 bp to 3.54% and the 30-year fell 1 bp to 3.79%. Bund quotes today put the 10-year at 3.54%, the 2-year at 3.25% and the 30-year at 3.89%; the 10-year OAT is flat at 4.50%, which narrows the OAT-Bund spread to 96 bp from 99 bp because the Bund did the moving, and Italy at 4.41% (+2 bp) yields 9 bp less than France. The 10-year gilt is quoted at 5.38% after touching 5.41% and the 30-year near 6%, a 1998 level, with UK unemployment steady at 4.9% against 5.0% expected but vacancies at a four-year low and private payrolls down 34k in August, ahead of Thursday's Bank of England decision, where a hold at 3.75% is expected. The 10-year JGB rose 5 bp to 3.04%, its highest since September 1996, three days before the BOJ is expected to raise its rate to 1.25%.
Asia finished weaker than it traded. The Nikkei was up 0.9% at lunch and closed unchanged at 63,484.10 (−0.01%); the Kospi was up 0.5% at midday and closed down 0.85% at 6,627.26, a fourth straight loss; the Hang Seng's loss widened from 0.7% at midday to 1.00% at the bell (24,667.24), the region's largest fall, and Shanghai lost 0.54% while the ASX 200 fell 0.88%. China's August data split the same way the rest of the world's has: industrial production rose 5.2% year on year against 4.8% expected, the strongest since spring, while retail sales grew 0.4% against 0.8% expected, the slowest since May, so the supply side is running and the consumer is not. USD/JPY at 155.08 (+0.47%), GBP/USD at 1.3477 (−0.16%) and USD/CHF at 0.8187 (+0.16%) all say the same thing as the 5% 10-year: the dollar is being bought into the Fed. Credit has begun to notice, marginally: US high yield at 271 bp (FRED, 14 September) is 6 bp wider than Friday's 265 bp and a basis point above Thursday's 270 bp, though still under the 300 bp floor of the normal range, with investment grade unchanged at 80 bp. Bitcoin fell to about $75,750, its lowest since 21 August, after the Senate's cloture vote on the motion to proceed to the CLARITY Act failed 49 votes to 50, short of the 60 needed.
Global Indices Snapshot
Americas
| Index | Level | Day Chg | Day Chg % | Source |
|---|---|---|---|---|
| S&P 500 | 7,585.73 | -34.25 | -0.45% | yfinance ^GSPC |
| Nasdaq 100 | 28,937.84 | -189.32 | -0.65% | yfinance ^NDX |
| Dow Jones | 52,093.10 | -328.10 | -0.63% | yfinance ^DJI |
| Brazil IBOV | 186,502.64 | +1,001.76 | +0.54% | yfinance ^BVSP |
Americas data reflects the 15 Sep close. FRED's SP500 series confirms the 15 September close at 7,585.73. The S&P 500 closed within a point of its midday level, but the Dow and the Nasdaq 100 swapped places: the Dow pared a 0.79% intraday loss to 0.63% while the Nasdaq 100 extended a 0.56% loss to 0.65%, and the Bovespa gave back part of its gain. The S&P 500 is 3.0% below its record of 7,816.70 and 0.3% under its 50-day average (7,610.07), having closed 0.1% above it on Monday; the Nasdaq 100 is 0.9% under its 50-day (29,193.51) and 5.9% below its record; the Dow is 1.6% under its 50-day and 4.8% below its record, the banks and the consumer names doing the damage. The Bovespa is the one index in the table that is up, oil at $106 finally counting for more than the emerging-market outflow that took it down 0.91% on Monday.
Europe
| Index | Level | Day Chg | Day Chg % | Source |
|---|---|---|---|---|
| Euro STOXX 600 | 634.18 | -1.81 | -0.28% | yfinance ^STOXX |
| CAC 40 | 8,090.28 | -27.50 | -0.34% | yfinance ^FCHI |
| DAX | 25,402.28 | -38.53 | -0.15% | yfinance ^GDAXI |
| FTSE 100 | 10,658.13 | -39.44 | -0.37% | yfinance ^FTSE |
| SMI (Swiss) | 13,808.87 | -69.67 | -0.50% | yfinance ^SSMI |
European data reflects today's cash close (15 Sep). The Euro STOXX 50 closed at 6,236.50, down 0.38%. The STOXX 600 is at its lowest close since 12 June, 4.4% below its record of 663.41, 2.3% under its 50-day average and 2.3% above its 200-day (620.17); it traded as low as 630.99 at 08:40 GMT before recovering most of the loss. The CAC 40 is 4.0% under its 50-day and 1.8% under its 200-day (8,240.39), the only one of the five under both, and LVMH's 2.6% fall was the largest drag on it. The DAX at −0.15% held up best, 1.3% under its 50-day and 2.7% above its 200-day; the FTSE 100 lost 0.37% despite the energy majors, and the SMI's 0.50% fall is largely UBS.
Asia-Pacific
| Index | Level | Day Chg | Day Chg % | Source |
|---|---|---|---|---|
| Nikkei 225 | 63,484.10 | -8.89 | -0.01% | yfinance ^N225 |
| Hang Seng | 24,667.24 | -250.36 | -1.00% | yfinance ^HSI |
| Shanghai Comp | 3,864.28 | -21.05 | -0.54% | yfinance 000001.SS |
| ASX 200 | 8,672.50 | -77.40 | -0.88% | yfinance ^AXJO |
| Kospi (Korea) | 6,627.26 | -57.11 | -0.85% | yfinance ^KS11 |
Asia-Pacific data reflects today's close (15 Sep). The gap between the midday press reports (Nikkei +0.9%, Kospi +0.5%, Hang Seng −0.3%) and the closes in the table is the story: every market in the region faded through the afternoon as the US 10-year held 5% and oil extended. The Kospi's fourth straight loss takes it 29.4% below its record of 9,385.59 and 2.3% under its 50-day average, still 7.8% above its 200-day; the Nikkei is 12.8% below its record and 3.8% under its 50-day. The Hang Seng at 24,667 is 3.7% under its 200-day (25,621) and 2.3% under its 50-day, and Shanghai at 3,864 is 3.6% under its 200-day (4,009), the two Chinese markets both sitting under both averages after a retail sales print of 0.4%. The ASX 200 at 8,672.50 is 1.7% under its 200-day (8,821).
Emerging Markets
| Index | Level | Day Chg % | Source |
|---|---|---|---|
| MSCI EM (EEM) | 65.76 | -0.35% | yfinance EEM |
| India Nifty 50 | 23,118.60 | -1.19% ‡ | yfinance ^NSEI |
| South Africa | 68.92 | +0.63% | yfinance EZA |
EEM and EZA reflect the 15 September close. ‡ India Nifty 50: the quote is today's close (15:31 IST), but the day change is measured against 23,398.10, the 11 September close; yfinance carried no 14 September session for the index and no Indian holiday data is available here, so it cannot be confirmed whether Monday was a closure (in which case −1.19% is one session) or a data gap (in which case it is two). The Nifty is 4.3% under its 50-day and 5.8% under its 200-day, 12.3% below its record. EEM closed at 65.76, −0.35%, a tenth of a percent under its 50-day average (65.86) after Monday's 2.73% fall; EZA rose 0.63% with gold slightly lower and copper up.
Index Valuations & Investment Risk
Valuation Table
| Index | Trailing P/E (live) | Hist avg trailing P/E (†) | Premium to hist avg midpoint |
|---|---|---|---|
| S&P 500 | 24.47x | ~16-18x | +44.0% |
| Nasdaq 100 | 28.75x | ~25-30x | +4.5% |
| Euro STOXX 600 | 17.45x | ~15-17x | +9.1% |
| CAC 40 | 16.44x | ~14-16x | +9.6% |
| DAX | 17.99x | ~15-17x | +12.4% |
| FTSE 100 | 15.29x | ~13-15x | +9.2% |
| Nikkei 225 | 21.08x | ~20-22x | +0.4% |
| MSCI EM | 13.99x | ~13-15x | −0.1% |
(†) Hist avg trailing P/E: static long-run reference constants, not live data. Trailing P/E (live): yfinance trailingPE on the ETF proxies SPY, QQQ, EXSA.DE, CAC.PA, EXS1.DE, ISF.L, 1321.T and EEM, read 15 September at 18:50 CEST for the European and Asian proxies, on their closes; the US-listed proxies (SPY, QQQ, EEM) were re-read after the 15 September close at 24.47x, 28.72x and 13.99x, each within 0.1% of the intraday value, so the table stands as first read. Every multiple is a little lower than Monday's, the STOXX 600 by 0.24 points to 17.45x and the S&P 500 by 0.15 to 24.47x. The S&P 500 premium remains the only one above the 40% "historically stretched" threshold; MSCI EM has slipped fractionally below its long-run midpoint and the Nikkei sits on its own.
Investment Risk Assessment for ETF Investors
United States (S&P 500 / Nasdaq ETFs)
At 24.47x trailing earnings the S&P 500's earnings yield is 4.09% (1÷24.47), against a settled 10-year Treasury yield of 5.00% (US Treasury par curve, 15 September): an earnings yield gap of −0.91 pp, the same as Monday's, because the multiple's 0.15-point fall (worth 3 bp of earnings yield) was matched by the 3 bp rise in the settled 10-year. On real terms the gap is +1.47 pp (4.09% less the 2.62% TIPS yield, US Treasury real curve, 15 September); the 2.38 pp correction is the size of expected inflation the nominal version ignores. This describes today's trade-off, not tomorrow's return: a 10-year Treasury pays 5.00% fixed for a decade, an S&P 500 holder receives a 4.09% earnings yield of which only the dividend and buyback portion arrives as cash, and the rest is retained on their behalf and grows with nominal earnings. The valuation argument that does carry weight is the multiple against its own history, and +44% to the long-run midpoint is a poor starting point on that measure. Positioning: the S&P 500 at 7,586 is 3.0% below its record, 0.3% under its 50-day average and 5.8% above its 200-day (7,167); the Nasdaq 100 is 0.9% under its 50-day and 6.6% above its 200-day (27,151). Both indices closed above the 50-day on Monday and under it on Tuesday, and the 200-day is the next reference below. Concentration in the AI complex remains the dominant risk, and this week has added two independent sources of pressure on it: the industry's own pacing debate, and a 10-year at 5% that raises the discount rate on earnings that are furthest in the future. The Fed's move tomorrow is priced; the dot plot is not.
Europe (STOXX 600 / CAC 40 / DAX ETFs)
The STOXX 600 at 17.45x gives an earnings yield of 5.73% (1÷17.45). Against the euro AAA 10-year of 3.54% (ECB YC API, 14 September) the euro earnings yield gap is +2.19 pp, 6 bp wider than Monday's +2.13 pp; against the 10-year Bund quoted at 3.54% today it is the same. The euro real-yield version is +4.23 pp, using a constructed euro real 10-year of 1.50% (3.54% nominal less the 2.04% long-term HICP expectation from the ECB SPF, 2026 Q3), against +1.47 pp for the US. Part of the 3.10 pp nominal difference between the two gaps is the US-euro inflation and policy differential rather than risk compensation, and the real-yield pair narrows it to 2.76 pp; the decomposition is in the Real Yields section, and the euro real figure is the softer of the two, a survey subtracted from a yield rather than a traded price. The US trades at a 40% P/E premium to the STOXX 600 (24.47x against 17.45x), the same as Monday. Positioning: the STOXX 600 is 2.3% under its 50-day and 2.3% above its 200-day at a three-month low; the CAC 40 is under both averages, the only one of the three, and 7.6% below its record. The risks for a euro-based holder this week are an ECB that has hiked twice since June and an AAA 2-year at 3.23% that says the market expects more, a 10-year OAT at 4.50% (a 2008 level) and the earnings translation of a euro that has held 1.16 while oil has risen 30% in a quarter. The currency exposure inside a STOXX 600 or CAC 40 fund is not absent for a euro investor: the constituents earn abroad, and the sensitivity is to the dollar and to Asian demand, only partly offset by foreign cost bases.
Japan (Nikkei / TOPIX ETFs)
The Nikkei at 21.08x is at its long-run average, and the multiple has been stable while the index has fallen 12.8% from its record. The BOJ is expected on Friday to raise its policy rate from 1.00% to 1.25%, the highest since April 1995, with the 10-year JGB at 3.04% today its highest since 1996 and USD/JPY at 155.08. For a euro investor the currency question is doing the work: a hike into a market already pricing it, alongside a Fed hike the day before, leaves the yen's path to the interest differential, and an unhedged Nikkei fund carries that at full size. The 21 September Japanese holiday means the first full session after the decision is Tuesday.
Emerging Markets (MSCI EM ETFs)
EEM at 13.99x is at its long-run midpoint and at a 43% discount to the S&P 500. The index's largest single risk this week is the one Monday exposed: its Korea and Taiwan weights are the world's most concentrated exposure to the AI hardware chain, and the Kospi has now fallen four sessions running. China's retail sales at 0.4% against industrial output at 5.2% is the domestic-demand problem restated. EEM closed a tenth of a percent under its 50-day average after holding it on Monday; the dollar at a two-week high and a 5% Treasury are the headwinds.
Overall Risk Score: - US: High valuation risk / low margin of safety. A 44% premium to the long-run multiple, a negative nominal earnings yield gap to a 10-year at 5%, and both major indices back under their 50-day averages the day before a Fed hike. - Europe: Moderate. Multiples 9% to 12% above long-run averages with a +2.19 pp earnings yield gap, but the index is at a three-month low and the rates and energy inputs are moving against it. - Japan: Moderate. At its long-run average with the policy risk concentrated in Friday's decision and the currency. - EM: Moderate to attractive on valuation, with the AI-chain concentration risk now visible and a dollar that is rising into the Fed.
US Economic Indicators (FRED - authoritative)
| Indicator | Current | Prior | Delta | Reference Date | FRED Series |
|---|---|---|---|---|---|
| CPI YoY % | 3.35% | 3.30% (Jul) | +5 bp | Aug 2026 | CPIAUCSL |
| Core CPI YoY % | 2.45% | 2.47% (Jul) | −2 bp | Aug 2026 | CPILFESL |
| Unemployment Rate | 4.1% | — | — | Aug 2026 | UNRATE |
| Nonfarm Payrolls | +162k | — | monthly chg | Aug 2026 | PAYEMS |
| 10Y TIPS Real Yield | 2.62% | 2.60% (14 Sep) | +2 bp | 15 Sep 2026 | DFII10 (US Treasury real curve) |
The monthly rows are unchanged from Monday, the prior-month CPI rates being the July observations recorded in earlier briefings; only the latest observation was retrieved for unemployment and payrolls, so those Prior and Delta cells are left blank rather than filled from memory. The real 10-year is the settled 15 September figure, up 2 bp on the day against 3 bp for the nominal 10-year, so two-thirds of Tuesday's move was real and a third breakeven: the market-implied inflation rate (5.00% − 2.62%) is 2.38%, up from 2.37%.
Other economic releases today (web search):
| Release | Actual | Consensus | Prior | Reaction |
|---|---|---|---|---|
| US Empire State manufacturing, Sep | 7.6 | 14.1 | 20.6 | Miss; prices paid 63.1 (+5), prices received 28.1 (+5) |
| China industrial production, Aug, y/y | 5.2% | 4.8% | 4.5% | Beat |
| China retail sales, Aug, y/y | 0.4% | 0.8% | 0.6% | Miss; slowest since May |
| UK unemployment, 3m to Jul | 4.9% | 5.0% | 4.9% | Better; payrolled employees −101k y/y, vacancies ~702k (four-year low), private payrolls −34k in Aug |
| UK regular earnings, 3m to Jul, y/y | 3.5% | — | 3.5% | In line; total earnings slowed to 3.9% |
| Germany ZEW expectations, Sep | 34.7 | 37.0 | 34.2 | Miss; small rise |
| Euro area ZEW expectations, Sep | 25.8 | — | 31.4 | Fall |
| BofA card spending, Aug, y/y | +4.5% | — | — | +3.7% ex-gasoline |
The Empire State survey is the day's US data and it is stagflationary in miniature: activity fell 13 points to 7.6, well under the 14.1 expected, while both price indices rose 5 points, prices paid to 63.1. It lands the day before the FOMC and the day before August retail sales, and the Bank of America card figure (+4.5% headline, +3.7% ex-gasoline) says the consumer is still spending in nominal terms with a widening share of it going on fuel. China's release is a two-speed economy in one table: output up 5.2%, the strongest since spring, and retail sales up 0.4%, the weakest since May. The UK labour data was better at the headline (4.9% against 5.0%) and worse underneath, with vacancies at a four-year low and payrolled employment down 101k on the year, which is the Bank of England's argument for holding on Thursday while the gilt market prices four hikes.
Fixed Income & Bond Analysis
US Treasury yields in the tables and commentary below are the settled US Treasury par and real curves for 15 September.
Policy Rates
| Central Bank | Rate | Source |
|---|---|---|
| Fed Funds (upper) | 3.75% | FRED DFEDTARU (2026-09-15) |
| Fed Funds (lower) | 3.50% | FRED DFEDTARL (2026-09-15) |
| Effective FFR | 3.63% | FRED DFF (2026-09-11) |
| ECB Deposit Rate | 2.25% | FRED ECBDFR (2026-09-15); 2.50% set 10 Sep, see note |
| BOJ Policy Rate | 1.00% | web search (Japan Times, 12 Sep); hike to 1.25% expected 18 Sep |
| BOE Bank Rate | ~3.73% (SONIA/FRED) | FRED IUDSOIA (2026-09-11); Bank Rate 3.75% |
The FOMC's two-day meeting began today, with a 25 bp hike to 3.75% to 4.00% priced at 90% to 93% on futures, up from 85% to 88% on Monday, and Chair Kevin Warsh's press conference at 14:30 ET tomorrow. The settled 3-month bill was unchanged at 4.11% on 15 September, 48.5 bp above the 3.625% target midpoint and outside the usual 25 bp band for a fifth session on the settled curve: the bill market has the hike in and is pricing the probability of a second. The Bank of England decides Thursday with Bank Rate at 3.75%, a hold expected, Governor Bailey having pushed back on imminent hikes while the gilt curve prices four by mid-2027. The BOJ decides Friday with a rise to 1.25% expected, the highest since April 1995. The ECB's 2.50% deposit rate was set on 10 September; FRED's daily series carries the rate in force, which is why it still prints 2.25%, and the AAA 2-year's 10 bp jump to 3.23% on the 14 September curve says the market has moved on to October.
Government Bond Yields
| Country | 2Y Yield | 10Y Yield | 30Y Yield | Day Chg (10Y) | Source |
|---|---|---|---|---|---|
| USA | 4.67% | 5.00% | 5.36% | +3 bp | US Treasury par curve (2026-09-15), vs 2026-09-14 |
| Germany | 3.23% | 3.54% | 3.79% | +2 bp | ECB AAA curve (2026-09-14), vs 2026-09-11; Bund quotes 3.25% / 3.54% / 3.89% (Trading Economics, 15 Sep intraday) |
| France | — | 4.50% | — | 0 bp | web (Trading Economics, 15 Sep intraday) |
| UK | 4.76% | 5.38% | ~5.93% | 0 bp | web (Trading Economics, 15 Sep intraday; 30Y per press, near 6%) |
| Japan | — | 3.04% | — | +5 bp | web (Trading Economics, 15 Sep) |
| Italy | — | 4.41% | — | +2 bp | web (Trading Economics, 15 Sep intraday) |
The USA row is the settled US Treasury par curve for 15 September, with the day change against 14 September (10-year 4.97%). The 10-year settled at 5.00%, +3 bp, its highest settlement since 2007 after a 5.04% session high; the 30-year rose 2 bp to 5.36%, the 20-year 3 bp to 5.40%, the 7-year 3 bp to 4.91%, the 5-year 3 bp to 4.83%, the 3-year 3 bp to 4.76%, the 2-year 2 bp to 4.67% and the 1-year 2 bp to 4.39%, while the 6-month slipped 1 bp to 4.17% and the 3-month was unchanged at 4.11%: a near-parallel 2 to 3 bp rise from one year out, with the bills pinned by the meeting. The German row is the ECB AAA composite for 14 September, published today, against the 11 September curve (10-year 3.52%): the 3-month was flat at 2.52%, the 1-year rose 7 bp to 3.03%, the 2-year 10 bp to 3.23%, the 5-year 6 bp to 3.30%, the 10-year 2 bp to 3.54%, while the 20-year fell 1 bp to 3.84% and the 30-year 1 bp to 3.79%. A 10 bp day at 2 years against 2 bp at 10 is the largest single-day bear flattening of the post-ECB repricing, and it puts the composite 2-year 50 bp above where it was a month ago. Today's Bund quotes (3.25% / 3.54% / 3.89%) sit a little above the composite at 2 years and 30 years because the composite blends other AAA issuers. The French 10-year at 4.50%, flat, stays at its highest since 2008 while the Bund rose, so the OAT-Bund spread narrowed to 96 bp from 99 bp; Italy at 4.41% yields 9 bp less than France. The gilt 10-year at 5.38% touched 5.41% during the session, its highest since August 2007, and the 30-year is quoted near 6% (5.93% per the London press), a 1998 level, on the day the labour data gave the Bank of England its reason to hold. The JGB 10-year at 3.04%, +5 bp, is above 3% for the first time since September 1996.
Yield Curve Spreads: - 10Y-2Y spread: +33 bp (US Treasury par curve, 15 September), 1 bp steeper on the day and 20 bp flatter than a month ago (53 bp on the 17 August curve). Normal, not steep: a positive slope, with the 2-year up 48 bp in a month against 28 bp at 10 years, the shape of a market pricing the hikes rather than the growth. - 10Y-3M spread: +89 bp (same source and date), 3 bp steeper on the day and 4 bp above a month ago (85 bp on the 17 August curve). Comfortably positive; the bill has the hike ahead of it and the 10-year has the oil.
OAT-Bund Spread: 96 bp (10-year OAT 4.50% against the 10-year Bund at 3.54%, both Trading Economics intraday 15 September), narrower than Monday's 99 bp because the Bund rose 3 bp while the OAT was flat. It is the second-widest level of the year and the OAT still yields 9 bp more than the BTP, so the narrowing is a Bund move, not a French one.
Yield Curve Charts
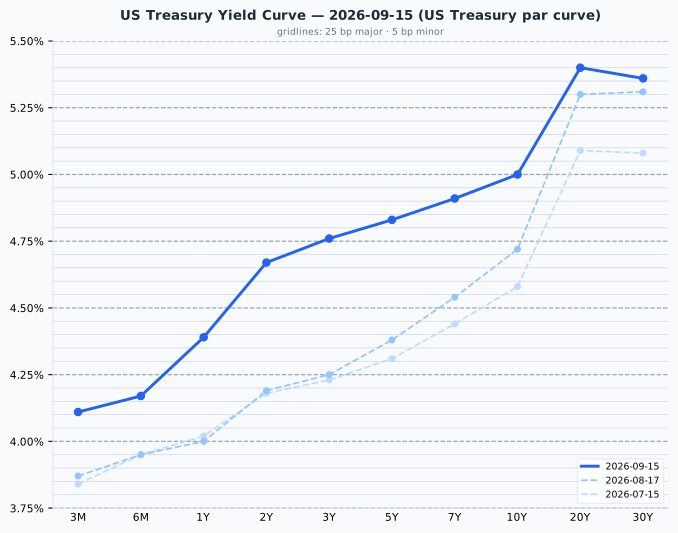
US Treasury par curve, 15 September 2026, against the 17 August and 15 July curves. The curve is upward-sloping throughout with a hump at 20 years (5.40% against 5.36% at 30), 33 bp between 2 and 10 years and 89 bp between 3 months and 10 years. Against the 17 August curve every point is higher: +24 bp at 3 months, +48 bp at 2 years, +51 bp at 3 years, +45 bp at 5 years, +28 bp at 10 years, +10 bp at 20 years and +5 bp at 30 years, a bear flattening concentrated in the 2-to-5-year belly where the Fed's path is priced. The 3-month bill at 4.11% is 48.5 bp above the Fed Funds midpoint, outside the 25 bp sanity band; the explanation is the hike priced for Wednesday rather than a data problem.
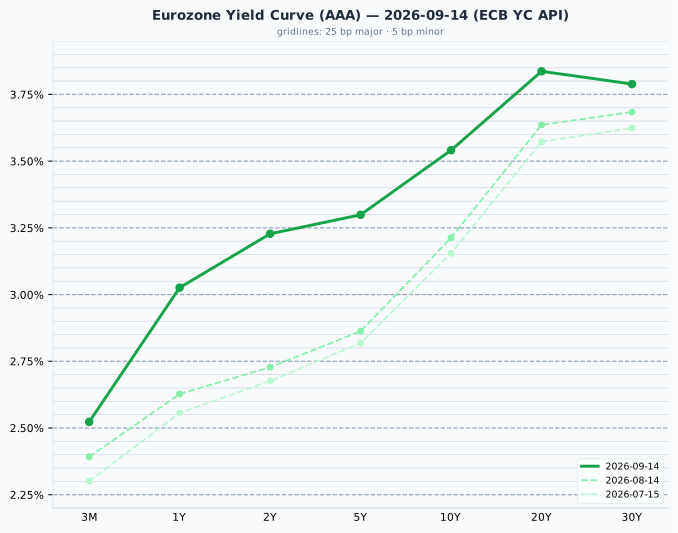
Euro area AAA government curve, 14 September 2026 (ECB YC API), against the 14 August and 15 July curves. The curve rises from 2.52% at 3 months to 3.54% at 10 years and 3.84% at 20, then dips to 3.79% at 30 years, the same 20-year hump as the US curve; the 2-to-10 slope is 31 bp, a basis point off the US figure. Against the 14 August curve every point is higher: +13 bp at 3 months, +40 bp at 1 year, +50 bp at 2 years, +44 bp at 5 years, +33 bp at 10 years, +20 bp at 20 years and +10 bp at 30 years, a bear flattening of the same shape as the US one and centred on the 2-year, which is where the June and September ECB hikes and the pricing of a third have landed.
Credit Markets (from FRED - authoritative)
| Market | OAS Spread | Series ID |
|---|---|---|
| US Investment Grade | 80 bp | BAMLC0A0CM (2026-09-14) |
| US High Yield | 271 bp | BAMLH0A0HYM2 (2026-09-14) |
| Euro High Yield | 269 bp | BAMLHE00EHYIOAS (2026-09-14) |
US high yield at 271 bp is 6 bp wider than Friday's 265 bp and a basis point above Thursday's 270 bp, the first sign that Monday's AI repricing reached the debt of the companies building the data centres; it remains historically tight (under 300 bp against a 300 to 500 bp normal range). Investment grade at 80 bp is unchanged at the bottom of its 80 to 150 bp range, and euro high yield at 269 bp is 1 bp wider. The settled figures do not yet show today's session. The point from last week stands with one amendment: 50 bp of curve repricing in a month had not moved credit by ten, and now an AI headline has moved it by six. That is still a tight market, but the direction has changed.
Real Yields (US and Euro Area)
| Region | Nominal 10Y | Expected inflation | Real 10Y | How the real yield is obtained |
|---|---|---|---|---|
| United States | 5.00% (US Treasury par curve, 15 Sep) | 2.38% (residual: nominal − real) | 2.62% (US Treasury real curve, 15 Sep) | Measured. TIPS trade, so the market quotes a real yield directly; expected inflation is the residual (the breakeven) |
| Euro area | 3.54% (ECB AAA curve, 14 Sep) | 2.04% (ECB SPF long-term HICP expectation, 2026 Q3, measured) | 1.50% (residual: nominal − expected) | Constructed. No euro inflation-linked benchmark is published, so a survey expectation is subtracted from the nominal yield |
The two rows are built in opposite directions. The US real yield is a market price, the only one in the table that anyone trades, and its inflation figure is what is left over; the euro row measures the inflation expectation by survey and infers the real yield, so the 1.50% is the softer number and should be read that way. Two mismatches apply whenever the pair is compared: the US breakeven includes an inflation risk premium that a survey does not carry, and the SPF horizon is five years against the bond's ten. The decomposition of the 146 bp nominal gap between the two 10-years is unchanged in character from Monday: 34 bp is expected inflation (2.38% against 2.04%) and 112 bp is real (2.62% against 1.50%), so three-quarters of the gap is a real-rate story. The euro real yield has risen 39 bp in a month (from 1.11% on 7 August) against 21 bp for the US, which is the June and September ECB hikes showing up where they should.
This gap is not a trade for a euro-based reader. The US real yield has exceeded the euro one in every quarter since 2014; hedging the currency removes the differential by construction, and unhedged it is a dollar position rather than a bond decision. A real yield is real in its own currency: 2.62% is 2.62% above US inflation, which is not a real return for someone who spends euros. State the gap as a description of relative policy stance and growth expectations and draw no portfolio conclusion from it.
Bond Portfolio Implications
The S&P 500 earnings yield gap is −0.91 pp (4.09% less a settled 10-year of 5.00%); the euro gap is +2.19 pp (5.73% less the 3.54% AAA 10-year). In real terms they are +1.47 pp and +4.23 pp respectively; the correction is 2.38 pp for the US and 2.04 pp for the euro area, and it is what the nominal number leaves out, since a bond coupon is fixed for a decade and the earnings behind an equity yield grow with inflation. The gap describes today's trade-off and forecasts nothing: an investor can lock in 5.00% for ten years, or accept equity risk at a 4.09% earnings yield of which only the distributed part is received as cash. For the forward-looking argument, the multiple against its own history is the measure that carries weight, and the S&P 500 is 44% above its long-run midpoint while the STOXX 600 is 9% above.
Duration is the live question this week. At a 10-year of 5% a further 100 bp rise costs roughly 8% to 9% of a 10-year bond's price, and this month's 28 bp move at 10 years and 48 bp at 2 years have already cost the belly of the curve 1% to 2%. The hike tomorrow is priced; what is not is the dot plot, and a committee that signals a path rather than an insurance move would push the 2-year through 4.75% and take the 10-year's 5.04% high with it. The front end offers 4.11% at 3 months and 4.67% at 2 years with far less price risk, which is the same conclusion as last week with a larger number attached: the yield available for taking duration risk has risen, but so has the risk, and the settled 20-year at 5.40% is the highest point on the curve for a reason. For a euro investor the euro AAA 2-year at 3.23% (+50 bp in a month) is only 7 bp under the 5-year (3.30%) and 31 bp under the 10-year: the euro curve is paying almost nothing for extension, and the OAT at 4.50% and BTP at 4.41% are the places where extra yield is on offer, with the French spread the price of it.
Currencies & Commodities
Currencies:
| Pair | Rate | Source |
|---|---|---|
| EUR/USD | 1.1604 | FRED DEXUSEU (2026-09-11) |
| USD Index | 118.21 | FRED DTWEXBGS (2026-09-11) |
| USD/JPY | 155.08 | web search (Trading Economics, 15 Sep intraday, +0.47%) |
| GBP/USD | 1.3477 | web search (Trading Economics, 15 Sep intraday, −0.16%) |
| USD/CHF | 0.8187 | web search (Trading Economics, 15 Sep intraday, +0.16%) |
The FRED dollar series are Friday's, the Board's Monday and Tuesday fixes not yet published; the DXY is reported above 99, a two-week high, and every web-sourced pair moved the dollar's way: USD/JPY +0.47% to 155.08 with the yen sold on oil and bought on the BOJ, GBP/USD −0.16% to 1.3477 (1.3470 in the London morning after the payrolls data), USD/CHF +0.16% to 0.8187 with the franc reported as a funding currency for carry. The dollar is being bought into a Fed hike that is 93% priced; the question for it is whether the dot plot adds a second.
Commodities (all front-month futures):
| Commodity | Price | Day Chg % | Ticker | Source |
|---|---|---|---|---|
| Brent Crude | $108.75 | +2.91% | BZ=F | yfinance (BZX26, Dec) |
| WTI Crude | $105.83 | +4.38% | CL=F | yfinance (CLV26, Oct) |
| Gold ($/oz) | $4,332.80 | −0.44% | GC=F | yfinance (GCZ26, Dec) |
| Silver ($/oz) | $63.86 | −0.44% | SI=F | yfinance (SIZ26, Dec) |
| Copper ($/lb) | $6.4435 | +0.61% | HG=F | yfinance (HGZ26, Dec) |
| Nat Gas ($/MMBtu) | $2.919 | +0.79% | NG=F | yfinance (NGV26, Oct) |
Day changes are settlement (15 September) vs the prior session's settlement (14 September); every row is on the same settlement-to-settlement basis, and no contract roll affects the comparison.
Oil is the day's move and WTI is leading it, settling +4.38% at $105.83 against Brent's +2.91% at $108.75, which narrows the Brent-WTI spread to $2.92 from $4.29 at Monday's settlements; the US grade is catching up with a shortage that is Gulf-sourced because Yanbu's stocks are running down and buyers of physical barrels are paying $128 to $130 in the Dubai, Oman and Dated Brent markets against $106 to $109 in the futures. The backwardation between the physical and the futures is the market saying it expects the pipeline back before the December contract expires; the physical price is what refiners are paying now. WTI's October contract (CLV26) expires on 22 September, a week away, and the generic will roll to November around then; the roll will show as a discontinuity in the quoted level unrelated to any market move. Both crudes are inside their 52-week ranges (WTI $54.98 to $119.48, Brent $58.72 to $126.10), 11% and 14% below the highs; their spliced-series records date from 2008 and are not a useful reference.
Gold settled at $4,332.80, 22.4% below its all-time high of $5,586.20 set on 29 January 2026, and silver at $63.86 is 47.4% below its $121.30 record of the same day. Both settled 0.44% lower on a day when the dollar and real yields were firm and the oil shock was being read as a rate shock; gold is 19% above its 52-week low of $3,635.10. Copper settled at $6.4435, 5.3% below its all-time high of $6.8055 set on 9 September, up 0.61% after two days of losses, with the White House tariff decision still pending. Natural gas at $2.919 (+0.79%) is near the bottom of its 52-week range ($2.483 to $7.827), unmoved by the oil market; its record dates from 2005 and is not a reference.
Crypto: The Senate's cloture vote on the motion to proceed to the CLARITY Act failed at 14:15 ET, 49 votes to 50 against the 60 required, with Senate Democrats holding out for an ethics provision barring officials from profiting from crypto ventures. Bitcoin, already down about 3% near $76,400 before the vote, fell to about $75,750 afterwards, its lowest since 21 August, and Coinbase and Circle shares fell roughly 8% and 10%. Polymarket had priced passage this year at 12% going in; the shrinking 2026 legislative calendar now points the market-structure debate into 2027.
Sector & Theme Highlights
- Energy is the one sector working everywhere. STOXX 600 energy +1.3%, the FTSE 100's oil majors and Brazil's Bovespa (+0.54%) were the day's gainers on a $106 barrel; the Bovespa's rise is the only positive index print in the Americas table.
- Financials are the day's weakest sector on both sides of the Atlantic. European banks −0.9% and financial services −1.9%, UBS −3.4% the worst stock in the STOXX 600, Deutsche Bank, UniCredit and Standard Chartered each down 1% to 2% in early trade; in the US the Dow's 0.63% fall (0.79% at its worst) is the banks extending Monday's Bank of America-led loss. The curve is flattening into a hike and investment banking fees are falling, and both show up in the same names.
- Luxury under pressure. LVMH fell 2.6% and L'Oréal overtook it as France's most valuable listed company, the first time since 2017 a non-luxury name has held the position; the CAC 40 is the only major European index under both moving averages and luxury's China exposure is part of the reason, with Chinese retail sales at 0.4%.
- Oil and rates are one trade. CNBC's calculation that the correlation between oil and 10-year Treasury yields is at its strongest since 2019 describes this week: the barrel moves, the breakeven moves, the yield moves, and equities discount the sum.
- AI pacing, day two. Elon Musk endorsed Amodei's call for a slower frontier, Nvidia's Jensen Huang dismissed the extinction framing as "fiction", and Microsoft released an AI code of conduct; the chip names did not repeat Monday's fall but did not recover either, and the Kospi's fourth straight loss is the concentration of that exposure in one index.
- Two-speed China. Industrial production at 5.2% and retail sales at 0.4% in the same release is the pattern of an economy exporting its way past a domestic-demand problem, and the Hang Seng and Shanghai both closed under their 200-day averages.
Top Stories (Global)
- The 10-year Treasury settled at 5.00%, its highest since 2007, +3 bp on the 15 September par curve after a 5.04% session high, with the 30-year at 5.36% (+2 bp), the 20-year at 5.40% (+3 bp), the 5-year at 4.83% (+3 bp) and the 2-year at 4.67% (+2 bp). The FOMC began its meeting today with a 25 bp hike to 3.75% to 4.00% priced at 90% to 93% and the dot plot the live question for tomorrow at 14:00 ET.
- Oil extended: WTI settled +4.38% at $105.83 and Brent +2.91% at $108.75 with Saudi Arabia's East-West pipeline still offline and physical crude far above the futures, Dated Brent above $130 and Dubai and Oman near $128. The Brent-WTI spread narrowed to under $3 as the US grade caught up.
- Wall Street closed lower for a second day: the S&P 500 fell 0.45% to 7,585.73, back under its 50-day average, the Nasdaq 100 0.65% and the Dow 0.63% (−328 points to 52,093.10), with the banks lower again; the Dow had been down 0.79% at midday and recovered part of it. The Bovespa rose 0.54% on oil.
- Europe closed at a three-month low. The STOXX 600 fell 0.28% to 634.18, its lowest close since 12 June, with banks down 0.9%, financial services down 1.9% and energy up 1.3%; UBS fell 3.4%, LVMH 2.6% (L'Oréal is now France's most valuable listed company) and Puig 2.2% after agreeing to buy ISDIN for €1.2 bn. The CAC 40 fell 0.34%, the DAX 0.15%, the FTSE 100 0.37% and the SMI 0.50%. German ZEW expectations rose to 34.7 (37.0 expected) while the euro-area index fell to 25.8 from 31.4.
- The euro AAA 2-year jumped 10 bp to 3.23% on the 14 September curve, the largest front-end move of the post-ECB repricing, with the 10-year up 2 bp to 3.54% and the 30-year down 1 bp to 3.79%. The 10-year Bund is quoted at 3.54%, a 2009 high; the OAT is flat at 4.50%, narrowing the spread to 96 bp; Italy at 4.41% yields less than France.
- Gilts and JGBs at generational highs into their central bank meetings. The 10-year gilt touched 5.41% (August 2007 high) and the 30-year is near 6% (1998), while UK unemployment held at 4.9% with vacancies at a four-year low and private payrolls −34k, the case for a Bank of England hold on Thursday. The 10-year JGB rose 5 bp to 3.04%, above 3% for the first time since September 1996, with the BOJ expected to hike to 1.25% on Friday.
- China's August data split: industrial production +5.2% y/y (4.8% expected, 4.5% prior) and retail sales +0.4% (0.8% expected, 0.6% prior), the slowest since May. The Hang Seng fell 1.00% to 24,667.24 with the loss widening into the close, Shanghai 0.54%, and the Kospi 0.85% to 6,627.26 for a fourth straight loss after being up 0.5% at midday; the Nikkei closed unchanged after a 0.9% lunchtime gain.
- The Empire State survey fell 13 points to 7.6 against 14.1 expected, with prices paid up 5 points to 63.1 and prices received up 5 to 28.1: weaker activity and faster price rises in the last US data before the FOMC. Bank of America put August card spending at +4.5% y/y, +3.7% ex-gasoline.
- Credit widened. US high yield OAS at 271 bp (FRED, 14 September) is 6 bp wider than Friday and back above Thursday's level, still historically tight; investment grade is unchanged at 80 bp. Bitcoin fell to about $75,750, its lowest since 21 August, after the Senate's cloture vote on the motion to proceed to the CLARITY Act failed 49 votes to 50, short of the 60 needed.
Looking Ahead
Central banks - Wednesday 16 September: FOMC, decision at 14:00 ET, press conference and projections at 14:30. A 25 bp hike to 3.75% to 4.00% is priced at 90% to 93%. The question is the dot plot: a single insurance move against the energy shock, or a path. The committee meets with the 10-year settled at 5.00% after a 5.04% high, WTI at $106, the Empire State survey showing prices paid at 63 and activity at 8, unemployment at 4.1% and payrolls at +162k, and an equity market that has begun to price a slower AI investment cycle. - Thursday 17 September: Bank of England, decision at 12:00 BST, Bank Rate 3.75%, a hold expected after today's labour data; the gilt market prices four hikes by mid-2027 and the 30-year is at 6%. UK CPI for August (prior 2.6%) lands the day before. - Thursday 17 to Friday 18 September: BOJ, statement Friday after the Asian open, press conference at 06:30 GMT. A hike from 1.00% to 1.25% is expected, the highest since April 1995; the 10-year JGB at 3.04% and USD/JPY at 155 frame the decision. Tokyo is closed the following Monday. - ECB: no meeting until October; the AAA 2-year's 10 bp jump to 3.23% says the market has priced one.
Economic releases - Wednesday 16 September: UK CPI for August (prior 2.6%); US retail sales for August at 08:30 ET (prior −0.6%, consensus about +0.8%) and the retail control group (prior −0.4%), the first hard read on the consumer after the Michigan survey and today's card data; US import prices; euro area final HICP (flash 3.3%); the FOMC. - Thursday 17 September: US initial jobless claims, housing starts and the Philadelphia Fed survey (the Empire State miss sets the bar); the BOE. - Friday 18 September: UK retail sales; the BOJ.
Earnings - No major reports scheduled; the AI pacing story continues to be tested against what the hardware companies say at this week's industry conferences rather than in results.
Geopolitical - The Salalah meeting between Iran and the Gulf states remains postponed with no new date; the East-West pipeline's five-to-six-week repair is the hard constraint on Saudi exports, and Yanbu's stock cover was put at five to seven days on Monday. The physical crude premium over futures ($128 to $130 against $106 to $109) is the market's measure of how tight the next few weeks are. - The CLARITY Act's failed cloture vote (49 to 50) leaves crypto market-structure legislation without a path this year unless the ethics provision Senate Democrats want is negotiated; with the 2026 calendar shrinking, the next test is more likely in 2027. - The White House copper-tariff decision is unresolved; copper is 5.3% below its 9 September record. - WTI's October contract expires on 22 September; the generic will roll to November around then and the quoted level will jump by the spread between them.
Market closures - No closures in the next five trading days (16 to 22 September) across the US, UK, Germany, France, Australia, Switzerland, Canada, Korea or Brazil, with one exception: Japan is closed Monday 21 September (Respect for the Aged Day), the first session after the BOJ decision. - Further out: Japan 23 September (Autumnal Equinox Day); Korea 24 and 25 September (Chuseok); Canada 30 September (National Day for Truth and Reconciliation). - No Indian holiday data is available here, so Indian closures cannot be checked, including whether 14 September was one; see the Nifty footnote.
Special Analysis: The CLARITY Act's Failed Cloture Vote and What Crypto Had Been Pricing
Added 16 September 2026. The Senate's 49 to 50 vote on cloture left the crypto market-structure bill eleven votes short of the 60 it needed, with every Democrat present voting no, and the congressional calendar before the 3 November midterms leaves no realistic way back this year. Bitcoin's fall to $75,613 and the 10% to 11% drops in Coinbase and Circle are the price of a legislative catalyst being removed, not of anything changing in the assets themselves: what the market had been paying for since the spring was a durable legal status written into statute, and what it is left with is regulatory forbearance that the next administration can withdraw.
What the bill was
The Digital Asset Market Clarity Act, H.R. 3633, was the second half of the crypto industry's two-part legislative programme. The first half, the GENIUS Act, became law in July 2025 and covers stablecoin issuers: who may issue a dollar token, what reserves they must hold, and a ban on the issuer paying interest on it. CLARITY was meant to cover everything else. It defines a "digital commodity" as an asset whose value comes from the blockchain it runs on, gives the CFTC exclusive authority over spot trading in such assets, including the exchanges, brokers and dealers that handle them, and leaves the SEC with tokens sold as investment contracts and with the primary-offering rules under which new tokens are issued. Exchanges would register with one regulator under one rulebook. Developers of non-custodial software would be excluded from broker registration. The Senate text also carried the compromise on stablecoin rewards that the bank lobby had fought for all year: platforms could pay activity-based rewards on stablecoin use but not interest-like returns on idle balances, with the SEC, CFTC and Treasury told to draw that line by joint rulemaking within a year, and the Treasury secretary given an 18-month "circuit breaker" to suspend rewards if they were draining community bank deposits.
For Coinbase the bill was a registration path: a statutory licence to run a spot market that the SEC could not later reclassify as an unregistered securities exchange. For Circle it was the rewards language: the USDC distribution model runs through platforms paying users to hold the coin, and CLARITY was where the permission to keep doing so was being written down. That is why both stocks fell harder than Bitcoin on Tuesday. Their exposure was to the rules, not to the price.
How it got to the floor
The House passed the bill on 17 July 2025 by 294 votes to 134, with 78 Democrats in favour. The Senate then split it between two committees. The Agriculture Committee, which oversees the CFTC, reported its title on 29 January 2026 by 12 votes to 11 on party lines, with the Democrats already citing ethics provisions, consumer protection and CFTC independence. The Banking Committee reported the SEC title on 14 May by 15 votes to 9, with two Democrats, Ruben Gallego and Angela Alsobrooks, joining every Republican. Polymarket had priced passage in 2026 at 82% in February and above 75% in May. The August target for a floor vote was missed over the ethics language, and by early September the market put the odds near 22%.
The final push came on Sunday 13 September, when Senators Lummis, Boozman and Scott released a 630-page revised text incorporating what they described as 126 substantive changes requested by Democrats, including an ethics provision the White House had accepted. The odds rose to about 32% on the release and Coinbase rose 9.2% on Monday to $191.45, Circle 7.5% to $97.42. By Tuesday morning, after Democratic senators had read the text, the odds were back at 12% to 18%, and the vote itself was lost in the early afternoon.
Why it failed
The ethics provision was the whole fight. Democrats wanted an enforceable ban on the president, senior officials and members of Congress profiting from digital assets while writing the rules for them, a demand that acquired a number in July, when the president's annual disclosure showed more than $1.4bn of 2025 income from crypto ventures: nearly $800m connected to World Liberty Financial, the company co-founded with his sons, and $635m from sales of the Trump memecoin. The Sunday text barred officials and their spouses from issuing or sponsoring digital assets and gave state attorneys general a role in enforcement, the Tillis-Gallego formula. Democrats objected that the Justice Department remained the primary enforcer, that the provision did not reach children or other family members, and that its sunset meant a future administration could not prosecute conduct under it. Senator Warren called it "a weak fig leaf that will do nothing to stop him from making his next $1.4 billion in crypto profits"; Senator Slotkin wrote that the ethics provisions were "simply too thin" and raised money-laundering safeguards and CFTC staffing alongside them. Senator Alsobrooks, who had voted the bill out of committee in May, said Democrats had been "ready to strike a deal" when leadership shut the talks down; Senator Gallego, the other committee yes, said the bill "failed squarely because Republicans refuse to say no to the president"; Senator Gillibrand, a co-author, had urged colleagues on Monday to support it and voted no herself on Tuesday.
The arithmetic is the summary. Republicans hold 53 seats and needed seven Democrats. Four Republicans voted no: Susan Collins, Josh Hawley, Jerry Moran and Thom Tillis, the last procedurally so that he could file a motion to reconsider. Chris Coons did not vote. That leaves 49 Republican yeas and 50 noes, of which 46 were every Democrat who was in the chamber. A bill that had 78 House Democrats in July 2025 and two Senate Democrats in committee in May 2026 had none on the floor in September. The motion to reconsider keeps a second cloture vote technically possible, but the House has cancelled its late-September voting weeks, and an amended Senate text would have to go back to the House in any case.
What the market had been pricing
Bitcoin closed at $62,819 on 16 August. It crossed $70,000 on 20 August for the first time since June, with about $1bn of shorts liquidated, reached $79,464 intraday on 21 August, and closed at $81,272 on 3 September after an intraday high of $82,262, a rise of 29% in eighteen days. The Polymarket odds on CLARITY were not the only thing in that move, but they moved with it, and the two came apart together: from the 3 September high the price drifted to $76,568 by 10 September as the odds fell, recovered to $78,163 on Monday with the revised text, and closed Tuesday at $75,613, down 3.3% on the day with an intraday low of $74,945, the lowest close since 20 August and the lowest print since 21 August. About $570m to $770m of leveraged positions were liquidated over the 24 hours, roughly nine-tenths of them longs, with $289m in the hour of the vote.
| Asset | Fri 11 Sep | Mon 14 Sep | Tue 15 Sep | Monday | Tuesday | Tue vs Fri |
|---|---|---|---|---|---|---|
| Bitcoin (close, UTC) | $77,174 | $78,163 | $75,613 | +1.3% | −3.3% | −2.0% |
| Coinbase (COIN) | $175.26 | $191.45 | $172.11 | +9.2% | −10.1% | −1.8% |
| Circle (CRCL) | $90.60 | $97.42 | $86.30 | +7.5% | −11.4% | −4.7% |
The table makes the point about the two stocks. Monday's gain on the revised text and Tuesday's loss on the vote were a round trip that ended below Friday's close, on volume of 18.7m shares in Coinbase and 22.8m in Circle, both the heaviest of the week. The briefing's intraday figures of roughly 8% and 10% were taken before the last hour; the closes were worse. Bitcoin, by contrast, gave back Monday's gain and two percent more. The difference is the difference between an asset whose price the bill would not have changed and two businesses whose legal footing it would have.
What replaces the law
The industry's fallback is the regulators. The SEC has proposed Regulation Crypto Assets, an exemption that lets projects raise funds and distribute tokens without immediate registration, and the CFTC and SEC have issued joint guidance on where their jurisdictions meet. The SEC's own enforcement cases against the exchanges were dropped in early 2025. All of that is in place today and none of it is affected by Tuesday's vote. The point the market has priced is the one the SEC chairman made himself: rules and exemptions adopted by an agency "won't be durable without a law underpinning them". Every piece of the current regime is a discretionary choice by this administration's appointees, reversible by the next administration's, and litigable in the meantime by anyone with standing. What CLARITY offered was the removal of that reversibility, and its value to Coinbase and Circle was the difference between a licence and a forbearance.
The calendar is the other half. H.R. 3633 dies with the 119th Congress on 3 January 2027, so the House vote of July 2025 is lost and the process restarts in the new Congress, whose composition the November election decides. The Fairshake political action committee, the industry's main vehicle, has not said whether it will campaign against the senators who voted no. The White House crypto adviser called the result "a major disappointment" and warned that standards would be set in Brussels or Beijing instead; the Cardano Foundation's chief executive made the same point from the other side, that the EU is now "the clearest jurisdiction". Both are right about the mechanism, which is that a rulebook a firm can rely on is worth more than a friendlier one it cannot.
What it means for this briefing's readers
None of the indices or ETFs in the tables above hold Bitcoin, Coinbase or Circle in a size that moves them, and the S&P 500's 0.45% loss on Tuesday belongs to oil and the 10-year, not to the Senate. The read-through is narrower and worth stating. First, the day showed a market that was already selling risk on the 5% 10-year and a Fed hike; it did not need the vote to fall, and the vote gave it one more reason. Second, the stablecoin rewards question goes back to where the GENIUS Act left it: issuers may not pay interest, platforms are not addressed, and the compromise that would have written platform rewards into law with limits is gone. Platforms keep paying rewards for now, without statutory permission and without the circuit breaker, and the banks' campaign to stop them moves to the GENIUS Act's implementing rules. Third, and for the crypto-adjacent names in the fintech and payments space, the vote establishes that the legal certainty premium those stocks carried through the summer was contingent on a single cloture vote, and it has now been marked to market.