2026 11 03
Global Financial Briefing — Tuesday, 3 November 2026
Figures reflect the 3 Nov close wherever close data exists. FX quotes and the French, UK, Japanese and Italian bond yields are evening quotes; other figures are dated inline. The US Treasury curve and the euro AAA curve are the 3 Nov closes. Tokyo was closed for Culture Day.
Market Overview
Americans voted in the midterm elections today, and US shares ended split. The Nasdaq 100 rose 0.68% and the S&P 500 0.36%, ending a three-session fall that began on 29 October, while the Dow lost 0.38% (Yahoo Finance). Chip makers recovered part of their recent losses: AMD rose 3.65% ahead of its results after the close, Broadcom 3.07%, Micron 2.58% and Nvidia 2.29% (Yahoo Finance). Apple fell 1.90% after forecasting a weaker gross margin for the holiday quarter as memory chip costs rise, and Palantir fell 1.65% as the value of its new US contracts grew only 11% (Yahoo Finance; Stock Titan). After the close AMD reported third-quarter revenue of $13.4 billion, up 45% and above the $13.09 billion analysts expected, and forecast about $17 billion for the fourth quarter; its shares rose about 8% in after-hours trading (AMD; CNBC). The Nasdaq 100 had closed Monday more than 10% below its 6 October record, the usual definition of a correction (Stock Titan), and closed today 9.75% below its record close of 31,224.47, so no longer in a correction. Overnight the Democrats won control of both the House and the Senate, with the Associated Press calling the House for them early on Wednesday (CNN; CBS News; Forbes). Before the vote analysts had told CNBC that shares were not priced for the party winning both chambers (Stock Titan, citing CNBC).
Bond yields rose on both sides of the Atlantic. The 10-year Treasury yield settled at 4.95%, up 4 bp on the day, and the 30-year at 5.32%, also up 4 bp (US Treasury par curve, 3 Nov). The rise came on a day of firm US data: job openings rose to 7.52 million in September against 7.10 million expected, the share of workers quitting their jobs rose to 2.1%, a sign they are confident of finding another, and layoffs fell to their lowest since March 2025; factory orders rose 1.8% against 1.2% expected (Trading Economics). A tighter labour market makes the December Fed rise that futures priced at about 85% after the Fed's 28 October meeting (CME FedWatch via Axios, as cited in the 28 Oct briefing) harder to avoid. In Europe the 10-year gilt yield rose about 7 bp to 5.26% two days before the Bank of England's decision, and the 10-year Bund about 4 bp to 3.33% (Trading Economics). Australia's central bank raised its cash rate 25 bp to 4.85%, its highest since late 2008, by a 6-3 vote, and Swiss inflation rose to 1.5% in October from 1.0%, above the 1.3% expected (Trading Economics).
European shares fell. The FTSE 100 lost 1.14% to a three-week low as gold, silver and copper fell and dragged miners down, and the STOXX 600 lost 0.58%, the DAX 0.45% and the CAC 40 0.34% (Yahoo Finance; Trading Economics). Oil swung on reports of limited US strikes on Iran's Qeshm Island: the January Brent contract (BZF27) traded about 1.75% higher at $106.60 early in the US morning, then lower after an Iranian official said the two sides remained far from a deal (WSJ and Reuters, via Stock Titan), and settled at $103.60, 1.12% below Monday's settlement. In Asia, Korea's Kospi fell 3.59%, more than undoing Monday's 2.24% rise, as Samsung Electronics fell 4.59% and SK hynix 5.57% on renewed worries over the cost of AI investment after Monday's Nasdaq fall (Trading Economics).
Global Indices Snapshot
Americas
| Index | Level | Day Chg | Day Chg % | Source |
|---|---|---|---|---|
| S&P 500 | 7,568.92 | +27.52 | +0.36% | yfinance ^GSPC |
| Nasdaq 100 | 28,180.26 | +190.44 | +0.68% | yfinance ^NDX |
| Dow Jones | 51,786.72 | −197.26 | −0.38% | yfinance ^DJI |
| Brazil IBOV | 165,528.92 | −2,392.88 | −1.42% | yfinance ^BVSP |
Americas data reflects the 3 Nov close. Brazil was closed on 2 November for All Souls' Day, so the IBOV change is against the 30 October close.
The S&P 500 is 1.63% below its 50-day average, 3.50% above its 200-day and 3.51% below its 52-week high of 7,844.52. The Nasdaq 100 is 5.34% below its 50-day average and 0.86% above its 200-day. The Dow's fall came with Apple's: Apple is a Dow member, and Stock Titan's closing report named it as the weight on the index. The Dow is 0.76% below its 50-day average. Brazil's IBOV is 12.00% below its 50-day average.
Europe
| Index | Level | Day Chg | Day Chg % | Source |
|---|---|---|---|---|
| Euro STOXX 600 | 645.66 | −3.78 | −0.58% | yfinance ^STOXX |
| CAC 40 | 8,020.31 | −27.38 | −0.34% | yfinance ^FCHI |
| DAX | 25,864.62 | −116.47 | −0.45% | yfinance ^GDAXI |
| FTSE 100 | 10,638.43 | −122.90 | −1.14% | yfinance ^FTSE |
| SMI (Swiss) | 14,743.09 | −59.43 | −0.40% | yfinance ^SSMI |
European data reflects the 3 Nov 2026 close.
In Paris, Stellantis fell 2.99%, Dassault Systèmes 2.69% and ArcelorMittal 2.41%, with Airbus down about 1.4%, Safran 1.1% and TotalEnergies 1.1%; LVMH rose 1.99% and Orange 1.23% (Trading Economics). France's public finances remain under scrutiny: on Friday 30 October Fitch moved its outlook on France's A+ rating to negative, meaning a downgrade is now more likely than an upgrade, citing weaker growth, higher borrowing costs and political fragmentation (The Local; Bloomberg), and the state's deficit for January to September reached €159.2 billion, against €155.4 billion a year earlier (Trading Economics). The National Assembly's vote on the revenue part of the 2027 budget, planned for today, has been postponed, with 758 amendments still to examine and a deadline of midnight on 17 November for the first reading (Cointelegraph). The CAC 40 is 0.35% below its 50-day average, 2.23% below its 200-day and 8.39% below its 52-week high. In Frankfurt, Zalando fell 5.97% as weak profitability outweighed its sales and Fresenius Medical Care 4.17% after cutting its full-year outlook, while Bayer rose 4.80% after raising its 2026 profit outlook (Trading Economics); the DAX is 1.13% above its 50-day average and 2.83% below its 52-week high. In London the miners fell most, Endeavour by 4.15%, Antofagasta by 3.50% and Glencore by about 2.8%, with BP down about 2% and Shell about 1.5% (Trading Economics); the FTSE 100 is 0.60% below its 50-day average. The Swiss SMI fell 0.40% on a day Swiss inflation came in above forecasts.
Asia-Pacific
| Index | Level | Day Chg | Day Chg % | Source |
|---|---|---|---|---|
| Nikkei 225 | 63,081.86 † | — | — | yfinance ^N225 |
| Hang Seng | 23,525.97 | +132.65 | +0.57% | yfinance ^HSI |
| Shanghai Comp | 3,608.10 | −29.93 | −0.82% | yfinance 000001.SS |
| ASX 200 | 8,886.80 | +30.30 | +0.34% | yfinance ^AXJO |
| Kospi (Korea) | 5,648.79 | −210.29 | −3.59% | yfinance ^KS11 |
Asia-Pacific data reflects the 3 Nov 2026 close.
† Nikkei 225: 3 Nov 2026 is Culture Day (Japan), market closed; the level is the 2 Nov 2026 close.
In Seoul, Samsung Electronics fell 4.59%, SK hynix 5.57%, Hyundai Motor 4.18% and LG Energy Solution 2.60%; Korean inflation eased to 2.8% in October from 2.9%, which kept a Bank of Korea rate rise at its November meeting in view (Trading Economics). The Kospi is 13.03% below its 50-day average. The Shanghai Composite fell 0.82% to 0.95% above its 52-week low of 3,574.27, even as the Financial Times reported that China's securities regulator had told banks to pause share listings and to stop large share sales by existing shareholders until markets recover; the CSI 300 index of large mainland shares fell 8.5% in October (Reuters, citing the FT). Australia's ASX 200 rose 0.34% on the day the Reserve Bank of Australia raised its rate, and Hong Kong's Hang Seng 0.57%.
Emerging Markets
| Index | Level | Day Chg % | Source |
|---|---|---|---|
| MSCI EM (EEM) | 61.10 | −0.02% | yfinance EEM |
| India Nifty 50 | 23,810.85 | +1.58% | yfinance ^NSEI |
| South Africa | 62.98 | +0.08% | yfinance EZA |
MSCI EM (EEM) and South Africa reflect the 3 Nov New York close.
EEM trades in New York after Asia has closed, so its flat close is New York's valuation of emerging markets, not what those markets did: the local closes were mixed, with Korea down 3.59% and Shanghai 0.82%, against Hong Kong up 0.57% and India 1.58%. The difference reflects US chip shares recovering in New York today while Korea's fell in Seoul; Asia's session tomorrow will show which view holds. With the euro up 0.08% against the dollar, the fund was about 0.1% lower for a euro investor. EEM is 7.42% below its 50-day average. India's Nifty is 2.45% above its 50-day average, and South Africa's fund rose 0.08% despite a 0.74% fall in gold.
Index Valuations & Investment Risk
Valuation Table
| Index | Trailing P/E (live) | 50-day avg | 100-day avg | 200-day avg |
|---|---|---|---|---|
| S&P 500 | 23.9x | 24.8x | 25.7x | — |
| Nasdaq 100 | 26.2x | 29.2x | 30.4x | — |
| Euro STOXX 600 | 17.9x | 17.7x | 18.0x | — |
| CAC 40 | 16.9x | 16.6x | 17.1x | — |
| DAX | 18.3x | 18.2x | 18.4x | — |
| FTSE 100 | 16.5x | 16.4x | 17.1x | — |
| Nikkei 225 | 16.5x | 20.1x | 21.4x | — |
| MSCI EM | 13.1x | 14.5x | 15.9x | — |
Averages of the daily trailing P/E readings recorded since 1 May 2026 (n = 124; 120 for the Nikkei proxy); shown for reference only. Trailing P/E is Yahoo Finance's trailing P/E for the ETF proxies SPY, QQQ, EXSA.DE, CAC.PA, EXS1.DE, ISF.L, 1321.T and EEM, priced at the 3 Nov close; the Nikkei proxy is priced at the 2 Nov close.
Investment Risk Assessment for ETF Investors
United States (S&P 500 / Nasdaq ETFs)
The S&P 500's trailing P/E of 23.9x gives an earnings yield of 4.18% (1÷23.95). Against the settled 10-year Treasury yield of 4.95% (US Treasury par curve, 3 Nov) the earnings yield gap is −0.77 pp: a 10-year government bond pays more income than the index's earnings come to per dollar invested. Against the real 10-year yield of 2.65% (US Treasury real curve, 3 Nov) the gap is +1.53 pp; the 2.30 pp difference is the correction for company earnings growing with inflation while a bond coupon is fixed. Only the part of earnings paid out as dividends and buybacks reaches a holder as cash. The Nasdaq 100 at 26.2x has an earnings yield of 3.81%, 1.14 pp below the 10-year Treasury. The S&P 500 is 1.63% below its 50-day average and 3.51% below its 52-week high. The midterm elections and AMD's results have now passed: the Democrats won both houses of Congress, an outcome analysts had said shares were not priced for, and AMD beat forecasts after the close. Friday's October jobs report is still to come, after Thursday's Bank of England decision, with 55,000 jobs expected (Stock Titan, as cited in the 2 Nov briefing). Today's job openings data and the 4 bp rise in the 10-year yield to 4.95% add to the case for the December Fed rise.
Europe (STOXX 600 / CAC 40 / DAX ETFs)
The STOXX 600 at 17.9x gives an earnings yield of 5.60% (1÷17.85); against the euro AAA 10-year yield of 3.35% (ECB YC API, 3 Nov) the euro earnings yield gap is +2.25 pp. Against the euro-area real 10-year yield of 1.33% (see Real Yields below) it is +4.27 pp. The S&P 500 trades at a 34.1% P/E premium to the STOXX 600 (23.9x against 17.9x). Part of the difference between the US and euro gaps reflects different inflation and policy paths rather than different compensation for risk, which is why the real-yield versions are shown alongside.
France remains the region's main risk. The CAC 40 at 16.9x has an earnings yield of 5.92% (1÷16.89), 0.98 pp above the French 10-year yield of 4.94%; the DAX at 18.3x yields 5.46%, 2.11 pp over the euro AAA 10-year yield, and the FTSE 100 at 16.5x yields 6.07%, 0.81 pp above the 10-year gilt at 5.26%. Fitch's negative outlook, the postponed budget vote and a wider deficit leave French 10-year bonds paying 160 bp more than German ones, and S&P Global reviews France's rating on 27 November (The Local). A euro investor in euro-quoted funds has no exchange-rate effect on the quoted value, but the constituents earn much of their profit abroad, so their earnings in euros still move with the currency.
Japan (Nikkei / TOPIX ETFs)
Tokyo was closed today. The Nikkei proxy's P/E is 16.5x (earnings yield 6.06%), 3.29 pp above the 10-year Japanese government bond at 2.77% (Trading Economics, 2 Nov close). The Bank of Japan held its rate at 1.25% on 30 October, with one member voting for a rise (Trading Economics). The yen weakened 0.40% against the dollar to 158.49 and about 0.5% against the euro, so a euro investor in an unhedged Japan fund lost about half a percent today from the currency alone with the market shut. Tokyo reopens tomorrow after Seoul's chip makers fell about 5%, and the Nikkei's recent moves have turned on a handful of chip and AI-related companies.
Emerging Markets (MSCI EM ETFs)
EEM trades at 13.1x, the cheapest index in the table and a 45.3% discount to the S&P 500. Its large weights in Korean and Taiwanese chip makers drive it in both directions: today Samsung Electronics and SK hynix fell about 5% in Seoul while chip shares rose in New York, and EEM closed flat. A December Fed rise would tend to draw money out of emerging markets and raise the cost of their dollar debts, whatever the investor's home currency. For a euro investor, the currency conversion largely offsets a stronger dollar, because the euro usually falls against the dollar too; the economic effects of a stronger dollar on these companies (dearer dollar debt, money leaving their markets) are not offset.
Overall Risk Score: - United States: High valuation risk / low margin of safety. A negative nominal earnings yield gap, a 10-year yield near 5%, a likely December rate rise and a Democratic Congress, an outcome analysts had said shares were not priced for. - Europe: Moderate. Positive earnings yield gaps on both measures and a P/E well below the US; French 10-year yields at 4.94%, 160 bp over Germany, with a negative Fitch outlook and the budget unresolved. - Japan: Moderate. A P/E of 16.5x, with a Bank of Japan that now says its inflation target has been reached. - Emerging Markets: Attractive relative valuation, with returns concentrated in Asian chip makers and sensitive to the dollar and to US rates.
US Economic Indicators (FRED - authoritative)
| Indicator | Current | Prior | Delta | Reference Date | FRED Series |
|---|---|---|---|---|---|
| CPI YoY % | 3.72% | 3.35% | +0.36 pp | Sep 2026 (prior Aug) | CPIAUCSL |
| Core CPI YoY % | 2.57% | 2.45% | +0.12 pp | Sep 2026 (prior Aug) | CPILFESL |
| Unemployment Rate | 4.2% | 4.1% | +0.10 pp | Sep 2026 (prior Aug) | UNRATE |
| Nonfarm Payrolls | +29k | +133k | −104k | Sep 2026 (prior Aug), monthly chg | PAYEMS |
| 10Y TIPS Real Yield | 2.65% | 2.62% | +3 bp | 3 Nov 2026 (prior 2 Nov) | DFII10 (US Treasury real curve) |
October's payroll and unemployment figures are due on Friday 6 November.
Other economic releases today (web search)
| Release | Actual | Consensus | Prior | Note |
|---|---|---|---|---|
| US JOLTS job openings, Sep | 7.523m | 7.10m | 7.19m (revised from 7.079m) | above; quits rate 2.1% from 1.9%, layoffs 1.641m lowest since March 2025 (Trading Economics) |
| US factory orders, Sep, m/m | +1.8% | +1.2% | +0.3% (revised) | above; transport +4.6%, civil aircraft +28.3%, ex-transport +1.3% (Trading Economics) |
| Swiss CPI, Oct, y/y | 1.5% | 1.3% | 1.0% | above; highest since December 2023, m/m +0.2% (Trading Economics) |
| RBA cash rate decision | 4.85% | 4.85% | 4.60% | in line; 6-3 vote, highest since late 2008 (Trading Economics) |
| South Korea CPI, Oct, y/y | 2.8% | — | 2.9% | (Trading Economics) |
Job openings rose by about 333,000 in September to a four-month high, and the August figure was revised up to 7.19 million. More telling for wages, 3.37 million people quit their jobs, up from 3.04 million, which took the quits rate to 2.1%, its highest in over a year, while layoffs fell to 1.64 million (Trading Economics). These figures are for September, the month in which payrolls grew by only 29,000 (FRED PAYEMS), so they suggest employers were slow to hire rather than shedding staff. Factory orders were lifted by civil aircraft, up 28.3%, a category that swings with a few large orders; excluding transport equipment orders still rose 1.3% (Trading Economics). In Australia, the central bank expects inflation to stay above 3% over the coming year and to return to its 2–3% target only in late 2027, and three of its nine members voted to hold (Trading Economics).
Fixed Income & Bond Analysis
Policy Rates
| Central Bank | Rate | Source |
|---|---|---|
| Fed Funds (upper) | 4.00% | FRED DFEDTARU (3 Nov 2026) |
| Fed Funds (lower) | 3.75% | FRED DFEDTARL (3 Nov 2026) |
| Effective FFR | 3.88% | FRED DFF (2 Nov 2026) |
| ECB Deposit Rate | 2.50% | FRED ECBDFR (3 Nov 2026) |
| BOJ Policy Rate | 1.25% | web search (Trading Economics: held 30 Oct 2026, 8-1 vote) |
| BOE Bank Rate | ~3.74% (SONIA) | FRED IUDSOIA (2 Nov 2026) |
The Bank of England and Norway's Norges Bank decide on Thursday 5 November (Saxo), with a Bank of England rise widely expected (Trading Economics, as cited in the 2 Nov briefing). The Reserve Bank of Australia raised its cash rate to 4.85% from 4.60% today.
Government Bond Yields
| Country | 2Y Yield | 10Y Yield | 30Y Yield | Day Chg (10Y) | Source |
|---|---|---|---|---|---|
| USA | 4.61% | 4.95% | 5.32% | +4 bp | US Treasury par curve (3 Nov 2026) |
| Germany | 2.99% | 3.35% | 3.62% | +2 bp | ECB YC API (3 Nov 2026) |
| France | — | 4.94% | — | +4 bp | web (Trading Economics, 3 Nov 2026 intraday) |
| UK | 4.87% | 5.26% | 5.69% | +7 bp | web (Trading Economics, 3 Nov 2026 intraday) |
| Japan | — | 2.77% | — | 0 bp | web (Trading Economics, 2 Nov 2026 close) |
| Italy | — | 4.47% | — | +5 bp | web (Trading Economics, 3 Nov 2026 intraday) |
The USA row is the settled 3 Nov 2026 curve, with its day change against the 2 Nov 2026 curve from the same feed. The Germany row is the ECB's fitted AAA euro-area curve for 3 Nov 2026, with its day change against the 2 Nov curve; the on-the-run 10-year Bund was quoted at 3.33%, up about 4 bp (Trading Economics). The other rows are 3 Nov quotes, with day changes as Trading Economics reports them, rounded; Japan is the 2 Nov close, Tokyo being closed today. French, Italian and Japanese 2- and 30-year yields were not retrieved.
Yield Curve Spreads (US Treasury par curve, 3 Nov 2026): - 10Y-2Y spread: +34 bp, positive, 9 bp outside the ±25 bp flat band and under the 75 bp steep threshold, +2 bp on the day. - 10Y-3M spread: +74 bp, positive, no recession signal, +4 bp on the day.
OAT-Bund Spread: 160 bp (10-year OAT 4.94% against Bund 3.33%, Trading Economics, 3 Nov 2026 intraday), against 161 bp on Monday's quotes.
European yields rose from near two-month lows, following Treasuries. Gilts moved most: the 10-year rose about 7 bp to 5.26%, the 2-year about 7 bp to 4.87% and the 30-year about 6 bp to 5.69%, as investors positioned for Thursday's Bank of England decision (Trading Economics). German yields rose about 2 bp at two years, 3 bp at five and 4 bp at ten and thirty years, and remarks from ECB officials favouring higher rates kept a December ECB rise in view (Trading Economics). French and Italian 10-year yields rose with them, by about 4 bp to 4.94% and 5 bp to 4.47%, so the gap over Germany barely changed: 160 bp for France and 113 bp for Italy. Treasuries settled 4 bp higher at ten and thirty years and 2 bp higher at two.
Yield Curve Charts
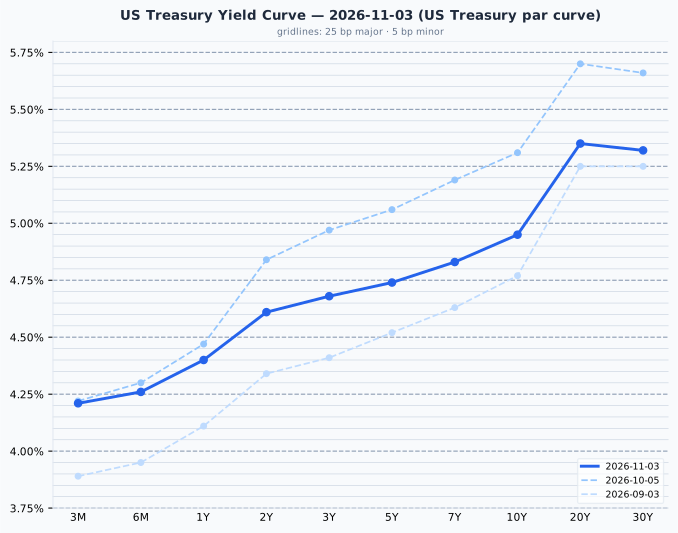
US Treasury par curve, 3 Nov 2026: 3M 4.21%, 6M 4.26%, 1Y 4.40%, 2Y 4.61%, 3Y 4.68%, 5Y 4.74%, 7Y 4.83%, 10Y 4.95%, 20Y 5.35%, 30Y 5.32%; 2-to-10 slope +34 bp. Prior curves: 5 Oct and 3 Sep 2026. The 3-month bill at 4.21% is 33.5 bp above the Fed Funds midpoint of 3.875%.
The US curve rises from 4.21% at three months to 5.35% at 20 years, with the 30-year 3 bp below the 20-year. Against 5 October it is 23 bp lower at two years, 36 bp lower at ten and 34 bp lower at thirty, so the 2-to-10 slope has narrowed from 47 bp to 34 bp.
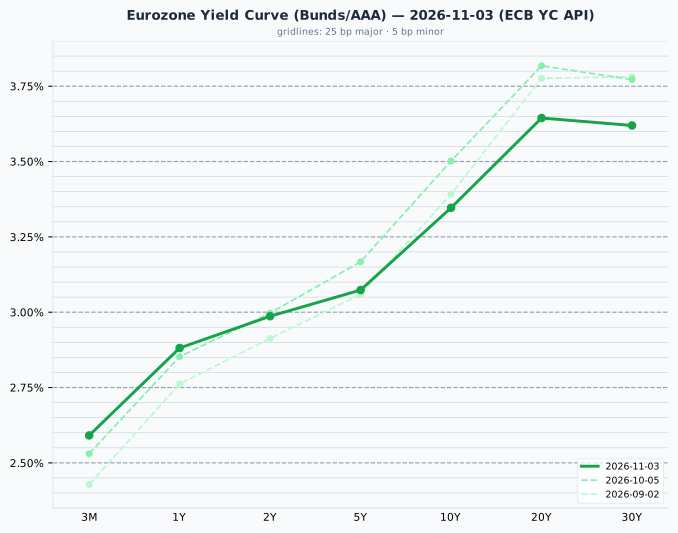
Euro area AAA government curve, 3 Nov 2026 (ECB YC API): 3M 2.59%, 1Y 2.88%, 2Y 2.99%, 5Y 3.07%, 10Y 3.35%, 20Y 3.64%, 30Y 3.62%; 2-to-10 slope +36 bp. Prior curves: 5 Oct and 2 Sep 2026.
The euro AAA curve rises from 2.59% at three months to 3.64% at 20 years, with the 30-year 2 bp below the 20-year; against 5 October it is 1 bp lower at two years, 16 bp lower at ten and 15 bp lower at thirty, so its slope has narrowed from 50 bp to 36 bp. On the day it rose 2 bp at ten years and 3 bp at thirty and was little changed at two.
Credit Markets (from FRED - authoritative)
| Market | OAS | Obs. date | vs prior obs | Series ID |
|---|---|---|---|---|
| US Investment Grade | 94 bp | 2 Nov 2026 | 0 bp | BAMLC0A0CM |
| US High Yield | 343 bp | 2 Nov 2026 | −1 bp | BAMLH0A0HYM2 |
| Euro High Yield | 356 bp | 2 Nov 2026 | −3 bp | BAMLHE00EHYIOAS |
Change is 2 Nov 2026 vs 30 Oct 2026. Credit spreads are the 2 November close; today's session is not in them yet.
On 2 November, the day oil fell more than 7%, the extra yield on lower-rated US company bonds over Treasuries narrowed 1 bp to 343 bp, in the lower part of the normal 300–500 bp range; investment-grade spreads were unchanged at 94 bp, near the bottom of their 80–150 bp range, and the euro lower-rated spread narrowed 3 bp to 356 bp. The VIX closed at 21.15 on 2 November (FRED VIXCLS), an elevated reading, up from 19.42 on 30 October, as the S&P 500 fell for a third session in a row after falls on 29 and 30 October.
Real Yields (US and Euro Area)
| Region | Nominal 10Y | Expected inflation | Real 10Y | How the real yield is obtained |
|---|---|---|---|---|
| United States | 4.95% (US Treasury par curve, 3 Nov 2026) | 2.30% (residual: nominal − real) | 2.65% (US Treasury real curve, 3 Nov 2026) | Measured. TIPS trade, so the market quotes a real yield directly; expected inflation is the residual (the breakeven) |
| Euro area | 3.35% (ECB YC API, 3 Nov 2026) | 2.02% (ECB SPF, 2026 Q4, measured) | 1.33% (residual: nominal − expected) | Constructed. No euro inflation-linked benchmark is published, so a survey expectation is subtracted from the nominal yield |
Only the US real yield is a market price; the euro figure is derived from a survey and is the softer of the two. Two mismatches apply when comparing them: the US breakeven includes a premium investors demand for inflation risk, which a survey does not, and the survey looks five years ahead against the bond's ten. Both legs are dated 3 November. The 160 bp gap between US and euro nominal 10-year yields splits into 28 bp of expected-inflation difference (2.30% against 2.02%) and 132 bp of real-rate difference (2.65% against 1.33%), figures rounded, so the gap is almost entirely real. On 3 November the US real yield rose 3 bp to 2.65% and the 10-year nominal yield 4 bp, so nearly all of the day's rise was in the real rate rather than in expected inflation, which rose 1 bp to 2.30%.
Why the US real-yield advantage is not a return a euro investor can capture
The US real yield has exceeded the euro one in every quarter since 2014, by 1.52 pp on average, and the 132 bp on these figures is under that mean. It is a structural feature (US trend growth, euro-area savings, the scarcity of German government bonds, heavy US government borrowing), not a return a euro-based reader can capture: hedging the currency removes it, because the forward exchange rate is set from the same interest differential, and holding Treasuries unhedged is a bet on the dollar rather than a bond decision. A real yield is real in its own currency; a US real yield of 2.65% is that much above US inflation, which is not a real return for someone who spends euros. The gap is stated here as a description of relative policy stance and growth expectations, and no portfolio conclusion is drawn from it.
Bond Portfolio Implications
A 10 bp rise in yields is an ordinary day's move. At the 3 Nov 2026 par yields it costs:
| Maturity | Yield | Modified duration | Loss for a 10 bp rise | Months of coupon lost |
|---|---|---|---|---|
| 2-year | 4.61% | 1.89 | 0.19% | 0.5 |
| 10-year | 4.95% | 7.81 | 0.78% | 1.9 |
| 30-year | 5.32% | 14.91 | 1.47% | 3.3 |
Months of coupon lost is the loss divided by one month of coupon (yield ÷ 12) on a par bond. Computed from the US Treasury par curve, 3 November.
The 10-year yield's 4 bp rise on 3 November cost a holder about 0.31%, about three-quarters of a month of coupon.
The 30-year Treasury pays 0.71 pp more than the 2-year for nearly eight times as much price movement per 10 bp. With Thursday's Bank of England decision and Friday's jobs report still to come, and a December Fed rise in prospect, short maturities keep most of the income with far less exposure to a move like today's.
Currencies & Commodities
Currencies (Yahoo Finance live quotes)
| Pair | Rate | Day chg % | Source |
|---|---|---|---|
| EUR/USD | 1.1199 | +0.08% | yfinance (18:35 CET) |
| USD Index (DXY, ICE) | 101.81 | +0.07% | yfinance (18:25 CET) |
| USD/JPY | 158.49 | +0.40% | yfinance (18:35 CET) |
| GBP/USD | 1.3420 | +0.10% | yfinance (18:35 CET) |
| USD/CHF | 0.8205 | +0.25% | yfinance (18:35 CET) |
FX quotes as of 18:25–18:35 CET; day change vs the previous 17:00 ET close.
Currencies moved little ahead of the US results. The yen weakened most, 0.40% to 158.49 per dollar, with US yields rising while Tokyo was shut for the holiday, and the Swiss franc weakened 0.25% to 0.8205 per dollar despite higher Swiss inflation. The euro rose 0.08% to $1.1199, having touched $1.1237 on Monday before closing at $1.1191 (Saxo), and the pound 0.10% to $1.3420; the ICE dollar index rose 0.07% to 101.81.
Commodities (Yahoo Finance front-month futures)
| Commodity | Price | Day Chg % | Ticker | Source |
|---|---|---|---|---|
| Brent Crude ($/bbl) | 103.60 | −1.12% | BZ=F | yfinance (BZF27, Jan) |
| WTI Crude ($/bbl) | 96.09 | −0.38% | CL=F | yfinance (CLZ26, Dec) |
| Gold ($/oz) | 3,940.40 | −0.74% | GC=F | yfinance (GCZ26, Dec) |
| Silver ($/oz) | 49.753 | −2.23% | SI=F | yfinance (SIZ26, Dec) |
| Copper ($/lb) | 6.4020 | −2.52% | HG=F | yfinance (HGZ26, Dec) |
| Nat Gas ($/MMBtu) | 2.895 | +1.37% | NG=F | yfinance (NGZ26, Dec) |
Prices are settlements (3 Nov 2026); day changes are settlement vs the prior session's settlement (2 Nov 2026).
Every row shows the same contract as Monday's table, so the levels are comparable. The January Brent contract (BZF27) settled at $103.60, $1.17 below Monday's settlement of $104.77, after an early rise on the reported US strikes on Qeshm Island, and the December WTI contract (CLZ26) at $96.09, $0.37 below its $96.46 settlement. January Brent is 17.84% below the 52-week high of $126.10 set by an earlier contract (range $58.72 to $126.10), and December WTI 19.58% below its $119.48 high (range $54.98 to $119.48). The December WTI contract expires on 20 November, so it is not yet near its roll.
Gold settled 0.74% lower at $3,940.40, 1.58% above Friday's 52-week low of $3,879.30 and 29.5% below its all-time high of $5,586.20 set on 29 January 2026; Saxo noted selling near $3,970, close to Monday's settlement. Silver fell 2.23% to $49.753, 59.0% below its all-time high of $121.30 set the same January day. Copper fell 2.52% to $6.4020, 6.3% below its all-time high of $6.83 set on 22 September; it had already fallen 2.8% to about $6.38 in Asian trading (Saxo). The falls in all three metals weighed on London's miners. Natural gas rose 1.37% to $2.895, in the lower part of its 52-week range of $2.483 to $7.827.
Sector & Theme Highlights
US sector funds (Select Sector SPDRs, 3 Nov close): technology (XLK) led, up 1.31%, followed by communication services (XLC, +1.18%) and industrials (XLI, +0.95%), with real estate (XLRE, +0.07%) little changed. Consumer staples (XLP) were the weakest, down 2.07%, followed by materials (XLB, −2.01%) as copper fell; energy (XLE, −0.85%), consumer discretionary (XLY, −0.70%), financials (XLF, −0.64%), utilities (XLU, −0.57%) and health care (XLV, −0.31%) fell less. Technology's rise reverses part of Monday's 2.95% fall; consumer discretionary, which rose 2.41% on Monday as oil fell, gave back part of that gain, and staples more than all of their 1.58%. Among staples, Sysco fell 9.33% after its results (Yahoo Finance).
- Chip makers rebound in New York, fall in Seoul: AMD rose 3.65% before its results and Broadcom 3.07%, while Samsung Electronics fell 4.59% and SK hynix 5.57% in Korea (Yahoo Finance; Trading Economics). AMD's revenue beat forecasts after the close and its shares rose about 8% after hours (CNBC).
- Results judged on outlook: Shopify fell 8.74% although its revenue grew 32%, and Dynatrace 14.69%; Fiserv rose 12.46% after raising its cost savings target to $1 billion, Lattice Semiconductor 10.98% on revenue up 118% and Fabrinet 15.45% on record revenue (Yahoo Finance; Stock Titan).
- Metals and miners: silver fell 2.23% and copper 2.52%, and London's miners led the FTSE 100's 1.14% fall (Yahoo Finance; Trading Economics).
- France's public finances: a negative Fitch outlook, a wider deficit and a postponed budget vote keep the 10-year OAT 160 bp over the Bund (Trading Economics; The Local).
Top Stories (Global)
- Democrats win both houses of Congress. The Democrats took control of the House and the Senate in the midterm elections, with the Associated Press calling the House early on Wednesday (CNN; CBS News; Forbes); before the vote analysts had told CNBC that shares were not priced for the party winning both houses (Stock Titan, citing CNBC).
- Treasury yields rise on a day of firm job data. September job openings rose to 7.52 million against 7.10 million expected and quits to 2.1% of workers; the 10-year yield settled at 4.95%, up 4 bp (Trading Economics; US Treasury par curve).
- AMD beats forecasts. Third-quarter revenue rose 45% to $13.4 billion against $13.09 billion expected, and AMD forecast about $17 billion for the fourth quarter; its shares rose about 8% after hours (AMD; CNBC).
- Kospi falls 3.59%. Samsung Electronics fell 4.59% and SK hynix 5.57% on renewed doubts over AI spending, more than undoing Monday's rise (Trading Economics).
- Apple and Palantir fall after their results. Apple fell 1.90% on a weaker holiday-quarter gross margin forecast as memory costs rise, and Palantir 1.65% as US contract value grew only 11% despite revenue up 96% (Yahoo Finance; Stock Titan).
- Australia raises rates to 4.85%. The Reserve Bank of Australia raised its cash rate 25 bp, by a 6-3 vote, and does not expect inflation back in its 2–3% target until late 2027 (Trading Economics).
- China pauses share listings. The securities regulator told banks to pause IPOs and large share sales by existing holders, the FT reported, after the CSI 300 fell 8.5% in October; the Shanghai Composite fell 0.82% (Reuters, citing the FT; Yahoo Finance).
- Oil swings on Iran. January Brent rose about 1.75% early on reports of limited US strikes on Qeshm Island, then fell after an Iranian official said a deal remained far off, and settled 1.12% lower at $103.60 (WSJ and Reuters, via Stock Titan; Yahoo Finance).
Looking Ahead
- Wednesday 4 November: the euro-area flash inflation estimate for October (as cited in the 29 Oct briefing); the US Treasury's quarterly refunding announcement, which sets how much long-term debt it will sell; results from McDonald's, Qualcomm, Novo Nordisk, Uber and AppLovin (Saxo).
- Thursday 5 November: the Bank of England's and Norges Bank's decisions, with a Bank of England rise widely expected; results from ConocoPhillips, Deutsche Telekom, Airbnb and Lumentum (Saxo; Trading Economics, as cited in the 2 Nov briefing).
- Friday 6 November: the US jobs report for October, with 55,000 jobs expected (Stock Titan, as cited in the 2 Nov briefing).
- Further out: the second estimate of euro-area third-quarter GDP on 13 November (as cited in the 30 Oct briefing); the deadline for the National Assembly's first reading of the 2027 budget's revenue part at midnight on 17 November (Cointelegraph); S&P Global's review of France's rating on 27 November (The Local).
Market closures - Closed today: Japan (Culture Day). - None in the next five days (4 Nov to 8 Nov 2026). - Further out: Brazil 20 Nov 2026 (Black Consciousness Day); the US bond market, not stocks, closes on 11 Nov for Veterans Day. - No Indian holiday data is available here, so Indian closures are not checked.
Data sources: US Treasury par and real curves (3 Nov 2026) and FRED (policy rates, VIX, credit spreads, macro); ECB YC API (AAA curve, 3 Nov 2026) and ECB SPF (2026 Q4); equity indices, ETF P/E proxies, commodity futures, US sector funds and individual stock prices at the 3 Nov close, and FX quoted at 18:25–18:35 CET, via Yahoo Finance; European, UK and Japanese bond yields, economic releases and news via web search (Trading Economics, Stock Titan, CNBC, Saxo, Reuters, The Local, Bloomberg, Cointelegraph, CNN, CBS News, Forbes, AMD).