2026 08 21
Global Financial Briefing — Friday, 21 August 2026
Americas index levels, commodities and day changes reflect the 21 August closing print, and the US Treasury curve the 21 August settlement. Euro area fixed income, FX and macro figures are dated inline.
Market Overview
Equities closed the week on the front foot, but the week's real story was written in the bond market rather than the stock market. Global long-end yields pushed to fresh multi-month highs after the US Treasury's attempt to steady its own market — Secretary Bessent doubling the size of long-dated buyback operations from $2bn to at least $4bn apiece — was met with a shrug. The US 30-year settled at 5.27% on 21 August (US Treasury par curve), the 10-year at 4.74% and the 2-year at 4.24%. Measured against the 20 August settlement that is +4 bp at the 30-year, +5 bp at the 10-year and +5 bp at the 2-year — an almost perfectly parallel upward shift, and a different move from the one the preceding sessions delivered. Through 20 August the front end had been anchored while duration repriced; on 21 August the whole curve rose together and the 10Y–2Y spread finished unchanged at 50 bp. That distinction matters: a parallel shift is not a pure term-premium story, because a front end that moves with the long end is a front end repricing the expected path of policy.
Against that backdrop the equity bounce was broad but modest, and notably led by the least duration-sensitive parts of the market: the Dow added 0.98% at the close while the Nasdaq 100 managed only 0.33%, exactly the ordering you would expect when the discount rate is the binding constraint. Volatility is unremarkable: the VIX closed at 16.01 on 20 August (FRED VIXCLS), in the moderate band and giving no sign that equity markets regard the bond move as a stress event. Europe closed higher across the board (STOXX 600 +0.59%, DAX +0.59%, FTSE 100 +0.64%), helped by gilts easing back to 5.05% after touching a 14-month high earlier in the week. Asia was mixed and thin: the Nikkei slipped another 0.30% to 66,016 and now sits 9.4% below its 52-week high after a violent three-session drawdown from 69,220 on 17 August to 65,326 on 19 August, while Hong Kong rallied 1.21% and Shanghai was flat.
The commodity complex did the most interesting work. Gold settled 2.39% higher and silver 2.09% higher — by some margin the largest moves on the board — on continued central-bank buying and investment demand, even as real yields rose 5 bp, which is not the textbook relationship and suggests the bid is about reserve diversification and geopolitical hedging rather than the discount rate. Oil held its gains (Brent +0.65% at $94.39) despite Iran's president publicly urging an end to the war with the US, with Trump's threat to crush the Iranian economy keeping the risk premium two-sided. For a euro-based reader the single most consequential number of the day is domestic: the OAT-Bund spread at 83.6 bp, near the top of its 59–85 bp one-year range, with the French 10-year at 4.08% — within a basis point of Italy's 4.09%. France now borrows at Italy's cost of funds. The Jackson Hole symposium runs 27–29 August — next week, not this one — and the Fed's signal there remains the dominant scheduled event risk for global duration.
Global Indices Snapshot
Americas
| Index | Level | Day Chg | Day Chg % | Source |
|---|---|---|---|---|
| S&P 500 | 7,674.37 | +33.21 | +0.43% | yfinance ^GSPC |
| Nasdaq 100 | 29,308.86 | +95.70 | +0.33% | yfinance ^NDX |
| Dow Jones | 53,277.01 | +517.81 | +0.98% | yfinance ^DJI |
| Brazil IBOV | 171,031.73 | +3,104.57 | +1.85% | yfinance ^BVSP |
Americas data reflects the 21 Aug close. FRED SP500 publishes the S&P 500 close for 21 August
at 7,674.37, matching the figure above to the cent.
Europe
| Index | Level | Day Chg | Day Chg % | Source |
|---|---|---|---|---|
| Euro STOXX 600 | 654.18 | +3.83 | +0.59% | yfinance ^STOXX |
| Euro STOXX 50 | 6,462.22 | +40.16 | +0.63% | yfinance ^STOXX50E |
| CAC 40 | 8,484.43 | +31.34 | +0.37% | yfinance ^FCHI |
| DAX | 26,136.56 | +153.52 | +0.59% | yfinance ^GDAXI |
| FTSE 100 | 10,816.56 | +68.40 | +0.64% | yfinance ^FTSE |
| SMI (Swiss) | 14,456.98 | +88.82 | +0.62% | yfinance ^SSMI |
European data reflects today's close (21 Aug).
Asia-Pacific
| Index | Level | Day Chg | Day Chg % | Source |
|---|---|---|---|---|
| Nikkei 225 | 66,016.36 | −200.43 | −0.30% | yfinance ^N225 |
| Hang Seng | 26,009.46 | +310.97 | +1.21% | yfinance ^HSI |
| Shanghai Comp | 3,905.20 | +1.48 | +0.04% | yfinance 000001.SS |
| ASX 200 | 9,058.90 | −24.90 | −0.27% | yfinance ^AXJO |
| Kospi (Korea) | 6,912.95 | +60.37 | +0.88% | yfinance ^KS11 |
Asia-Pacific data reflects today's close (21 Aug).
Emerging Markets
| Index | Level | Day Chg % | Source |
|---|---|---|---|
| MSCI EM (EEM) | 67.12 | +0.75% | yfinance EEM |
| India Nifty 50 | 24,252.00 | +0.08% | yfinance ^NSEI |
| South Africa | 72.51 | +2.89% | yfinance EZA |
EEM and EZA are US-listed ETFs and reflect the 21 Aug NYSE close. Nifty 50 reflects the 21 Aug Indian close.
Index Valuations & Investment Risk
Valuation Table
| Index | Trailing P/E (live) | Hist avg trailing P/E (†) | Premium / discount |
|---|---|---|---|
| S&P 500 | 25.80x | ~16-18x | +51.7% |
| Nasdaq 100 | 30.50x | ~25-30x | +10.9% |
| Euro STOXX 600 | 18.06x | ~15-17x | +12.9% |
| CAC 40 | 17.40x | ~14-16x | +16.0% |
| DAX | 18.92x | ~15-17x | +18.3% |
| FTSE 100 | 18.18x | ~13-15x | +29.9% |
| Nikkei 225 | 22.23x | ~20-22x | +5.9% |
| MSCI EM | 17.42x | ~13-15x | +24.4% |
(†) Hist avg trailing P/E: static long-run reference constants, not live
data. Live trailing P/E from yfinance trailingPE on ETF proxies (SPY, QQQ, EXSA.DE, CAC.PA,
EXS1.DE, ISF.L, 1321.T, EEM). Premium computed against the midpoint of the historical range.
Bold = more than 20% above the historical average.
The striking feature is how narrow the expensive part of the world has become. The S&P 500 at 51.7% above its long-run average is the only major index in genuinely stretched territory — and notably, the Nasdaq 100 is not, at just 10.9% above a historical average that is itself high. That combination says the premium is not simply "big tech is expensive"; it is that the broad US index has re-rated toward the growth complex. Europe sits 13–18% above its own averages, which is elevated but ordinary. The FTSE 100's +29.9% is the surprise on this table and deserves scepticism rather than alarm: it is measured against a historical average depressed by two decades of heavy energy and financials weighting, and ISF.L's trailing earnings reflect a very different index composition than the one that set that benchmark.
Investment Risk Assessment for ETF Investors
United States (S&P 500 / Nasdaq ETFs). The S&P 500 closed at 25.80x trailing, an earnings yield of 3.88% (1÷25.80), against a 10-year Treasury at 4.74% (US Treasury par curve, 2026-08-21). The earnings yield gap is therefore −0.86 pp: a Treasury pays more current income today than the index's earnings yield, before any growth. On the Nasdaq 100 the gap is wider at −1.46 pp. The index sits just below the top of its 52-week range of 6,316.91–7,816.70, 1.77% above its 50-day and 8.15% above its 200-day moving average — a market in an intact uptrend, priced for it. The specific risk here is mechanical: with the 10-year real yield at 2.40% (US Treasury real curve, 2026-08-21) and the long end still repricing term premium, the discount rate is moving against the most duration-sensitive earnings streams while the index's valuation gives it very little cushion. Concentration compounds this — the same handful of names carry both the index premium and the rate sensitivity.
Europe (STOXX 600 / CAC 40 / DAX ETFs). The STOXX 600 at 18.06x yields 5.54% (1÷18.06) against a 10-year Bund of 3.24%, a euro earnings yield gap of +2.30 pp — positive, and 3.2 pp wider than the US gap. The CAC 40 at 17.40x is the cheaper of the two large euro markets on this measure. Part of that transatlantic difference is not risk compensation at all but the gap between US and euro inflation and policy paths, so it needs the real-yield check: on real yields the US gap is +1.48 pp and the euro gap +4.30 pp, a 2.8 pp difference rather than 3.2 pp. The correction narrows the gap but does not close it — Europe is genuinely cheaper on current income, not merely differently discounted.
The specific European risk is now sovereign rather than corporate. France's 10-year at 4.08% and an OAT-Bund spread of 83.6 bp near the top of its one-year range means French fiscal risk is being priced, and the convergence with Italy (4.09%) is a repricing of France, not a rehabilitation of Italy. A CAC 40 holding is not directly exposed to the OAT, but a sustained widening tightens domestic financial conditions and weighs on the domestically-earning half of the index.
On currency: a euro-based investor holding EUR-quoted European funds has no FX effect on the quoted value of the holding, but real currency exposure remains inside the earnings — CAC 40 and STOXX 600 constituents are multinationals earning substantially abroad. The exposure is smaller, slower and partly hedged by foreign cost bases, not absent.
Japan (Nikkei / TOPIX ETFs). At 22.23x the Nikkei is only 5.9% above its historical average, the cheapest major market on this table relative to its own history, and it sits 9.36% below its 52-week high after this week's sharp drawdown. The offsetting risk is policy: the BOJ holds at 1.00% after June's hike, has warned that core inflation will run "clearly above" 2% from the second half of the fiscal year, and the market puts roughly even odds on a further hike at the 17 September meeting. The 10-year JGB at 2.88% is doing real work now. With USD/JPY at 158.96, a euro investor's unhedged yen exposure is a live variable in its own right; hedging costs are meaningfully lower than they were, given the narrowed rate differential.
Emerging Markets (MSCI EM ETFs). EEM at 17.42x is 24.4% above its historical average — EM is no longer the automatic valuation discount it once was, largely because the index's China weight has fallen while Taiwan and Korea semiconductor exposure has risen, importing developed-market technology multiples. EEM sits 6.22% below its 52-week high. Korea's own index shows the volatility this brings: the Kospi's 52-week range runs from 3,135 to 9,386, and it fell 5.6% on 19 August before recovering 5.9% the following session.
Overall Risk Score: Moderate — fair value, mixed signals, with the important caveat that the label conceals a wide dispersion. US large-cap is high valuation risk / low margin of safety; Europe and Japan are closer to moderate; nothing on this board is at an attractive relative valuation on trailing earnings alone.
Disclaimer: This is financial information, not personalised investment advice. Past valuations do not guarantee future returns. Consult a financial advisor before investing.
US Economic Indicators (FRED — authoritative)
| Indicator | Current | Prior | Delta | Reference Date | FRED Series |
|---|---|---|---|---|---|
| CPI YoY % | 3.30% | — | — | Jul 2026 | CPIAUCSL |
| Core CPI YoY % | 2.47% | — | — | Jul 2026 | CPILFESL |
| Unemployment Rate | 4.1% | — | — | Jul 2026 | UNRATE |
| Nonfarm Payrolls | 158,858k | 158,881k | −23k | Jul 2026 | PAYEMS |
| 10Y TIPS Real Yield | 2.40% | — | — | 2026-08-21 | (US Treasury real curve) |
Note: FRED macro data is monthly and typically lags 4–6 weeks. The real yield above comes from the US Treasury real curve overlay, which runs a business day ahead of FRED's DFII10; it is cited here in the DFII10 row for continuity of the series, not as a FRED observation.
Two things stand out. Headline CPI at 3.30% is running 83 bp above core at 2.47% — an unusually wide wedge, and one that points at energy and food rather than at underlying price pressure. That matters for how the Fed reads it, and it is consistent with a market that is repricing term premium rather than the policy path. Second, payrolls fell by 23k in July. A negative print alongside a 4.1% unemployment rate is a labour market that is cooling rather than cracking, but it is the kind of data that would normally pull yields down; that it has not is the clearest evidence that the long end is being driven by supply and term premium, not by growth expectations.
Other economic releases today (from web search): the August flash PMI round landed this morning — French, German and euro area flash composites, followed by euro area consumer confidence and the US flash PMIs. US consensus was 53.9 for manufacturing (unchanged) and 54.0 for services, easing from 54.6 in July; the actual prints were not retrieved and are marked (not retrieved). Also scheduled: US initial jobless claims, the Philadelphia Fed manufacturing index, existing home sales and the Conference Board leading index — actuals (not retrieved). Neither the flash PMIs nor the other Thursday and Friday releases had published figures available, so they remain (not retrieved) rather than estimated. The Jackson Hole symposium does not open today: the Kansas City Fed's 2026 symposium runs 27–29 August on the topic "Financial Innovation: Implications for Payments and Policy".
Fixed Income & Bond Analysis
Policy Rates
| Central Bank | Rate | Source |
|---|---|---|
| Fed Funds (upper) | 3.75% | FRED DFEDTARU (2026-08-21) |
| Fed Funds (lower) | 3.50% | FRED DFEDTARL (2026-08-21) |
| Effective FFR | 3.63% | FRED DFF (2026-08-19) |
| ECB Deposit Rate | 2.25% | FRED ECBDFR (2026-08-21) |
| BOJ Policy Rate | 1.00% | web search (held 2026-07-31, 8–1 vote) |
| BOE Bank Rate | ~3.73% | FRED IUDSOIA (SONIA proxy, 2026-08-19) |
Government Bond Yields
| Country | 2Y Yield | 10Y Yield | 30Y Yield | Day Chg (10Y) | Source |
|---|---|---|---|---|---|
| USA | 4.24% | 4.74% | 5.27% | +5.0 bp | US Treasury par curve (2026-08-21) |
| Germany | (not retrieved) | 3.24% | (not retrieved) | ~−1 bp | web (2026-08-21) |
| Euro AAA | 2.79% | 3.28% | 3.73% | — | ECB YC API (2026-08-20) |
| France | (not retrieved) | 4.08% | (not retrieved) | — | web (2026-08-21) |
| UK | (not retrieved) | 5.05% | (not retrieved) | — | web (2026-08-21) |
| Japan | (not retrieved) | 2.88% | (not retrieved) | — | web (2026-08-21) |
| Italy | (not retrieved) | 4.09% | (not retrieved) | — | web (2026-08-19) |
The USA row is settled data for 21 August throughout, with the day change measured against the 20 August par curve (10Y 4.69% → 4.74%). The "Euro AAA" row is the ECB's AAA-rated euro area composite curve, which is the term structure used for the chart and the real-yield work below; the Germany row is the Bund specifically. German 2Y/5Y/30Y, UK 2Y and the French and Japanese term structures were not retrieved and are left blank rather than estimated.
Yield Curve Spreads:
- 10Y–2Y spread: +50 bps (US Treasury par curve, 2026-08-21) — positively sloped and normal, but not steep. A steep curve on the historical convention is above ~75 bp; this is the middle of the range. It is unchanged from 20 August, because the 21 August session lifted the 2-year and the 10-year by the same 5 bp — the slope was built over preceding sessions by the long end rising, but Friday itself added nothing to it.
- 10Y–3M spread: +86 bps (US Treasury par curve, 2026-08-21) — comfortably positive, and 4 bp wider on the day as the 10-year rose 5 bp against a 3-month bill up 1 bp. The classic recession signal requires inversion, and there is none here.
One detail worth flagging: the 3-month bill at 3.88% sits 25.5 bp above the Fed funds target midpoint of 3.625% and above the effective rate of 3.63%. Bills pricing above the policy rate at the three-month horizon means the market is pricing no cut inside that window — and if anything a small tilt the other way. That is a meaningfully hawkish front end to carry into Jackson Hole.
OAT-Bund Spread: 83.6 bp (2026-08-21), against a one-year range of 59–85 bp. This is the key French fiscal risk indicator and it is close to its widest in a year. The French 10-year at 4.08% is now within one basis point of Italy's 4.09%, a convergence that reflects France repricing wider rather than Italy tightening. For a France-based investor this is the most directly relevant number in the briefing: it feeds domestic funding costs, mortgage rates and the fiscal debate simultaneously.
Yield Curve Charts
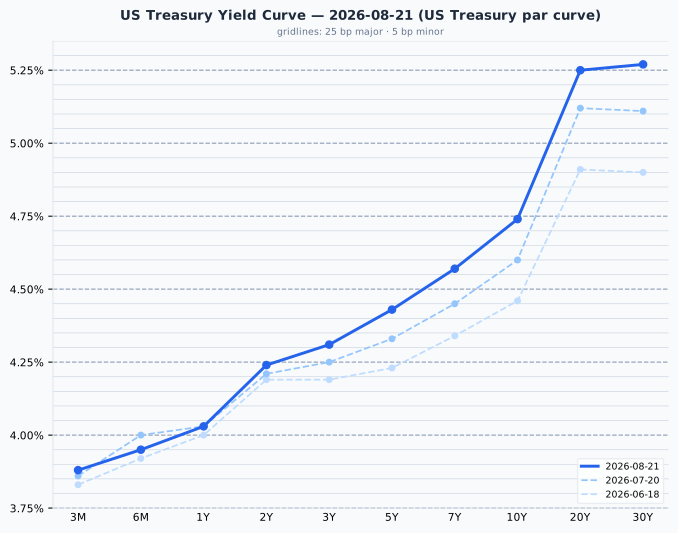
The US curve is positively sloped throughout with a pronounced steepening beyond seven years and a slight kink at 20 years, where the 5.25% yield sits just below the 30-year's 5.27%. Since the 20 July curve the entire structure has shifted up, but unevenly: the 3-month is up just 2 bp and the 2-year 3 bp, while the 10-year is +14 bp and the 30-year +16 bp — a bear-steepening over the month that has repriced duration far more than the policy path, even though Friday's own session was a parallel move.
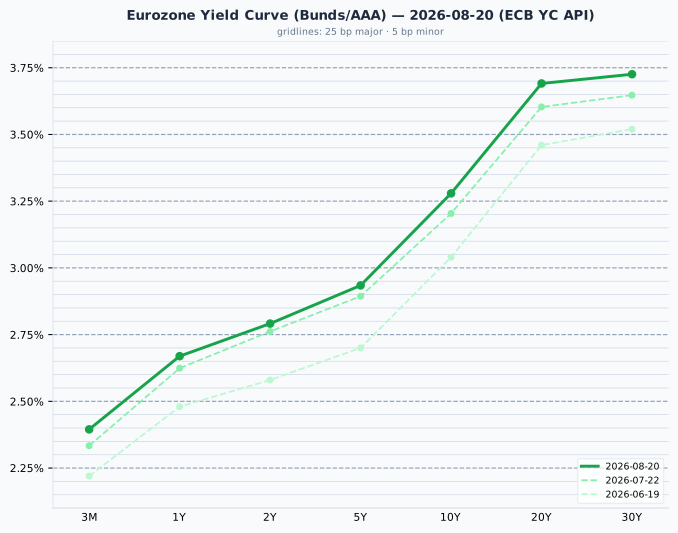
The euro AAA curve is also positively sloped and materially lower than the US at every maturity, with the steepest segment between 10 and 20 years. Since 22 July it has shifted up in parallel fashion — 3M +6 bp, 10Y +8 bp, 30Y +8 bp — a more uniform move than the US, which is consistent with the euro area repricing the global term-premium impulse rather than a domestic supply shock.
Credit Markets (from FRED — authoritative)
| Market | OAS Spread | Series ID |
|---|---|---|
| US Investment Grade | 82 bps | BAMLC0A0CM (2026-08-20) |
| US High Yield | 275 bps | BAMLH0A0HYM2 (2026-08-20) |
| Euro High Yield | 256 bps | BAMLHE00EHYIOAS (2026-08-20) |
All three are historically tight. US high yield at 275 bp is below the 300–500 bp range that constitutes normal conditions, and investment grade at 82 bp is at the very bottom of its 80–150 bp normal band. Euro high yield is tighter still than US high yield, at 256 bp.
The interpretation cuts two ways and it is worth being explicit about both. Tight spreads say the credit market sees no distress — corporate balance sheets are being funded easily, and default expectations are low. That is genuine information and it argues against reading this week's bond selloff as a risk event. But spreads this tight also mean investors are being paid very little to take credit risk, and they leave no room to absorb a deterioration. Combined with a stretched US equity multiple and a long end that is still repricing, the compensation for risk across the capital structure is thin at exactly the moment the risk-free rate is rising.
Real Yields (US and Euro Area)
| Region | Nominal 10Y | Expected inflation | Real 10Y | How the real yield is obtained |
|---|---|---|---|---|
| United States | 4.74% (US Treasury par curve, 2026-08-21) | 2.34% (residual — the breakeven) | 2.40% (US Treasury real curve, 2026-08-21) | Measured. TIPS trade, so the market quotes a real yield directly; expected inflation is backed out as the residual |
| Euro area | 3.28% (ECB YC API, 2026-08-20) | 2.04% (ECB SPF, 2026 Q3 — measured) | 1.24% (residual) | Constructed. No euro inflation-linked benchmark is published, so a survey expectation is subtracted from the nominal yield |
The two rows are built in opposite directions, and only the US real yield is something anyone actually trades. The euro figure is the softer of the two: it subtracts a survey number from a market number, and should be treated as an estimate rather than a price. Two mismatches follow from that construction and should be stated whenever the pair is compared — the US breakeven embeds an inflation risk premium that a survey does not, and the SPF horizon is five years against the bond's ten.
Decomposing the 146 bp nominal gap between the US and euro area 10-year: only 30 bp is a difference in expected inflation (2.34% vs 2.04%), while 116 bp is a difference in real rates (2.40% vs 1.24%). This is overwhelmingly a real-rate story, not an inflation story — the US is paying substantially more for real money, reflecting relative growth expectations, fiscal supply and the Treasury's term-premium problem, not a divergent inflation outlook.
⚠️ The US–euro real rate gap is not an investment opportunity
The US real yield has exceeded the euro one in every quarter since 2014. It is a structural feature — higher US trend growth, euro-area excess savings, Bund scarcity, US fiscal supply — and not a trade a euro-based reader can capture. Hedging the currency cancels it exactly, because the forward rate is set precisely to remove the interest differential; unhedged, buying Treasuries for the yield pickup is a bet on the dollar, not a bond decision. A real yield is real in its own currency: 2.40% means 2.40% above US inflation, which is not a real return for someone who spends euros. The gap is stated here as a macro fact about relative policy stance and growth expectations, and no portfolio conclusion should be drawn from it.
Bond Portfolio Implications
Earnings yield gap — what it is. The S&P 500 gap is (1÷25.80) − 4.74% = −0.86 pp. The euro gap is (1÷18.06) − 3.24% = +2.30 pp. This measure compares the income the two instruments offer today, using nothing but quoted prices — no growth forecast, no assumptions. That is its virtue: it tells you honestly that right now, a US investor can lock a 4.74% Treasury coupon or accept equity risk at a 3.88% earnings yield, while a euro investor chooses between 3.24% on a Bund and 5.54% on the STOXX 600.
What it cannot do. It does not forecast whether equities will beat bonds. Adding the bond yield to the earnings yield empirically makes the equity forecast worse than the earnings yield alone. Nothing predictive should be read into the negative US number.
Two structural biases. First, the gap ignores growth: a bond coupon is fixed for a decade while the earnings behind the equity yield grow roughly with inflation, so the gap understates equities by approximately expected inflation. Stating it against the real yield corrects this — the US gap becomes (1÷25.80) − 2.40% = +1.48 pp, and the euro gap (1÷18.06) − 1.24% = +4.30 pp. The size of that correction is the point of interest: 2.40 pp for the US, enough to flip the sign of the gap outright. A measure that changes from "bonds pay more" to "equities pay more" depending on which of two defensible constructions you use should not be carrying much weight in a decision. Second, an equity holder does not receive the full earnings yield — only the dividend and buyback portion arrives as cash, and the rest is retained.
Are yields high enough to make bonds attractive? On current income alone, in the US, yes: a 4.74% nominal and 2.40% real 10-year offers a substantial guaranteed real return against an equity market priced 51.7% above its long-run multiple. In the euro area the picture reverses — a 1.24% real Bund yield against a 5.54% STOXX 600 earnings yield leaves equities with a much wider current-income advantage. For the forward-looking valuation argument, lean on earnings yield versus its own history rather than on the gap; that measure does carry predictive power where the gap does not.
Duration risk. If yields rise 100 bp, a 10-year bond loses roughly 8–9% of its price; a 30-year loses far more. With the long end actively repricing term premium and the Treasury's buyback expansion failing to arrest it, the asymmetry currently favours the short and intermediate curve — you give up only 50 bp of yield moving from 10Y to 2Y (4.74% vs 4.24%) and shed most of the duration risk. The steepening dynamic argues against reaching for the 20–30 year sector for the extra ~53 bp it offers over the 10-year.
Currencies & Commodities
Currencies:
| Pair | Rate | Source |
|---|---|---|
| EUR/USD | 1.1581 | FRED DEXUSEU (2026-08-14) |
| USD Index | 118.90 | FRED DTWEXBGS (2026-08-14) |
| USD/JPY | 158.96 | web search (2026-08-21, −0.06%) |
| GBP/USD | 1.3643 | web search (2026-08-21, +0.30%) |
| USD/CHF | 0.7996 | web search (2026-08-21, −0.11%) |
Note the date mismatch: the two FRED series are a week stale (14 August — DEXUSEU and DTWEXBGS publish weekly), while the web-sourced pairs are current. Do not read a cross-rate off this table. Sterling at 1.3643 is its strongest in more than three months, and the franc below 0.80 to the dollar reflects continued safe-haven demand.
Commodities (all front-month futures):
| Commodity | Price | Day Chg % | Ticker | Source |
|---|---|---|---|---|
| Brent Crude | 94.39 | +0.65% | BZ=F | yfinance |
| WTI Crude | 87.06 | +0.26% | CL=F | yfinance |
| Gold ($/oz) | 4,680.60 | +2.39% | GC=F | yfinance |
| Silver ($/oz) | 69.53 | +2.09% | SI=F | yfinance |
| Copper ($/lb) | 6.5870 | +1.82% | HG=F | yfinance |
| Nat Gas ($/MMBtu) | 2.811 | +1.85% | NG=F | yfinance |
Day changes are settlement-to-settlement — the 21 August settlement against the 20 August settlement, the market convention for a completed session.
Gold settled at $4,680.60, 16.21% below its all-time high of $5,586.20, set on 29 January 2026. Its 2.39% gain is the largest move on the board, and it came on a day when the 10-year real yield rose 5 bp — the opposite of the usual relationship, which points to reserve diversification and central-bank buying (China in particular) rather than a discount-rate trade. Silver settled at $69.53, 42.68% below its all-time high of $121.30, also set on 29 January 2026, having traded as low as $38.51 in the past year; the January spike and subsequent collapse make the 52-week range of $38.51–121.30 more informative than the distance to the record.
Copper settled at $6.5870/lb, slightly below its all-time high of $6.728/lb — 2.10% below a record set on 6 August 2026, just two weeks ago, and the only commodity on this board trading near a genuine high. That is a live industrial-demand signal worth watching. Brent at $94.39 and WTI at $87.06 sit within 52-week ranges of $58.72–126.10 and $54.98–119.48 respectively — both in the upper half but well off the year's highs, with the war premium intact but two-sided after Iran's overture. Natural gas at $2.811/MMBtu is near the bottom of its $2.483–7.827 52-week range despite a 1.85% gain, the third-largest on the board.
Contract note: the front month is unchanged across both sessions — CL=F,
BZ=F, GC=F, SI=F, HG=F and NG=F still point at CLV26.NYM, BZV26.NYM, GCZ26.CMX,
SIU26.CMX, HGU26.CMX and NGV26.NYM respectively, so every day change above compares like
with like. The WTI and natural gas generics had just rolled:
CL=F points at
CLV26.NYM (October) and NG=F at NGV26.NYM, while Yahoo's expireDate field still reports the
September expiries. The quoted levels already reflect the new contracts. Brent's BZV26.NYM
expires 31 August, so that roll is still ahead.
Crypto: not retrieved — no notable moves surfaced in today's news search.
Sector & Theme Highlights
Precious metals were the day's standout, with gold and silver both settling more than 2% higher, ahead of a complex that was firm across the board. Industrial metals were not far behind — copper's 1.82%, leaving it 2.10% off its record, extends a theme that has been building through August, and sits oddly alongside soft Chinese equity performance.
Within equities, the day's rotation was duration-driven rather than sector-driven, and the closing print made the point emphatically: the Dow's 0.98% against the Nasdaq 100's 0.33% is the signature of a market discounting cash flows at a higher rate, favouring near-term earnings over long-dated growth. The Dow added a further 0.19% into the bell while the Nasdaq 100 was a shade lower, widening the spread between them from 44 bp to 65 bp. South Africa (EZA +2.89%) was the strongest single market on the board, a straightforward read-through from the precious and industrial metals bid. Brazil (+1.85%) benefited from the same commodity impulse.
The dominant cross-market theme remains fiscal supply and term premium. The Treasury buyback expansion failing to steady the US long end, gilts at a 14-month high, and the OAT-Bund spread near its one-year wide are three expressions of the same thing: sovereign borrowers in developed markets are being asked to pay more for duration, and that repricing is now the primary transmission channel into equity valuations. Middle East geopolitics is the second theme, with the Iran conflict keeping an energy risk premium in place that feeds directly into the headline-versus-core inflation wedge visible in the US CPI data.
Top Stories (Global)
- Treasury doubles long-end buybacks, market unmoved. Secretary Bessent raised the size of long-dated debt buyback operations from $2bn to at least $4bn each. The 30-year nonetheless settled at 5.27% on 21 August (US Treasury par curve), 4 bp higher on the day, and the failure of the intervention to steady the long end is the week's defining market fact.
- Jackson Hole is next week, not this one, and the Fed's path is genuinely uncertain. The Kansas City Fed's 2026 symposium runs 27–29 August on "Financial Innovation: Implications for Payments and Policy". Fed funds remain at 3.50–3.75%, and the 3-month bill trading 25.5 bp above the target midpoint says the market expects no cut inside three months. The symposium remains the dominant scheduled event risk.
- European bond yields hit multi-year highs on Iran-war inflation fears earlier in the week (Euronews, 18 August), with UK gilts touching a 14-month high before easing back to 5.05% on 21 August.
- France borrows at Italy's cost. The OAT-Bund spread at 83.6 bp is near the top of its 59–85 bp one-year range, and the French 10-year at 4.08% has converged with Italy's 4.09% — a repricing of French fiscal risk rather than an Italian improvement.
- Oil eases as Iran's president urges an end to the war with the US, though Trump's threat to crush the Iranian economy clouded peace prospects and kept crude higher on the day.
- Gold's rally is a central-bank story. Continued official-sector buying, notably from China, plus robust investment demand drove a 2.39% single-day gain despite a 5 bp rise in the 10-year real yield.
- BOJ warns on inflation while holding at 1.00%. The 31 July hold was an 8–1 vote, with the Bank signalling core inflation will run "clearly above" 2% from the second half of the fiscal year. Markets price roughly even odds of a hike on 17 September, and the 10-year JGB at 2.88% is repricing accordingly.
Looking Ahead
Central banks - Jackson Hole Economic Symposium, 27–29 August — next week, at Jackson Lake Lodge, on "Financial Innovation: Implications for Payments and Policy" (Federal Reserve Bank of Kansas City). The Fed chair's remarks are the single largest scheduled risk event for global duration. - Bank of Japan MPM, 17 September — market-implied odds of a 25 bp hike are around even. Given the BOJ's inflation warning and the yen at 158.96, this is the most consequential non-Fed meeting on the horizon.
Economic releases (next 1–5 trading days) - Final August PMI revisions follow the flash round released on 21 August. The flash actuals themselves had not published a retrievable figure and remain (not retrieved) above. - Monthly-end euro area inflation prints and US personal income/PCE data fall in the coming week — PCE in particular, given the 83 bp wedge between headline and core CPI. - Watch the US Treasury's auction calendar closely: with buybacks failing to steady the long end, each long-dated auction is now a market event in its own right.
Market closures (from the Nager.Date holiday calendar) - Monday 31 August — United Kingdom: Summer Bank Holiday. The LSE will be closed; FTSE 100 figures will be stale on that date. - No other closures in the US, Germany, France, Japan, Australia, Switzerland, Canada, Korea or Brazil in the next fifteen days. (India: no holiday data in the 2026 calendar, so that country's closures could not be checked.)
Other - The Iran-US conflict remains the principal geopolitical variable for energy and, through the headline inflation channel, for the long end of every developed sovereign curve.