2026 09 04
Global Financial Briefing — Friday, 4 September 2026
Americas index levels, commodities and day changes reflect the 4 September closing print; the US Treasury row, the curve spreads and the US yield curve chart use Treasury's settled 4 September par curve. FX and macro figures are dated inline.
Market Overview
The August employment report landed at 14:30 CEST and rearranged the day. US employers added 162,000 jobs, against a consensus near 55,000, and the unemployment rate held at 4.1%. In the ordinary run of things that is good news. In September 2026 it is not, because the Federal Reserve is not debating how fast to cut: it is debating whether to hike. CME FedWatch odds of a quarter-point increase on 16 September moved from roughly 50% on Thursday, after Governor Waller suggested he could support holding, to about 60% within an hour of the print. Equities went the way that arithmetic implies, though not uniformly and not for the whole session. The Dow closed off 272 points (-0.51%) and the S&P 500 down 0.38%, but the Nasdaq 100 reversed an early decline to finish up 0.21%, the mega-cap complex once again absorbing a rates shock better than the broad market. The reversal is itself the story: the index that carries the most duration risk in its multiple was the one that closed green.
The bond story is the one worth dwelling on, and it is global rather than American. The US curve settled Friday at 4.78% on the 10-year, up 1 bp on the session, with the 2-year up 3 bp to 4.37%, the 5-year up 2 bp and the 13-week bill up 2 bp, while the 30-year eased a basis point to 5.24%. The front end is doing the work and the long end is not following, which is what a hike repricing looks like. But the more striking numbers are outside the United States. The euro area AAA 10-year sits at 3.36%, up 22 bp in a month. UK 10-year gilts are at 5.16%, some 39 bp above the equivalent Treasury and 180 bp above the Bund. And France, with the 2027 budget still unresolved and a presidential election next spring, now borrows for ten years at roughly 4.21%, at or fractionally above Italy. A French sovereign trading through a BTP is not a rounding error; it is the market repricing twenty years of assumed hierarchy inside the euro area. The long end everywhere is being asked to absorb fiscal supply that no central bank is buying, and it is charging for it.
Asia had a good session before any of this happened. The Nikkei rose 1.26%, the Kospi 1.64% and the Hang Seng 1.74%, with emerging markets broadly firm (EEM +1.82% at the close). Europe finished mixed and quiet: the STOXX 600 added 0.12% and the DAX 0.17%, while the CAC 40 slipped 0.09%, the French index continuing to trade with its own political discount. Underneath the equity calm, the precious metals unwind is the year's most under-discussed move. Gold settled at $4,477, 19.9% below its January record of $5,586, and silver at $66.75 is 45.0% below its own $121.30 peak. Both had been the consensus trade for a cutting cycle. The cutting cycle did not arrive, and the positioning is being dismantled. Volatility, meanwhile, refuses to notice any of it: the VIX closed Thursday at 14.32, which is complacent by any historical standard.
Global Indices Snapshot
Americas
| Index | Level | Day Chg | Day Chg % | Source |
|---|---|---|---|---|
| S&P 500 | 7,718.60 | -29.11 | -0.38% | yfinance ^GSPC |
| Nasdaq 100 | 29,544.15 | +61.85 | +0.21% | yfinance ^NDX |
| Dow Jones | 53,414.25 | -271.86 | -0.51% | yfinance ^DJI |
| Brazil IBOV | 185,147.16 | -40.97 | -0.02% | yfinance ^BVSP |
Americas data reflects the 4 Sep close.
Cross-check: FRED SP500 for 2026-09-04 prints 7,718.60, matching the ^GSPC close exactly. Two of
the four rows changed direction over the afternoon: the Nasdaq 100 closed
higher after being marginally lower at midday, and the Bovespa gave up a 0.34% gain to finish a
whisker below flat.
Europe
| Index | Level | Day Chg | Day Chg % | Source |
|---|---|---|---|---|
| Euro STOXX 600 | 649.88 | +0.78 | +0.12% | yfinance ^STOXX |
| Euro STOXX 50 | 6,392.93 | +10.34 | +0.16% | yfinance ^STOXX50E |
| CAC 40 | 8,278.77 | -7.63 | -0.09% | yfinance ^FCHI |
| DAX | 26,046.40 | +43.08 | +0.17% | yfinance ^GDAXI |
| FTSE 100 | 10,831.09 | -0.43 | -0.00% | yfinance ^FTSE |
| SMI (Swiss) | 14,395.94 | +1.17 | +0.01% | yfinance ^SSMI |
European data reflects today's close (4 Sep).
Asia-Pacific
| Index | Level | Day Chg | Day Chg % | Source |
|---|---|---|---|---|
| Nikkei 225 | 65,020.94 | +806.46 | +1.26% | yfinance ^N225 |
| Hang Seng | 25,650.87 | +437.56 | +1.74% | yfinance ^HSI |
| Shanghai Comp | 3,930.12 | -11.97 | -0.30% | yfinance 000001.SS |
| ASX 200 | 9,005.90 | -14.20 | -0.16% | yfinance ^AXJO |
| Kospi (Korea) | 6,687.21 | +107.73 | +1.64% | yfinance ^KS11 |
Asia-Pacific data reflects today's close (4 Sep). Tokyo, Sydney and Seoul had all shut before the US payrolls report, so none of these levels reflect it.
Emerging Markets
| Index | Level | Day Chg % | Source |
|---|---|---|---|
| MSCI EM (EEM) | 68.70 | +1.82% | yfinance EEM |
| India Nifty 50 | 23,897.70 | +0.10% | yfinance ^NSEI |
| South Africa | 71.64 | -0.25% | yfinance EZA |
EEM and EZA are US-listed ETFs and now reflect the 4 Sep close. EZA reversed: it was up 0.19% at midday and settled down 0.25%.
A note on trend positioning, since the day changes alone do not convey it. The S&P 500 at 7,719 trades above both its 50-day (7,584) and 200-day (7,137) moving averages and sits in the top of a 52-week range of 6,317 to 7,817, so the uptrend is intact even after today. The divergences are in Asia. The Nikkei at 65,021 is below its 50-day average of 66,717 despite today's 1.26% gain, having given back a substantial part of the summer melt-up, and its 52-week range of 42,784 to 72,832 is the widest in the table by some distance. The Kospi is likewise below its 50-day (6,987). The Nifty 50 is the weakest structural picture: below both its 50-day (24,207) and its 200-day (24,617). India has been a persistent underperformer this year and today's 0.10% gain does not change that.
Index Valuations & Investment Risk
Valuation Table
| Index | Trailing P/E (live) | Hist avg trailing P/E (†) | Premium to midpoint |
|---|---|---|---|
| S&P 500 | 24.87x | ~16-18x | +46.3% |
| Nasdaq 100 | 29.24x | ~25-30x | +6.3% |
| Euro STOXX 600 | 17.93x | ~15-17x | +12.0% |
| CAC 40 | 16.98x | ~14-16x | +13.2% |
| DAX | 18.85x | ~15-17x | +17.8% |
| FTSE 100 | 18.21x | ~13-15x | +30.0% |
| Nikkei 225 | 21.90x | ~20-22x | +4.3% |
| MSCI EM | 14.57x | ~13-15x | +4.0% |
(†) Hist avg trailing P/E: static long-run reference constants, the only non-live figures in this
briefing. Live trailing P/E comes from the yfinance trailingPE field on ETF proxies (SPY, QQQ,
EXSA.DE, CAC.PA, EXS1.DE, ISF.L, 1321.T, EEM).
Two cells cross the 20% threshold. The S&P 500 at 24.87x is 46% above its long-run midpoint of roughly 17x, which puts it in the "historically stretched" band. The FTSE 100 at 18.21x is a more surprising entry: the UK index has spent most of the past decade as the cheap developed market, and at 30% above its own historical midpoint that description no longer fits. Note the Nasdaq 100 is the least extended index in the table relative to its own history, at +6.3%. That is not because it is cheap in absolute terms, but because a high multiple has always been normal for it, whereas 24.87x has not been normal for the S&P.
Investment Risk Assessment for ETF Investors
United States (S&P 500 / Nasdaq ETFs)
The earnings yield on SPY is (1÷24.87) = 4.02%. The settled 10-year Treasury yield is 4.78% (US Treasury par curve, 2026-09-04). The earnings yield gap is -0.76 pp: a ten-year Treasury currently offers three quarters of a point more income than the S&P 500's trailing earnings yield. On a real basis the comparison inverts, and the size of that correction is the interesting part. Against the 10-year TIPS real yield of 2.43%, the gap is +1.59 pp. The inflation correction is worth 2.35 pp and it flips the sign, which is a fair measure of how much the nominal version overstates the bond's advantage.
Read that as a description of today's trade-off, not a forecast. It says an investor can currently lock a 4.78% nominal coupon for a decade, or accept equity risk at a 4.02% trailing earnings yield that should grow roughly with nominal GDP. It does not say which will win. Two structural caveats belong with any weight placed on the number: the equity leg ignores growth entirely, and the equity holder does not receive the 4.02% as cash, only the dividend and buyback portion of it, with the remainder retained on the balance sheet.
The specific risks: concentration (the Nasdaq closing up 0.21% against the Dow's 0.51% fall is the same top-heavy market structure that has driven index returns all year, and the divergence widened into the close rather than narrowing), rate sensitivity at a 24.87x multiple with a real yield of 2.43%, and the fact that the Fed's next move is now more likely to be up than down. A 46% premium to historical valuation is not a problem while discount rates fall. It is a different proposition when they might rise.
Europe (STOXX 600 / CAC 40 / DAX ETFs)
The STOXX 600 earnings yield is (1÷17.93) = 5.58% against a euro area AAA 10-year of 3.36%, for a euro earnings yield gap of +2.21 pp. On the real-yield basis (see the Real Yields section below for how the euro real yield is built) it is 5.58% less 1.33%, or +4.25 pp.
The US and euro gaps differ by 2.97 pp on nominal yields and 2.66 pp on real ones. Part of that is simply the difference between the two currencies' inflation and policy paths rather than a difference in risk compensation, so the pair should always be quoted together. What the decomposition shows here, though, is that inflation is not the main story: correcting for it narrows the difference by only about 0.3 pp. Most of it is the combination of a genuinely cheaper European multiple (17.93x against 24.87x) and a materially lower real rate.
The European risks are political and they are currently concentrated in France. The CAC 40 is the only major European index below its 50-day moving average (8,279 against 8,456), and French ten-year borrowing costs at 4.21% now match or exceed Italy's. A euro-based investor holding euro-quoted European funds has no FX effect on the quoted value of the holding, but real currency exposure remains inside the earnings: CAC 40 and STOXX 600 constituents are multinationals earning a large share of revenue abroad. That exposure is smaller, slower and partly hedged by foreign cost bases, not absent.
Japan (Nikkei / TOPIX ETFs)
At 21.90x the Nikkei is the least stretched major developed index relative to its own history (+4.3%), and it is 10.7% below its record with the index trading under its 50-day average. The dominant variable is the BOJ. Policy sits at 1.00%, set in June and the highest since 1995, and the bank is reported to be leaning toward a further quarter point to 1.25% at the 17-18 September meeting. The 10-year JGB near 2.97% has already moved a long way. For a euro or dollar investor the currency decision is likely to matter more than the equity call: USD/JPY at 156.29 means an unhedged position carries a large yen exposure into a tightening cycle that would ordinarily support the currency.
Emerging Markets (MSCI EM ETFs)
EEM trades at 14.57x, a 41% discount to the S&P 500's multiple and only 4% above its own long-run midpoint, with an earnings yield of 6.87%. That is the cleanest valuation case in the table. The offsetting risks are the familiar ones: China weight, dollar strength when US rates rise, and political risk that does not show up in a P/E. EM has traded well recently, with EEM closing up 1.82% and 4.4% above its 50-day average.
Overall Risk Score: Moderate, with a US-specific caveat. Europe, Japan and EM offer fair to attractive relative valuation. The United States is the outlier: a 46% premium to historical valuation, a negative nominal earnings yield gap, and a central bank whose next move is more likely a hike than a cut is a combination that leaves a thin margin of safety.
Disclaimer: This is financial information, not personalised investment advice. Past valuations do not guarantee future returns. Consult a financial advisor before investing.
US Economic Indicators (FRED - authoritative)
| Indicator | Current | Prior | Delta | Reference Date | FRED Series |
|---|---|---|---|---|---|
| CPI YoY % | 3.30% | — | — | Jul 2026 | CPIAUCSL |
| Core CPI YoY % | 2.47% | — | — | Jul 2026 | CPILFESL |
| Unemployment Rate | 4.1% | — | — | Aug 2026 | UNRATE |
| Nonfarm Payrolls | +162k m/m | — | — | Aug 2026 | PAYEMS |
| 10Y TIPS Real Yield | 2.43% | — | — | 2026-09-04 | DFII10 |
Note: FRED macro data is monthly and lags 4-6 weeks; the reference month is shown. NFP is the month-over-month change. Total payrolls now stand at 159,075k. The real yield is quoted from the US Treasury real curve, which runs one business day ahead of FRED's own DFII10 series; the series ID column names the equivalent FRED series for reference.
Today's release deserves close reading, because the headline understates it. Yesterday's briefing reported July payrolls at a contraction of 23,000 and total payrolls of 158,858k. Today's total of 159,075k less the 162k August gain implies a July level of 158,913k, which means prior months were revised up by roughly 55,000. So the market did not merely get a strong August, it got a strong August plus the retraction of the single data point that had most supported the case for easing. That is why the hike odds moved as far as they did on a report that only beat by 107,000.
The inflation picture is unchanged and remains awkward. Headline CPI at 3.30% sits 84 bp above core at 2.47%, and with WTI settling at $91.48 and Brent at $96.28 that wedge is an energy story that is not going away on its own. Core is close enough to target to argue against tightening; headline is not. Next week's CPI is the swing factor.
Other economic releases today: German factory orders for July rose 2.5% month-on-month, following a 3.7% gain in June, a second consecutive strong month for the German industrial cycle that fits with the August manufacturing PMI at 54.1, its best in years. The euro area published July retail sales and the August construction PMI. Euro area manufacturing PMI for August, released earlier this week, came in at 52.7 against 51.9 in July, the strongest reading since May 2022. The European macro data is quietly improving, which is part of why the AAA curve has backed up 22 bp in a month alongside the fiscal story.
Fixed Income & Bond Analysis
Policy Rates
| Central Bank | Rate | Source |
|---|---|---|
| Fed Funds (upper) | 3.75% | FRED DFEDTARU (2026-09-04) |
| Fed Funds (lower) | 3.50% | FRED DFEDTARL (2026-09-04) |
| Effective FFR | 3.63% | FRED DFF (2026-09-02) |
| ECB Deposit Rate | 2.25% | FRED ECBDFR (2026-09-04) |
| BOJ Policy Rate | 1.00% | web search (set June 2026) |
| BOE Bank Rate | ~3.73% | FRED IUDSOIA, SONIA proxy (2026-09-02) |
Government Bond Yields
| Country | 2Y Yield | 10Y Yield | 30Y Yield | Day Chg (10Y) | Source |
|---|---|---|---|---|---|
| USA | 4.37% | 4.78% | 5.24% | +1.0 bp | US Treasury par curve (2026-09-04) |
| Germany | 2.89% | 3.36% | 3.77% | — | ECB AAA curve (2026-09-03) |
| France | — | 4.21% | — | — | web |
| UK | 4.00% | 5.16% | — | — | web |
| Japan | — | 2.97% | — | — | web (2026-09-03) |
| Italy | — | 4.19% | — | — | web |
All three US maturities and the day change share the settlement date 2026-09-04, computed against the prior session (2026-09-03), when the 10-year stood at 4.77%. The German row is the ECB AAA composite rather than literal Bunds, which is why it will differ from a Bund print by a basis point or two.
The table's real news is the France and Italy rows. France at 4.21% against Italy at 4.19% means the OAT-BTP spread has closed to roughly zero and, on some prints this week, inverted. For two decades the market treated French credit as unambiguously superior to Italian; after two governments fell over budgets in 2025 and a 2027 consolidation that still has no parliamentary majority behind it, it no longer does. The OAT-Bund spread against the AAA curve is about 85 bp, up from roughly 55 bp at the start of the year and the widest sustained level since the euro-area debt crisis. For a France-based reader this is the single most consequential number in the briefing: it is a direct tax on French government borrowing, and it feeds through to domestic credit conditions.
The UK is the other outlier: a 10-year gilt at 5.16% is 39 bp above the equivalent Treasury and 180 bp above the AAA euro curve. Japan's 10-year at 2.97% would have been unimaginable three years ago and is the clearest single measure of how far BOJ normalisation has run.
Yield Curve Spreads (US Treasury par curve, 2026-09-04):
- 10Y-2Y spread: +41 bp. Positive and upward-sloping, but not steep. The historical marker for a steep curve is roughly +75 bp or more, and flat is within about ±25 bp, so this sits in the ordinary middle. It has been positive all year.
- 10Y-3M spread: +87 bp. Comfortably positive. The recession signal that mattered in 2023 and 2024 has been absent for some time, and today's payrolls report does nothing to revive it.
One anomaly worth flagging. The 3-month bill at 3.91% sits 28.5 bp above the Fed funds target midpoint of 3.625%. On a normal day a 3-month bill trades within a few basis points of the midpoint. A gap of this size in this direction is the bill market pricing a meaningful probability that the target range is higher within three months, which corroborates the roughly 60% hike odds in fed funds futures from an entirely separate instrument.
OAT-Bund Spread: approximately 85 bp (French 10Y 4.21% less the AAA 10Y of 3.36%). See the discussion above; this is the key French fiscal risk indicator and it is at its widest sustained level since the euro crisis.
Yield Curve Charts
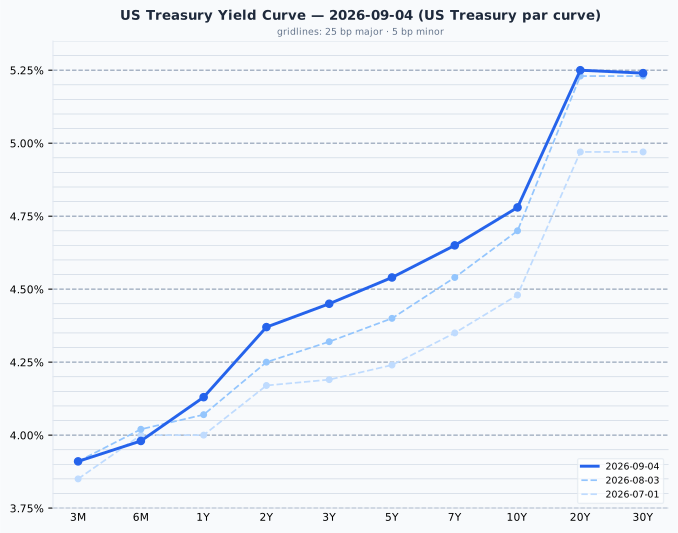
The US curve is upward-sloping across its full length with a pronounced kink at the long end: the 20-year at 5.25% and the 30-year at 5.24% sit 47 and 46 bp above the 10-year. Since a month ago the whole curve has shifted up, but the move is concentrated in the middle. The front end is flat to slightly lower (3M unchanged, 6M down 4 bp) and the long end has barely moved (20Y up 2 bp, 30Y up 1 bp), while the belly has done nearly all the work: the 2-year is up 12 bp, the 3-year 13 bp and the 5-year 14 bp, with the 10-year up 8 bp. That is the market pricing a policy path that stays higher for the next few years rather than adding term premium at the very long end, which is the signature of a hike repricing rather than a fiscal one.
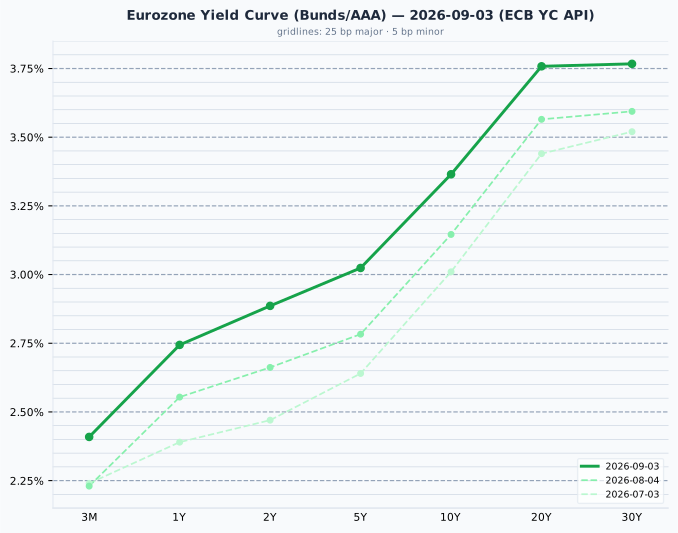
The euro curve is more steeply upward-sloping than the US one in relative terms, running from 2.41% at 3 months to 3.77% at 30 years, a 136 bp span. The shift since 4 August is larger and more uniform than the US move: the 3-month is up 18 bp, the 10-year up 22 bp and the 30-year up 17 bp. Against early July the 10-year is up 35 bp. Europe, not the United States, has driven the developed-market yield backup of the past two months, and it has done so with the ECB on hold at 2.25%.
Credit Markets (from FRED - authoritative)
| Market | OAS Spread | Series ID |
|---|---|---|
| US Investment Grade | 81 bp | BAMLC0A0CM |
| US High Yield | 265 bp | BAMLH0A0HYM2 |
| Euro High Yield | 265 bp | BAMLHE00EHYIOAS |
All three observed 2026-09-03. US investment grade at 81 bp sits at the very bottom of its 80-150 bp normal band. US high yield at 265 bp is below the 300-500 bp normal range, which puts it in historically tight territory rather than merely tight. Euro high yield matches it exactly at 265 bp.
The interpretation is straightforward and slightly uncomfortable. Credit is pricing no stress at all, in the same week that sovereign long ends sold off to fifteen-year highs, French fiscal risk repriced to the point of erasing the OAT-BTP spread, and the Fed hike probability climbed above 60%. Combined with a VIX of 14.32, the risk markets are expressing considerably more confidence than the rates markets are. That gap is not a prediction of anything, but it does mean there is very little spread cushion if the rates repricing continues.
Real Yields (US and Euro Area)
| Region | Nominal 10Y | Expected inflation | Real 10Y | How the real yield is obtained |
|---|---|---|---|---|
| United States | 4.78% | 2.35% (residual) | 2.43% | Measured. TIPS trade, so the market quotes a real yield directly; expected inflation is the residual, the breakeven |
| Euro area | 3.36% | 2.04% (measured) | 1.33% | Constructed. No euro inflation-linked benchmark is published, so a survey expectation is subtracted from the nominal yield |
US figures from the US Treasury par and real curves (2026-09-04). Euro nominal from the ECB AAA curve (2026-09-03); euro expected inflation from the ECB Survey of Professional Forecasters, 2026 Q3 round, long-term HICP point forecast (2.037%).
The two rows are built in opposite directions and only one of them is a market price. In the United States the real yield is what trades and expected inflation is inferred from it. In the euro area the expectation is surveyed and the real yield is the leftover. The euro figure is therefore the softer of the two and should be treated as such. Two mismatches follow from the construction: the US breakeven embeds an inflation risk premium that a survey does not, and the SPF horizon is five years against the bond's ten.
Decomposing the roughly 141 bp nominal gap between the two: 31 bp is expected inflation (2.35% against 2.04%) and 110 bp is real (2.43% against 1.33%). This is overwhelmingly a real-rate story, not an inflation story, and the split is very close to the one that held a month ago. It reflects higher US trend growth expectations, heavier US fiscal supply, and a Fed at 3.50-3.75% against an ECB at 2.25%.
The US-euro real rate gap is not an investment opportunity
The US real yield has exceeded the euro one continuously for more than a decade. It is a structural feature of the two economies, not a trade a euro-based reader can capture. Hedging the currency cancels it almost exactly, because the forward rate is set precisely to remove the interest differential; unhedged, it is a currency bet rather than a bond decision, and it should be evaluated as one. A real yield is real in its own currency: 2.43% means 2.43% above US inflation, which is not a real return for someone who spends euros. A gap of this size and persistence would have been arbitraged away long ago if it were capturable, and its survival is the evidence that it is compensation for risk borne by dollar investors.
Bond Portfolio Implications
At 4.78% on the US 10-year and 2.43% real, bonds are a genuinely competitive holding for the first time in this cycle, and the earnings yield gap of -0.76 pp says so in the plainest available terms: today, the Treasury pays more current income than the S&P 500's trailing earnings yield. In Europe the reverse holds, with the STOXX 600 earnings yield 2.21 pp above the AAA 10-year.
Neither number forecasts anything. The gap compares income available today using nothing but quoted prices, which is its virtue; it omits growth entirely, which is its limitation. Adding the bond yield to the earnings yield makes an equity forecast worse rather than better, because the bond leg imports long inflation-driven swings that swamp the signal. For the forward-looking valuation argument, lean on the earnings yield against its own history, which does carry predictive content.
On duration: a 100 bp rise in yields costs roughly 8-9% in price on a 10-year bond, and considerably more at 20 and 30 years where the curve is now 46 to 47 bp above the 10-year. Given that the front end is pinned by a Fed that may hike and the long end is absorbing supply nobody is buying, the risk is not symmetric across the curve. The 2-to-5 year part offers 4.37% to 4.54% with a fraction of the price risk, and in the current configuration that is where the yield is best paid for relative to the duration taken. Extending to 30 years buys 46 bp of extra yield for roughly triple the interest rate sensitivity.
Currencies & Commodities
Currencies:
| Pair | Rate | Source |
|---|---|---|
| EUR/USD | 1.1598 | FRED DEXUSEU (2026-08-28) |
| USD Index | 118.75 | FRED DTWEXBGS (2026-08-28) |
| USD/JPY | 156.29 | web search |
| GBP/USD | ~1.35 | web search |
| USD/CHF | 0.8063 | web search (2026-09-03) |
The two FRED series are a week stale: DEXUSEU and DTWEXBGS both last published 28 August, so neither reflects this week's bond moves or today's payrolls. Treat them as a reference point rather than a current quote. USD/JPY at 156.29 is the number to watch into the 17-18 September BOJ meeting, since a hike to 1.25% with the Fed also tightening would leave the differential roughly unchanged and the yen without obvious support.
Commodities:
| Commodity | Price | Day Chg % | Ticker | Source |
|---|---|---|---|---|
| Brent Crude | 96.28 | +0.80% | BZ=F | yfinance |
| WTI Crude | 91.48 | +0.20% | CL=F | yfinance |
| Gold ($/oz) | 4,476.60 | -1.39% | GC=F | yfinance |
| Silver ($/oz) | 66.748 | -1.41% | SI=F | yfinance |
| Copper ($/lb) | 6.6825 | +0.27% | HG=F | yfinance |
| Nat Gas ($/MMBtu) | 2.975 | +2.13% | NG=F | yfinance |
Prices are the 4 September settlements and day changes are settlement to settlement, against the 3 September settlement. Both crude benchmarks settled higher after trading lower at midday.
The precious metals are the story and they have been for months. Gold settled at $4,476.60, which is 19.9% below its all-time high of $5,586.20, set on 29 January 2026. Silver at $66.75 is 45.0% below its all-time high of $121.30, set the same day. Both settled lower again, and both fell further into the close than they had been at midday. The mechanism is not mysterious: both metals rallied through 2025 and into January on the expectation of a Federal Reserve easing cycle, and that cycle has not merely been delayed, it has been replaced by a hiking debate. A non-yielding asset priced off real rates does badly when the real 10-year sits at 2.43% and the risk to it is upward. Silver's fall is roughly double gold's because its industrial demand component adds a second exposure and because it carried more speculative positioning into the peak.
Copper is the opposite case and is the quiet outperformer. At a settlement of $6.6825 per pound it is 1.0% below its all-time high of $6.75, set on 26 August 2026, so it sits at or near record levels. The electrification and grid-investment thesis is doing what precious metals were supposed to do.
Crude is holding up, and it firmed into the settlement rather than fading. WTI settled at $91.48
(+0.20%) and Brent at $96.28 (+0.80%), both having been lower at midday, and both sit in the upper
part of their 52-week ranges, WTI having traded between $54.98 and $119.48 and Brent between $58.72
and $126.10 over the year. Note the WTI generic has rolled: CL=F points at CLV26.NYM, the
October contract, which is also the contract these settlements are struck on. Natural gas settled
2.13% higher at $2.975 but remains near the bottom of a 52-week range of $2.483 to $7.827.
Crypto: no moves above the 3% reporting threshold today.
Sector & Theme Highlights
Global bond market repricing is the dominant cross-market theme and it is not primarily American. Euro area AAA yields are up 22 bp in a month, UK 10-year gilts are at 5.16%, JGBs are near 3%, and the common thread is fiscal supply meeting an absence of central bank buyers. The US 10-year up 8 bp over the same month is the least dramatic move among the majors.
The precious metals unwind is a large move receiving relatively little coverage. Gold has given back its year's gains and silver has lost close to half its value from the January peak. Any portfolio that added a metals allocation as a rate-cut hedge in late 2025 is carrying that.
Copper and the electrification trade is the counterweight, at record highs while gold and silver fall, which is a clean separation of the industrial from the monetary metals.
European industrial recovery is quietly building: German factory orders up 2.5% after 3.7%, euro area manufacturing PMI at a four-year high of 52.7, German manufacturing at 54.1. This is a genuine improvement and is part of why euro yields have risen alongside the fiscal story rather than purely because of it.
French political risk has become a euro-area credit story rather than a domestic one, with the OAT trading at Italian levels and the CAC 40 the only major European index below its 50-day average.
Mega-cap resilience persists and strengthened into the close: the Nasdaq 100 finished up 0.21% against the Dow's 0.51% fall, having been marginally lower at midday. That is the same concentration that has driven index returns all year and the same concentration that constitutes the primary risk in a US index ETF.
Top Stories (Global)
-
US payrolls smash expectations. August nonfarm payrolls rose 162,000 against a consensus near 55,000, with unemployment steady at 4.1%. Prior months were revised up by roughly 55,000, erasing the July contraction that had anchored the easing case. September Fed hike odds moved from about 50% to roughly 60-62% on CME FedWatch.
-
Equities take strong data badly, but not evenly. The Dow closed down 272 points (-0.51%) and the S&P 500 0.38%, the classic good-news-is-bad-news response when the policy risk is a hike rather than a cut. The Nasdaq 100 broke ranks and closed up 0.21% after being lower at midday.
-
French fiscal risk has repriced, not resolved. The Lecornu government pushed the 2026 budget through under Article 49.3 and survived the resulting no-confidence votes, but the 2027 budget faces the same arithmetic ahead of the presidential election. French 10-year yields are at their highest since 2008 and the OAT-BTP spread has closed to approximately zero, a reversal of two decades of assumed hierarchy.
-
European sovereign yields at 15-year highs. The selloff is broad rather than French-specific, with UK gilts at 5.16% on the 10-year. Fiscal sustainability concerns are being priced globally, in economies with very different politics.
-
Gold erases its 2026 gains. Bullion settled 19.9% below its January record and silver 45.0% below its own, with both falling again as hike expectations build. The rate-cut trade of late 2025 has fully unwound.
-
The BOJ is leaning toward a hike to 1.25% at the 17-18 September meeting, per reporting this week. That would be the highest Japanese policy rate since 1995. The 10-year JGB is already near 2.97%.
-
Waller's dovish signal lasted one day. The Fed governor indicated Thursday he could support holding rates steady absent an inflation surprise, briefly cutting hike odds to around 50%. Friday's payrolls report reversed it within the hour.
Looking Ahead
Next 1-5 trading days:
-
Monday 7 September: US, Canadian and Brazilian markets closed for Labour Day. European and Asian markets trade normally, which typically means thin volumes and exaggerated moves in any European session news.
-
French budget politics, all week. The terms on which the 2027 budget can pass, and whether the government again has to reach for Article 49.3, remain the immediate driver of the OAT and of the CAC 40. This is the most market-relevant European thread of the week, though no single dated event anchors it.
-
US CPI, next week. Explicitly identified in market commentary as the swing factor for the 16 September FOMC. With headline at 3.30% and core at 2.47%, a headline print that fails to moderate would make a hike very difficult to argue against.
-
Wednesday 16 September: FOMC decision. Currently priced at roughly 60% for a 25 bp hike to 3.75-4.00%. Note that the 3-month bill at 3.89% is already trading as though this is more likely than not.
-
Thursday 17 to Friday 18 September: Bank of Japan. Reported to be leaning toward 1.25%. Watch USD/JPY at 156.29 into it.
-
ECB. On hold at a 2.25% deposit rate with euro area macro data improving and the AAA curve backing up regardless. The improving PMI picture reduces any near-term case for further easing.
Market closures in the next two weeks: Monday 7 September in the United States (Labour Day), Canada (Labour Day) and Brazil (Independence Day). No closures are listed for the United Kingdom, Germany, France, Japan, Australia, Switzerland, Korea or India in that window.