Global Financial Briefing — Tuesday, 18 August 2026
Americas index levels, commodities and day changes reflect the 18 August closing print; the US Treasury row, curve spreads and US yield curve chart carry the settled 18 August curve. FX and macro figures are dated inline.
Market Overview
A geopolitical supply shock has turned into a global duration shock. Iran's seizure of a UAE-owned tanker in the Strait of Hormuz, the lapse of the US–Iran ceasefire memorandum and President Trump's threat to strike Oman over its mediation efforts have put oil up for a third consecutive session and pushed long-dated government bond yields to levels not seen in decades. The 30-year Treasury touched 5.34% during the session — a fresh 19-year high — before easing back to settle at 5.28%, −3 bp on the day, with the 10-year settling at 4.71%, −1 bp (US Treasury par curve, 18 Aug). The day's move was a modest retracement of a much larger multi-week advance rather than a fresh leg. Fed Governor Waller's warning that a Hormuz closure would eventually pass through to core inflation is the clearest official articulation of why the long end is repricing: markets now put roughly 35% odds on a Fed hike in September and 68% by December — a policy path inverted from where it stood a quarter ago, and visible in the 3-month bill at 3.86% against a funds midpoint of 3.625%.
Equities absorbed the shock unevenly, and the split was almost purely a duration and
supply-chain story rather than a risk-off flight. Semiconductors were destroyed — the PHLX SOX
index closed down 4.98% at 11,992.46 (FRED NASDAQSOX) — taking the Nasdaq 100 down 1.68% while
the Dow lost only 0.22%, cushioned by energy and by defensives (staples, healthcare and REITs all
rallied). The same semiconductor complex explains the day's most violent move: the MSCI EM ETF
fell 2.94%, far more than any Asian cash index, because EEM's Taiwan and Korea weightings are
where the chip selloff lands once those markets are shut. Europe closed lower across the core
(STOXX 600 −0.69%, DAX −0.80%, CAC 40 −0.82%) while the FTSE 100 and the SMI eked out gains on
energy and defensive weighting. Japan was the worst major market, the Nikkei down 2.54% as the
10-year JGB reached about 2.95%, its highest since 1996.
Two things do not fit the standard risk-off template, and both are worth noting. First, gold fell 1.19% and silver 3.31% on a day of escalating war risk — precious metals are trading as long-duration assets against rising real yields and a firmer dollar, not as havens. Second, credit has barely noticed: US high yield sits at 270 bp and investment grade at 81 bp, both at the historically tight end of their ranges, and the VIX closed at 15.19 (17 Aug) with an intraday print near 15.7. A market pricing a possible Fed hike, a 19-year high in the long bond and a live shipping-lane conflict is simultaneously pricing almost no corporate default risk. That gap between rates volatility and credit complacency is the most notable feature of the current tape. Meanwhile the rate-sensitive real economy is already cracking: July housing starts collapsed 12.4% to a 1.239M annual rate against a 1.350M consensus.
Global Indices Snapshot
Americas
| Index | Level | Day Chg | Day Chg % | Source |
|---|---|---|---|---|
| S&P 500 | 7,691.76 | −53.30 | −0.69% | yfinance ^GSPC |
| Nasdaq 100 | 29,490.96 | −504.42 | −1.68% | yfinance ^NDX |
| Dow Jones | 53,343.40 | −116.38 | −0.22% | yfinance ^DJI |
| Brazil IBOV | 166,334.86 | −448.70 | −0.27% | yfinance ^BVSP |
Americas data reflects the 18 Aug close. The S&P 500 close is confirmed against FRED SP500
for 18 Aug, which reports the same 7,691.76. Note that Brazil reversed: the IBOV was up 0.06%
mid-afternoon and closed down 0.27%.
Europe
| Index | Level | Day Chg | Day Chg % | Source |
|---|---|---|---|---|
| Euro STOXX 600 | 651.90 | −4.51 | −0.69% | yfinance ^STOXX |
| Euro STOXX 50 | 6,468.17 | −62.28 | −0.95% | yfinance ^STOXX50E |
| CAC 40 | 8,509.36 | −70.24 | −0.82% | yfinance ^FCHI |
| DAX | 26,128.36 | −210.25 | −0.80% | yfinance ^GDAXI |
| FTSE 100 | 10,728.04 | +7.74 | +0.07% | yfinance ^FTSE |
| SMI (Swiss) | 14,320.90 | +18.51 | +0.13% | yfinance ^SSMI |
European data reflects today's close (18 Aug).
Asia-Pacific
| Index | Level | Day Chg | Day Chg % | Source |
|---|---|---|---|---|
| Nikkei 225 | 67,460.73 | −1,759.52 | −2.54% | yfinance ^N225 |
| Hang Seng | 25,471.15 | +17.92 | +0.07% | yfinance ^HSI |
| Shanghai Comp | 3,990.30 | +7.65 | +0.19% | yfinance 000001.SS |
| ASX 200 | 9,070.00 | −3.20 | −0.04% | yfinance ^AXJO |
| Kospi (Korea) | 6,869.83 | −108.11 | −1.55% | yfinance ^KS11 |
Asia-Pacific data reflects today's close (18 Aug).
Emerging Markets
| Index | Level | Day Chg % | Source |
|---|---|---|---|
| MSCI EM (EEM) | 65.34 | −2.94% | yfinance EEM |
| India Nifty 50 | 24,154.90 | −0.55% | yfinance ^NSEI |
| South Africa | 67.10 | −1.60% | yfinance EZA |
EEM and EZA now reflect the 18 Aug NYSE close; the Nifty reflects the 18 Aug close in Mumbai (15:31 IST). EEM's 2.94% fall is measured against its 17 Aug close of 67.32 and is genuine — it reflects the US-session repricing of Taiwanese and Korean semiconductors after those cash markets closed.
Positioning within ranges. None of the major indices is at a record today, but every developed index in the tables above remains above both its 50- and 200-day moving averages — the S&P 500 by 2.3% and 8.7% respectively, the STOXX 600 by 1.3% and 6.5%, the Nikkei by 0.3% and 16.5%. Today is a pullback inside an intact uptrend rather than a trend break. The exception is the Kospi, which sits 7.3% below its 50-day average while still 17.0% above its 200-day, having fallen sharply from its 52-week high of 9,385.59 (19 June) before a four-session rebound into mid-August. (Yahoo reports a 52-week low of exactly 0.0 for the Kospi, which is a data error and is omitted; the price history puts the true low at 3,079.27 on 20 Aug 2025.)
Index Valuations & Investment Risk
Valuation Table
| Index | Trailing P/E (live) | Hist avg trailing P/E (†) | Premium to hist avg |
|---|---|---|---|
| S&P 500 | 25.86x | ~16-18x | +52.1% |
| Nasdaq 100 | 30.66x | ~25-30x | +11.5% |
| Euro STOXX 600 | 17.97x | ~15-17x | +12.3% |
| CAC 40 | 17.44x | ~14-16x | +16.3% |
| DAX | 18.92x | ~15-17x | +18.2% |
| FTSE 100 | 18.00x | ~13-15x | +28.6% |
| Nikkei 225 | 22.70x | ~20-22x | +8.1% |
| MSCI EM | 16.93x | ~13-15x | +21.0% |
(†) Hist avg trailing P/E: static long-run reference constants — the only
non-live figures in this briefing. Premium computed against the midpoint of each range.
Trailing P/E is live from yfinance trailingPE on ETF proxies (SPY, QQQ, EXSA.DE, CAC.PA,
EXS1.DE, ISF.L, 1321.T, EEM).
Two observations. The S&P 500 at 52% above its long-run average is the outlier of the set and the only reading in "historically stretched" territory (>40%). More surprising is the FTSE 100 at 28.6% above its own average — a market whose entire investment case for a decade was its discount has re-rated to 18.0x, essentially level with the STOXX 600 and the DAX. The Nasdaq 100's premium is the smallest of the US pair, because its historical benchmark is already 25–30x; the concentration risk there shows up in earnings composition, not in the headline multiple.
Investment Risk Assessment for ETF Investors
United States (S&P 500 / Nasdaq ETFs)
The S&P 500 earnings yield is 3.87% (1÷25.86). Against the settled 10-year Treasury of 4.71% (US Treasury par curve, 18 Aug), the earnings yield gap is −0.84 pp: a Treasury pays more current income today than the index's earnings yield. Corrected onto a real basis against the 10-year TIPS yield of 2.41% (US Treasury real curve, 18 Aug), the gap is +1.46 pp. The size of that correction — 2.30 pp, the breakeven inflation rate — is the point worth noting, because it is larger than the gap itself and flips its sign. This is a snapshot of today's income trade-off, not a forecast of relative returns.
Risk factors are stacked in one direction at the moment: a real 10-year yield of 2.41% is a demanding discount rate for a 25.9x market, and the mechanism that hurt semiconductors today — long-duration cash flows discounted at a rising long rate — is the same one that would hurt the index broadly. Add index concentration in the AI complex (SOX −4.98% in a single session is the demonstration) and a Fed whose next move the market now thinks is more likely up than down. The index is 1.6% off its high, 2.3% above its 50-day and 8.7% above its 200-day average, so none of this is yet visible in the trend.
Europe (STOXX 600 / CAC 40 / DAX ETFs)
The STOXX 600 earnings yield is 5.57% (1÷17.97). Against the German 10-year Bund at 3.26%, the euro earnings yield gap is +2.31 pp; against the euro real 10-year of 1.21% (AAA nominal less long-term HICP expectations, ECB SPF 2026-Q3), +4.36 pp. For a France-based investor the more relevant pairing is the CAC 40's 5.73% earnings yield against the 10-year OAT at 4.12%, a gap of +1.61 pp — noticeably thinner than the STOXX comparison, because the French sovereign now carries a materially higher yield than the euro AAA composite.
Europe therefore looks better compensated than the US on this measure, at 17.97x against 25.86x — a 31% discount to the US multiple. But part of that difference is simply the gap between US and euro-area inflation and policy paths rather than a difference in risk compensation, which is why both the nominal and the real versions appear above.
The specific European risk today is fiscal, not valuation. The 10-year OAT rose about 5 bp to 4.12%, its highest since October 2008, with French public debt around 118% of GDP; the OAT-Bund spread is roughly 86 bp, and France now yields more than Italy (BTP 4.07%, 81 bp over Bunds). That reversal of the euro area's traditional risk ordering matters more to a French portfolio than the CAC's multiple does.
On currency: a EUR-based investor holding EUR-quoted European funds has no FX effect on the quoted value of the holding, but real FX exposure remains inside the earnings — CAC 40 and STOXX 600 constituents are multinationals earning abroad. The exposure is smaller and slower, not absent.
Japan (Nikkei / TOPIX ETFs)
The Nikkei's 22.70x is only 8.1% above its long-run average, the cheapest relative position in this table. The risk is policy, and it is live: the 10-year JGB at 2.94–2.95% is the highest since 1996, driven by expectations of a BOJ hike and by fiscal concerns over proposed consumption-tax cuts. The BOJ held at 1.00% on 31 July by an 8–1 vote, with Hajime Takata dissenting in favour of 1.25% — a dissenting board member is usually the last step before a move. For a EUR investor, a BOJ hike would tend to support the yen, which helps an unhedged position and hurts a hedged one, while simultaneously pressuring the index. Today's 2.54% drop is that trade-off in action.
Emerging Markets (MSCI EM ETFs)
At 16.93x, EM is 21% above its own long-run average and no longer offers the deep discount to developed markets that has historically justified its risks — the discount to the S&P is real (35%), the discount to Europe has essentially gone. Today's 2.94% fall shows the concentration problem plainly: MSCI EM is in practice a leveraged bet on Asian semiconductor earnings, with Chinese policy risk attached. The Hang Seng and Shanghai were both marginally positive in their own session, which underlines that the ETF's move was imported from Wall Street, not from Asia.
Overall Risk Score (qualitative, not financial advice):
- United States — high valuation risk / low margin of safety. 52% above its historical average with a negative nominal earnings yield gap and a rising real discount rate.
- Europe — moderate. Fair-to-slightly-rich multiples with a genuine income cushion over Bunds; the binding risk is French sovereign credit, not equity valuation.
- Japan — moderate, with policy risk as the dominant variable rather than price.
- Emerging markets — moderate to high, on a premium multiple with concentrated semiconductor exposure.
Disclaimer: This is financial information, not personalised investment advice. Past valuations do not guarantee future returns. Consult a financial advisor before investing.
US Economic Indicators (FRED — authoritative)
| Indicator | Current | Prior | Delta | Reference Date | FRED Series |
|---|---|---|---|---|---|
| CPI YoY % | 3.30% | — | — | Jul 2026 | CPIAUCSL |
| Core CPI YoY % | 2.47% | — | — | Jul 2026 | CPILFESL |
| Unemployment Rate | 4.1% | — | — | Jul 2026 | UNRATE |
| Nonfarm Payrolls | 158,858k | 158,881k | −23k | Jul 2026 | PAYEMS |
| 10Y TIPS Real Yield | 2.41% | — | — | 18 Aug 2026 | DFII10 † |
† DFII10 was overlaid from the US Treasury real curve for 18 Aug (sources: treasury_real),
a business day ahead of FRED's own series. Cite it as the Treasury real curve, not FRED.
Note: FRED macro data is monthly and lags 4–6 weeks. The July payrolls print is negative 23k — an outright contraction in employment — while headline CPI runs at 3.30% against core at 2.47%. That combination is the uncomfortable backdrop to an oil shock: the gap between headline and core is already energy, and the labour market is no longer generating jobs.
Other economic releases today (web search):
| Indicator | Actual | Consensus | Surprise |
|---|---|---|---|
| US Housing Starts (Jul, SAAR) | 1.239M, −12.4% m/m | 1.350M | Large miss |
| — single-family | 808k, −9.9% | — | — |
| — multifamily | −16.8% | — | — |
| US Import Prices (Jul, m/m) | −0.4% | — | Soft |
| US Export Prices (Jul, m/m) | −1.3% | — | Soft |
| US TIC — foreign Treasury holdings | −$72.1bn (Jun) | — | Largest fall since March's −$134.4bn |
| UK DMO 10Y gilt auction | £4bn at 5.156% | — | — |
The housing starts collapse and the TIC outflow are the two most consequential. The first says the long end is already biting the real economy; the second says foreign demand for Treasuries weakened in June, which is part of why the 30-year is at a 19-year high.
Fixed Income & Bond Analysis
Policy Rates
| Central Bank | Rate | Source |
|---|---|---|
| Fed Funds (upper) | 3.75% | FRED DFEDTARU (18 Aug 2026) |
| Fed Funds (lower) | 3.50% | FRED DFEDTARL (18 Aug 2026) |
| Effective FFR | 3.63% | FRED DFF (14 Aug 2026) |
| ECB Deposit Rate | 2.25% | FRED ECBDFR (18 Aug 2026) |
| BOJ Policy Rate | 1.00% | web search (BOJ MPM 31 Jul 2026, held 8–1) |
| BOE Bank Rate | ~3.73% | FRED IUDSOIA (SONIA proxy, 14 Aug 2026) |
Market pricing has inverted the usual question: roughly 35% odds of a Fed hike in September and 68% by December. The 3-month bill at 3.86% sits just under 24 bp above the funds midpoint of 3.625%, consistent with that pricing rather than with any cut.
Government Bond Yields
| Country | 2Y Yield | 10Y Yield | 30Y Yield | Day Chg (10Y) | Source |
|---|---|---|---|---|---|
| USA | 4.19% | 4.71% | 5.28% | −1.0 bp | US Treasury par curve (18 Aug 2026) |
| Germany | 2.84% | 3.26% | 3.77% | +3.7 bp | web (18 Aug) |
| France | 3.04% | 4.12% | 4.90% | +5.2 bp | web (18 Aug) |
| UK | 4.38% | 5.08% | 5.83% | −0.3 bp | web (18 Aug) |
| Japan | 1.69% | 2.94% | 4.14% | +1.3 bp | web (18 Aug) |
| Italy | 3.07% | 4.07% | 4.89% | +4.4 bp | web (18 Aug) |
The USA row is settled data throughout: all three maturities and the day change come from the US Treasury par curve for 18 Aug, measured against 17 Aug. It is now the same session the rest of this briefing describes — the 10-year eased 1 bp to 4.71% and the 30-year 3 bp to 5.28%, after the 30-year touched 5.34% intraday.
Milestones on this table: the Bund 10-year above 3.25% is its highest since March 2011; the OAT 10-year above 4.10% its highest since October 2008; the JGB 10-year at ~2.95% its highest since 1996; the UK 10-year its highest since 23 July. This is a synchronised global long-end repricing, not a US story with followers.
Yield Curve Spreads (recomputed from the Treasury par curve, 18 Aug 2026):
- 10Y−2Y spread: +52 bp — positively sloped and normal. Not inverted, and not steep either (steepness historically means >75 bp).
- 10Y−3M spread: +85 bp — no recession signal from the curve itself.
What the spreads understate is where the steepening is happening. From 10Y to 30Y the curve adds a further 57 bp, and the 20Y (5.28%) now trades level with the 30Y and 57 bp above the 10Y. The market is pricing term premium and supply at the very long end while keeping the front end anchored to a policy rate it thinks may rise — a shape driven by fiscal and inflation-risk concerns rather than by growth expectations.
OAT-Bund Spread: ~86 bp (4.12% − 3.26%, both 18 Aug), against roughly 69 bp in May. The French risk premium has widened by about 17 bp over the summer, and the OAT now trades above the Italian BTP (4.07%, 81 bp over Bunds). For a France-based investor this is the single most important number on the page: the market has stopped treating French sovereign debt as a core-euro asset.
Yield Curve Charts
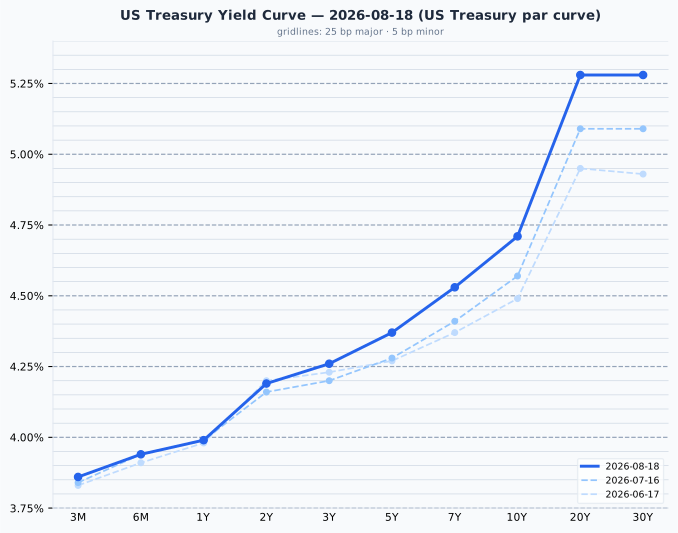
The US curve is upward-sloping throughout with a pronounced hinge after 10 years, where the 20Y and 30Y both sit 57 bp above the 10Y. Against a month ago (20 Jul), the whole curve has shifted up but not in parallel: the 3M is +2 bp while the 10Y is +14 bp and the 30Y +19 bp, a clean bear-steepening concentrated in the long end.
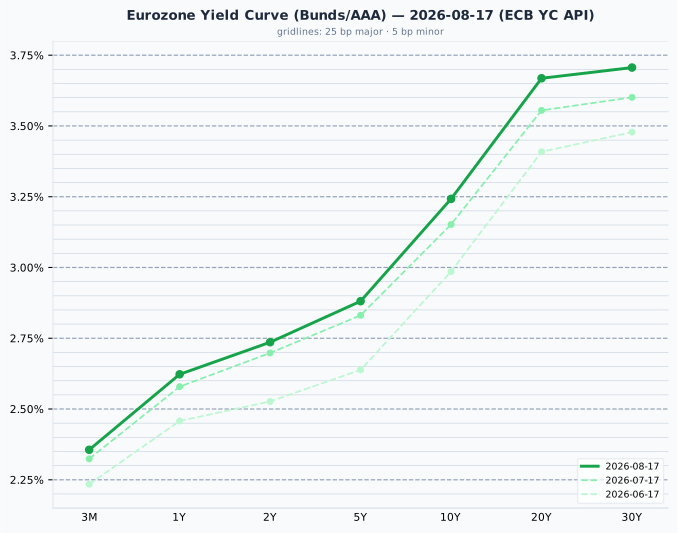
The euro AAA curve has the same upward slope but a much lower level, running from 2.36% at 3M to 3.71% at 30Y. Since 17 Jul it has risen roughly 3 bp at the short end and 9–11 bp from 10Y out — the same long-end-led move as the US, at about half the magnitude.
Credit Markets (FRED — authoritative, 17 Aug 2026)
| Market | OAS Spread | Series ID |
|---|---|---|
| US Investment Grade | 81 bp | BAMLC0A0CM |
| US High Yield | 270 bp | BAMLH0A0HYM2 |
| Euro High Yield | 253 bp | BAMLHE00EHYIOAS |
All three are at or below the bottom of their normal ranges — US HY at 270 bp is below the 300–500 bp normal band and therefore historically tight, and IG at 81 bp is at the very floor of its 80–150 bp range. Credit is priced for benign outcomes at the same moment rates markets are pricing a 19-year high in the long bond and a possible Fed hike. Either credit is right and the rates move is a term-premium story with no default consequence, or credit has not yet marked to the macro. The divergence itself is the signal to watch.
Real Yields (US and Euro Area)
| Region | Nominal 10Y | Expected inflation | Real 10Y | How the real yield is obtained |
|---|---|---|---|---|
| United States | 4.71% | 2.30% (nominal − real, residual) | 2.41% | Measured. TIPS trade, so the market quotes a real yield directly; expected inflation is the residual (the breakeven) |
| Euro area | 3.24% (AAA) | 2.04% (ECB SPF, measured) | 1.21% | Constructed. No euro inflation-linked benchmark is published, so a survey expectation is subtracted from the nominal yield |
The two rows are built in opposite directions. Only the US real yield is a market price that someone actually trades; the euro figure is a nominal yield minus a survey, so treat it as the softer of the two. Two mismatches follow from that and should be stated whenever the pair is compared: the US breakeven embeds an inflation risk premium that a survey does not, and the SPF horizon is 5 calendar years against the bond's 10.
Decomposing the gap. The 147 bp nominal gap between the US 10-year (4.71%) and the euro AAA 10-year (3.24%) splits into just 26 bp of expected-inflation difference (2.30% vs 2.04%) and 120 bp of real rate difference (2.41% vs 1.21%). As in previous weeks, this is overwhelmingly a real-rate story, not an inflation story — the US pays materially more in real terms, and that has not changed even as an oil shock lifted both regions' nominal yields.
The US–euro real rate gap is not an investment opportunity
The US real yield has exceeded the euro one in every quarter since 2014. It is a structural feature — higher US trend growth, euro-area excess savings, Bund scarcity, US fiscal supply — not a trade a EUR-based reader can capture. Hedging the currency cancels it almost exactly, because the forward rate is set to remove the interest differential; unhedged, buying Treasuries for the real yield is a dollar bet rather than a bond decision. A real yield is real in its own currency: 2.41% means 2.41% above US inflation, which is not a real return for someone who spends euros. Read the 120 bp as a statement about relative policy stance and growth expectations, and draw no portfolio conclusion from it.
Bond Portfolio Implications
On today's numbers, US bonds win the pure income comparison and European equities win it. The S&P 500's earnings yield of 3.87% is 84 bp below the 10-year Treasury at 4.71% — an investor can lock the Treasury coupon and give up nothing in current yield. The STOXX 600's 5.57% earnings yield sits 231 bp above the Bund's 3.26%, so the same comparison in Europe favours equities comfortably. On a real basis both gaps widen in equities' favour (US +1.46 pp against a 2.41% TIPS yield; euro +4.36 pp against a 1.21% constructed real yield), and the size of that swing — 2.30 pp for the US — is the honest measure of how much the choice of nominal versus real basis matters here.
Two structural caveats apply whenever this comparison carries weight. First, it ignores growth: a bond coupon is fixed for a decade while the earnings behind the equity yield grow roughly with inflation, which is precisely what the real-yield version corrects for. Second, an equity holder does not receive the full earnings yield — only the dividend and buyback portion arrives as cash, and the rest is retained. Neither the nominal nor the real gap forecasts which asset will outperform; for the forward-looking argument, earnings yield versus its own history is the measure with predictive content.
Duration risk is the live issue. With the 30-year settling at 5.28% after touching 5.34% intraday, a further 100 bp rise would cost roughly 8–9% on a 10-year bond and considerably more at the long end. The curve is paying 52 bp to go from 2 years to 10 and another 57 bp to go from 10 to 30 — in an environment where an oil shock is feeding inflation risk, foreign Treasury holdings fell $72bn in June and the market prices possible hikes, that long-end compensation still looks thin relative to the risk of being wrong. The 2-year at 4.19% captures most of the available yield with a fraction of the duration exposure.
Currencies & Commodities
Currencies:
| Pair | Rate | Source |
|---|---|---|
| EUR/USD | 1.1581 | FRED DEXUSEU (14 Aug) |
| USD Index (broad) | 118.90 | FRED DTWEXBGS (14 Aug) |
| USD/JPY | 159.53 | web search (18 Aug) |
| GBP/USD | 1.3548 | web search (18 Aug) |
| USD/CHF | ~0.812 | web search (approximate — a firm 18 Aug quote was not confirmed) |
EUR/USD was quoted near 1.158 intraday today, essentially unchanged from the FRED reading, and the DXY was around 99.6 (+0.06%). A yen at 159.5 with the 10-year JGB at a 30-year high is the tension underlying Japanese policy: yield differentials have narrowed materially, yet the currency has not re-rated.
Commodities (front-month futures):
| Commodity | Price | Day Chg % | Ticker | Source |
|---|---|---|---|---|
| Brent Crude | $91.02 | +0.17% | BZ=F | yfinance |
| WTI Crude | $84.06 | +0.38% | CL=F | yfinance |
| Gold ($/oz) | $4,420.60 | −1.19% | GC=F | yfinance |
| Silver ($/oz) | $64.04 | −3.31% | SI=F | yfinance |
| Copper ($/lb) | $6.4925 | −1.87% | HG=F | yfinance |
| Nat Gas ($/MMBtu) | $2.776 | +3.20% | NG=F | yfinance |
Prices are the 18 Aug settlements, and day changes are settlement-to-settlement against 17 Aug — the market convention for a completed session. The front-month contract is the same in all six cases; no roll intervened.
Note on the WTI contract. CL=F now points at CLV26.NYM, the October contract: the
generic has just rolled off September. Yahoo's expireDate field still reports 20 August,
which is September's expiry, so the apparent "expires in two days" is the field lagging the
roll rather than an imminent second roll. The practical consequence is that the $84.06 quoted
here is October WTI, while press reports citing WTI "around $85" are quoting the expiring
September contract — the roughly $1 difference is the backwardation the supply scare has put
into the front of the curve, not a discrepancy.
Energy. Crude settled up for a third consecutive session on the Hormuz escalation, though the day's gains were marginal compared with Monday's move; Brent trades in a 52-week range of $58.72 to $126.10 and WTI in a range of $54.98 to $119.48, so both sit in the middle of the past year rather than at extremes. Natural gas is the clean counterexample: up 3.20% but at $2.776 it remains near the bottom of its 52-week range of $2.483–$7.827, because Henry Hub is a domestic US market that a Strait of Hormuz disruption barely touches. Anyone reading the oil bid as a general energy shock should look at that divergence.
Precious and industrial metals. Gold settled at $4,420.60, 20.9% below its all-time high of $5,586.20 set on 29 January 2026, and silver at $64.04 is 47.2% below its all-time high of $121.30 from the same date — the January blow-off in the metals complex has not been recovered and both fell again, gold −1.19% and silver −3.31%. Metals are behaving as long-duration assets priced off real yields, not as war hedges; with the US real 10-year at 2.41% and the dollar firm, that is coherent even against escalating geopolitical risk, but it is the opposite of what a haven narrative would predict. Copper at $6.4925 is slightly below its all-time high of $6.728, set on 6 August 2026 — down 1.87% on the day but still within 4% of a record made two weeks ago, and the one metal whose price is not being driven by the financial channel.
Crypto: no moves above the 3% threshold were retrieved (not retrieved).
Sector & Theme Highlights
Worst: semiconductors, decisively — the PHLX SOX index closed down 4.98% at 11,992.46. Individual names in the AI supply chain took heavy losses (Fabrinet −18%), and the damage transmitted straight into the EM ETF via Taiwan and Korea. Best: energy, on the crude bid, with defensives (consumer staples, healthcare, REITs) rallying as the classic duration-and-safety rotation played out inside a down tape.
Three themes are worth carrying forward:
- The Hormuz premium is now a rates story, not just an oil story. Shipping volumes through the Strait have fallen sharply and the market is pricing the inflation consequence into the long end of every developed curve simultaneously. Waller's comment that sustained high oil would eventually reach core inflation is the transmission mechanism stated by a sitting governor.
- AI capex faces its first genuine discount-rate test. The complex has been priced on long-dated earnings; a 19-year high in the 30-year and a possible hike are exactly the conditions under which that duration bites. A 4.98% single-session fall in the SOX with no company-specific news is the market re-weighting the discount rate, not the thesis.
- European fiscal divergence has crossed a symbolic line. France paying more than Italy to borrow for ten years inverts the euro area's post-crisis credit hierarchy, and it is happening through OAT weakness rather than BTP strength.
Top Stories (Global)
- Iran seizes a UAE-owned tanker in the Strait of Hormuz and transit volumes through the Strait fall sharply, with further reports of an attack on a ship near Oman. This is the proximate cause of nearly everything else on today's tape.
- The US–Iran ceasefire memorandum lapses and President Trump threatens to strike Oman over its mediation with Tehran, extinguishing hopes of imminent de-escalation and putting crude up for a third straight session.
- The 30-year Treasury yield touches 5.34%, a fresh 19-year high, before settling at 5.28%, 3 bp lower on the day; the 10-year traded above 4.74% and settled at 4.71%, 1 bp lower.
- Semiconductors slump, SOX −4.98% to a close of 11,992.46, dragging the Nasdaq 100 down 1.68% and the MSCI EM ETF down 2.94% while the Dow lost only 0.22%.
- The 10-year JGB reaches about 2.95%, its highest since 1996, on BOJ hike expectations and fiscal concern over proposed consumption-tax cuts; the Nikkei fell 2.54%. The BOJ held at 1.00% on 31 July by 8–1, with Takata dissenting for a hike.
- The French 10-year OAT rises above 4.10%, its highest since October 2008, taking the OAT-Bund spread to about 86 bp and pushing France above Italy in yield. Bunds at 3.26% are at their highest since March 2011.
- Fed Governor Waller warns a Hormuz closure could worsen inflation and that sustained high oil prices would eventually transmit to core; markets now price ~35% odds of a September hike and ~68% by December.
- US July housing starts collapse 12.4% to a 1.239M annual rate, far below the 1.350M consensus, with single-family down 9.9% — the rate-sensitive economy already responding to the long-end selloff. Separately, foreign holdings of Treasuries fell $72.1bn in June, the largest monthly decline since March.
Looking Ahead
Next 1–5 trading days (19–25 August):
- Geopolitics is the calendar. With the ceasefire memorandum lapsed, any Hormuz development — a further seizure, a strike on Oman, or a de-escalation signal — moves oil, the long end and the AI complex together. This is the dominant scheduled-and-unscheduled risk.
- September WTI expiry, 20 August. The generic has already rolled to October, so the quoted benchmark will not jump, but the expiry of a backwardated front contract during a supply scare is worth watching for physical-market signals.
- BOJ commentary. With the 10-year JGB at a 30-year high and a dissenting board member on record for 1.25%, any speech or leak on the timing of the next hike is market-moving for both the yen and the Nikkei.
- US long-end supply and Fed speakers. After a 19-year high in the 30-year and June's $72bn TIC outflow, auction demand and any follow-up to Waller's inflation comments carry more weight than usual.
- French fiscal news flow. With the OAT above the BTP, any budget or rating commentary lands on an already-repriced curve.
Market closures (from the Nager.Date holiday calendar):
- No closures in any covered market over the next five trading days (19–25 August).
- Next scheduled closure: United Kingdom, Monday 31 August — Summer Bank Holiday.
- Then United States and Canada, Monday 7 September — Labour Day — and Brazil, Monday 7 September — Independence Day.
- India could not be checked: Nager.Date returns HTTP 204 (no content) for IN 2026, so the holiday calendar has no Indian entries. Treat any Indian closure in this window as unverified rather than absent.
Special Analysis: The 30-Year Treasury at Its Highest Since 2007
Added 19 August. This section is triggered by the 30-year Treasury yield touching 5.34% on
17 August — its highest level since July 2007 — before settling at 5.28% on 18 August. It asks
what that record actually means, when the repricing behind it happened, and what kind of
forecast (if any) it encodes. All yields are from the FRED daily constant-maturity series
(DGS2, DGS10, DGS30, DFII10, DFII30, T5YIFR); the 18 August figures are the settled
US Treasury par curve. A basis point (bp) is one hundredth of a percentage point.
The record is about a level, not a move
On the day the 30-year set its 19-year high, it fell: the 5.34% print was intraday, and the bond settled at 5.28%, 3 bp lower than the previous close. Nor is there any sudden move in the recent windows:
| Window | 2Y | 5Y | 10Y | 20Y | 30Y |
|---|---|---|---|---|---|
| Past month (17 Jul → 18 Aug) | +1 bp | +10 bp | +16 bp | +21 bp | +22 bp |
| Past 10 sessions (4 → 18 Aug) | −1 bp | +5 bp | +8 bp | +10 bp | +10 bp |
| Past 5 sessions (11 → 18 Aug) | −3 bp | −1 bp | +1 bp | +3 bp | +4 bp |
| Last session (17 → 18 Aug) | 0 bp | 0 bp | −1 bp | −2 bp | −3 bp |
Over the past five sessions the 30-year rose 4 bp. The record was crossed because a year-old repricing left the yield sitting just below it, and five weeks of drift carried it over the line. The headline announces an anniversary, not an event.
Note also the shape of the month column: the move grows steadily with maturity, from +1 bp at 2 years to +22 bp at 30. A selloff that scales with maturity is the signature of investors demanding more compensation for holding interest-rate risk, not of a changed economic forecast. A forecast about growth or Fed policy would move the 2- and 5-year most, because that is where the policy path lives — and the 2-year moved 1 bp.
The steepening is a 2025 event that has held
The gap between the 30-year and 10-year yields (the "10s30s spread" — the extra yield for lending an additional 20 years) tells the story. Yearly averages of the FRED daily series:
| Year | Average | Range | December |
|---|---|---|---|
| 2018 | 20 bp | 12–30 | 27 |
| 2019 | 44 bp | 33–51 | 44 |
| 2020 | 67 bp | 46–78 | 74 |
| 2021 | 61 bp | 38–78 | 38 |
| 2022 | 16 bp | 4–34 | 4 |
| 2023 | 13 bp | 5–29 | 12 |
| 2024 | 20 bp | 12–32 | 19 |
| 2025 | 48 bp | 22–66 | 66 |
| 2026 (Jan–Jul) | 57 bp | 48–63 | — |
From 19 bp in December 2024 to 66 bp in December 2025, widening essentially without interruption; through 2026 it has oscillated between 48 and 63 bp and sits at 57 bp on the 18 August curve. The entire repricing happened in calendar 2025. (The 2020–21 spreads were similar in size but opposite in nature: the front end was pinned at zero by policy, and the 30-year yielded under 2%. Same slope, different mechanism.)
2025: the Fed cut 82 bp and the long bond rose anyway
The cleanest way to see what 2025 did (monthly averages):
| Dec 2024 → Dec 2025 | Change | |
|---|---|---|
| Fed target (upper limit) | 4.65% → 3.83% | −82 bp |
| 2-year | 4.23% → 3.50% | −73 bp |
| 10-year | 4.39% → 4.14% | −25 bp |
| 30-year | 4.58% → 4.80% | +22 bp |
The 2-year tracked the policy rate almost exactly. The 30-year went the opposite way — a 104 bp divergence between the policy rate and the long bond in one year. A long yield is approximately the average short-term rate investors expect over the bond's life, plus a margin for the risk of holding something that far out. That margin is called the term premium. When the expected-rates part falls (the Fed cutting) and the yield still rises, the term premium is what grew. 2025 was the year the market rebuilt it.
It was not an inflation forecast
The US Treasury issues both ordinary bonds and TIPS (Treasury Inflation-Protected Securities), whose principal is indexed to inflation. The gap between the two yields — the breakeven — is the inflation rate that would make them pay the same, i.e. the market's priced-in inflation expectation. Splitting the 2025 move:
| Dec 2024 → Dec 2025 | Change |
|---|---|
| 10s30s spread, ordinary bonds | +47 bp |
| 10s30s spread, TIPS (inflation-protected) | +46 bp |
| 30-year breakeven (implied inflation) | −5 bp |
Forty-six of the forty-seven basis points are real — and long-run inflation expectations
actually fell while the long bond sold off. The forward-looking check agrees: expected
inflation for the five years starting five years from now (T5YIFR) stands at 2.33%
(18 Aug), which after the usual ~0.3 pp gap between CPI and the Fed's preferred PCE measure
is consistent with the 2% target. Whatever the long end is charging for, it is not higher
expected inflation.
What actually happened, and when: April–May 2025
The repricing concentrated in two months, and the catalysts are datable:
- 2 April 2025 — sweeping tariff announcement. Within six sessions the 10-year jumped from under 4.00% to 4.50% intraday while the dollar fell — an unusual pairing. Yields up with the currency down means foreign investors stepping away from Treasuries, not a growth or inflation repricing. Contemporary reporting identified Japanese life insurers and European and Japanese pension funds as the sellers.
- 16 May 2025 — Moody's, the last major agency still rating the US triple-A (since 1917), downgraded it to Aa1, projecting federal debt at 134% of GDP by 2035 on deficits near 7% of GDP.
- 21 May 2025 — a $16bn 20-year auction drew bids for only 2.46 times the amount on offer (the weakest cover since February) and cleared at 5.047%, then the highest since 2023.
- 22 May 2025 — the House passed a tax-and-spending bill scored at $3–5tn of added debt over a decade.
- Same week — Japan's own 30- and 40-year government bond yields hit record highs on failed auctions. This matters because Japanese life insurers are among the world's few large buyers of very long bonds: stress in their home market cut their capacity to absorb US duration at exactly the moment more of it needed absorbing.
The mechanism common to all five: long bonds must sit on someone's balance sheet until they
mature, and the natural holders (pension funds and insurers matching liabilities decades out)
buy according to the size of those liabilities, not the yield on offer. Their demand does not
expand and therefore yields rise. Meanwhile the Federal Reserve, formerly the largest price-insensitive
holder, has been shrinking its bond portfolio since 2022 by letting holdings mature
("quantitative tightening"), returning that risk to private hands. In addition, every large
government, plus investment-grade corporates funding AI infrastructure, issue into the same
limited pool. When supply meets a buyer base that cannot stretch, the price falls until the
yield tempts someone new. That is a story about quantities and risk-bearing capacity, not
about the economic outlook — which is why it moved TIPS yields, why it hit
harder longer maturities, and why it happened in the US, Japan and the euro
area simultaneously despite three unrelated business cycles.
2026 has been a different story: the front end is the mover
| Dec 2025 → Jul 2026 | Change |
|---|---|
| 2-year | +72 bp |
| 10-year | +46 bp |
| 30-year | +30 bp |
| 10s30s spread | 66 → 50 bp |
This year the short end has risen fastest — the market repricing the Fed from cutting to possibly hiking (now ~35% odds for September, ~68% by December) as the Hormuz oil shock met Waller's warning on core inflation. The 10s30s spread has actually narrowed in 2026. August added roughly 6 bp of long-end steepening spread across five weeks — noise. So the accurate reading of the 19-year high: the long end sits at a historically high level because of the 2025 term-premium repricing, while the thing genuinely moving in 2026 is the front end.
What would change the assessment
- Expected long-run inflation breaking higher. The five-year-forward figure at 2.33% is the anchor of the benign interpretation. A sustained break above roughly 2.5% would convert this from a story about risk compensation into one about the Fed's target losing credibility — a materially worse regime for both bonds and equities.
- Long-end auctions. The supply mechanism shows itself at auctions: demand below the recent average (bids under ~2.4× the amount offered) or a clearing yield notably above pre-auction trading ("tailing") would signal the buyer base straining again. The next refunding announcement — the Treasury's quarterly statement of how much it will borrow at which maturities — is the scheduled catalyst.
- The 5-year dragging upward. If the belief in structurally higher rates rolls down the curve from the 2040s toward the present, the 5-year will start rising with the 30-year rather than sitting with the 2-year. That would mark the shift from a term-premium story to a policy-path story.
The practical summary: the market is not paying 5.3% on the 30-year because it expects short rates that high. It is paying it because fewer balance sheets are willing and able to hold 30-year risk, and the ones that remain are charging more for it. For an investor, that is an argument about compensation for risk — the extra yield is real, but it exists precisely because the asset has become more volatile and less reliably a hedge — rather than a forecast of where interest rates are going.