Global Financial Briefing — Monday, 17 August 2026
Americas index levels, US-listed ETFs, commodities and day changes reflect the 17 August closing print, and US Treasury yields the settled 17 August curve. European and Asian figures, FX and macro are dated inline.
Market Overview
The day belongs to the long end of the US curve. The 30-year Treasury settled at 5.31% and the 20-year at 5.30% (US Treasury par curve, 2026-08-17), the 30-year at its highest level since 2007, with the iShares 20+ Year Treasury Bond ETF marking its weakest close in more than two decades. The move was concentrated at the back: +6 bps on the 30-year and +5 bps on the 20-year against +4 bps at the 10-year and +2 bps at the 2-year. That is a term-premium story rather than a policy story — the 3-month bill sits at 3.87% against a Fed Funds target midpoint of 3.625%, so the curve is steepening from the back rather than repricing the Fed. The 10Y–2Y spread is +53 bps and the 10Y–3M +85 bps (US Treasury par curve, 2026-08-17) — positively sloped, no recession signal, but the 59 bps between the 10-year and the 30-year is where the pressure is concentrated.
Equity markets split cleanly by geography. Asia was the day's clear winner: Hong Kong +1.34%, Shanghai +1.41% and the Nikkei +0.74%, with mainland and Hong Kong strength dragging emerging market proxies up with it (EEM +1.07%). Europe was uniformly lower and led down by the CAC 40 (−0.66%) and the SMI (−0.61%). The US sold off into the close and finished broadly lower: the S&P 500 −0.52%, the Dow −0.51% and the Nasdaq 100 −0.17%. The Nasdaq's reversal is the story of the session — it had been up +0.10% at midday on a chip and AI-infrastructure rally, with Anthropic's $11.5bn second-quarter revenue print read as confirmation that datacentre capital expenditure holds, and gave the whole of that back and more in the afternoon. The three major indices finishing within 35 bps of each other, all negative, describes a broad de-rating rather than the narrow handful-of-names tape the midday prints suggested.
The cross-current is geopolitical. Renewed Middle East violence and continued US–Iran tension put a bid under crude that strengthened materially into the close: Brent finished +2.65% at $90.87 and WTI +2.55% at $84.50, roughly three times the gains visible at midday. Precious metals went the other way, giving back part of their intraday advance to close at +0.82% for gold and +1.72% for silver, while capping equity upside. Volatility, however, is not reflecting any of this: the VIX closed at 14.25 (FRED VIXCLS, 2026-08-14), a low reading that signals complacency rather than moderate concern, and credit is tighter still — US high yield at 267 bps and investment grade at 80 bps are both at or below the bottom of their long-run normal ranges. Rates are pricing risk; credit and volatility are not.
Global Indices Snapshot
Americas
| Index | Level | Day Chg | Day Chg % | Source |
|---|---|---|---|---|
| S&P 500 | 7,745.06 | −40.70 | −0.52% | yfinance ^GSPC |
| Nasdaq 100 | 29,995.38 | −50.76 | −0.17% | yfinance ^NDX |
| Dow Jones | 53,459.78 | −272.62 | −0.51% | yfinance ^DJI |
| Brazil IBOV | 166,783.56 | −150.64 | −0.09% | yfinance ^BVSP |
Americas data reflects the 17 Aug close.
Cross-check: FRED SP500 reports the S&P 500's 17 August close at 7,745.06, matching the yfinance close to the cent.
The S&P 500 is 0.65% below its 52-week high of 7,816.70 and holds above both its 50-day (7,512) and 200-day (7,075) moving averages. Brazil is the outlier in the region — the IBOV sits 16.5% below its 52-week high of 199,355 and trades below both its 50-day and 200-day averages, the only major Western index in a confirmed downtrend.
Europe
| Index | Level | Day Chg | Day Chg % | Source |
|---|---|---|---|---|
| Euro STOXX 600 | 656.41 | −1.45 | −0.22% | yfinance ^STOXX |
| Euro STOXX 50 | 6,530.45 | −9.14 | −0.14% | yfinance ^STOXX50E |
| CAC 40 | 8,579.60 | −57.19 | −0.66% | yfinance ^FCHI |
| DAX | 26,338.61 | −101.70 | −0.38% | yfinance ^GDAXI |
| FTSE 100 | 10,720.30 | −29.81 | −0.28% | yfinance ^FTSE |
| SMI (Swiss) | 14,302.39 | −88.28 | −0.61% | yfinance ^SSMI |
European data reflects today's close (17 Aug).
A broad, orderly decline rather than a rout — no index fell more than 0.7%, and every one of them remains above both its 50-day and 200-day moving averages. The STOXX 600 is 1.1% below its 52-week high, the DAX 0.9% below its own. For a France-based reader the CAC 40's underperformance is worth noting: at 2.0% below its 52-week high it has given back more than the German and pan-European benchmarks on the day, though the gap is small enough to be noise rather than a trend at this stage.
Asia-Pacific
| Index | Level | Day Chg | Day Chg % | Source |
|---|---|---|---|---|
| Nikkei 225 | 69,220.25 | +506.45 | +0.74% | yfinance ^N225 |
| Hang Seng | 25,453.23 | +336.38 | +1.34% | yfinance ^HSI |
| Shanghai Comp | 3,982.65 | +55.48 | +1.41% | yfinance 000001.SS |
| ASX 200 | 9,073.20 | −42.00 | −0.46% | yfinance ^AXJO |
| Kospi (Korea) † | 6,977.94 | — | — | yfinance ^KS11 |
Asia-Pacific data reflects today's close (17 Aug). † Kospi: 17 August is Liberation Day (observed) in South Korea — market closed today. Level is the 14 August close.
Greater China led the region. Both the Hang Seng and the Shanghai Composite closed above their 50-day averages but remain below their 200-day averages — a rally within a longer downtrend, not yet a reversal. The Nikkei is 5.0% below its 52-week high of 72,832 but comfortably above both moving averages.
The Kospi deserves a flag even though it did not trade today: at 6,977.94 it sits 25.7% below its 52-week high of 9,385.59 and has fallen below its 50-day average, by a wide margin the deepest drawdown among the major Asian benchmarks.
Emerging Markets
| Index | Level | Day Chg % | Source |
|---|---|---|---|
| MSCI EM (EEM) | 67.32 | +1.07% | yfinance EEM |
| India Nifty 50 | 24,287.65 | −0.32% | yfinance ^NSEI |
| South Africa | 68.19 | +0.98% | yfinance EZA |
EEM and EZA are US-listed ETFs — 17 Aug close.
EM broadly followed China higher. India is the exception, down on the day and trading below its 200-day average, 7.9% off its 52-week high.
Index Valuations & Investment Risk
Valuation Table
| Index | Trailing P/E (live) | Hist avg trailing P/E (†) | Premium to hist avg |
|---|---|---|---|
| S&P 500 | 26.09x | ~16-18x | +53.5% |
| Nasdaq 100 | 31.29x | ~25-30x | +13.8% |
| Euro STOXX 600 | 18.10x | ~15-17x | +13.1% |
| CAC 40 | 17.59x | ~14-16x | +17.3% |
| DAX | 19.06x | ~15-17x | +19.2% |
| FTSE 100 | 17.98x | ~13-15x | +28.4% |
| Nikkei 225 | 23.30x | ~20-22x | +11.0% |
| MSCI EM | 17.56x | ~13-15x | +25.4% |
(†) Hist avg trailing P/E: static long-run reference constants — the only
non-live figures in this briefing. Premium computed against the midpoint of each range. Live
trailing P/E from yfinance trailingPE on ETF proxies (SPY, QQQ, EXSA.DE, CAC.PA, EXS1.DE, ISF.L,
1321.T, EEM). Bold marks a premium above 20%.
The striking feature is that the S&P 500 is the only index in the table that is historically stretched by the >40% threshold, at +53.5% above its long-run midpoint. The Nasdaq 100, despite carrying the highest absolute multiple at 31.29x, is only 13.8% above its own historical average — because that average has always been high. Europe clusters in the low-to-high teens of premium.
Investment Risk Assessment for ETF Investors
United States (S&P 500 / Nasdaq ETFs)
Earnings yield on SPY is (1÷26.09) = 3.83%, against a 10-year Treasury at 4.72% (US Treasury par curve, 2026-08-17). The earnings yield gap is −0.89 pp: on the day's closing prices, a 10-year Treasury offers more current yield than the S&P 500's earnings yield. Against the 10-year TIPS real yield of 2.44% (US Treasury real curve, 2026-08-17) the gap is +1.39 pp. The 2.28 pp difference between those two framings is the size of the inflation correction — large enough to flip the sign, which is exactly why the nominal version should not be read on its own.
The session widened the nominal gap by 9 bps, entirely from the Treasury side: the S&P's earnings yield is unchanged at this rounding, while the 10-year rose. The long end selling off is what made US equities relatively more expensive on the day, not anything that happened to earnings.
Position is a separate question from valuation: the index is 0.65% below its 52-week high and above both moving averages, so the trend is intact. The risks are concentration (a Nasdaq up while the Dow is down 0.40% is a narrow tape), the AI capex thesis on which a large share of index earnings now depends, and rate sensitivity — a real yield at 2.44% is a demanding discount rate for a 26x multiple.
Europe (STOXX 600 / CAC 40 / DAX ETFs)
Earnings yield on EXSA.DE is (1÷18.10) = 5.53%, against a euro AAA 10-year of 3.21% (ECB YC API, 2026-08-14). The euro earnings yield gap is +2.31 pp nominal, or +4.35 pp against the euro real 10-year of 1.18%. Europe trades at a 31% discount to the US on trailing multiples (18.10x vs 26.09x) and offers a materially better current-income trade-off.
Part of that difference is not risk compensation at all — it is the gap between US and euro-area inflation and policy paths. But only part, and less than one might assume: decomposed below, the 151 bps nominal yield gap between the two regions is 24 bps of inflation expectation and 126 bps of real rate. The euro advantage on this measure survives the inflation correction almost entirely intact.
Risks: French fiscal and political uncertainty (a persistent driver of OAT spreads through 2026), energy exposure to Middle East escalation, and China demand for the industrial and luxury names that dominate the DAX and CAC.
On currency: a euro-based investor holding EUR-quoted European funds has no FX effect on the quoted value of the holding, but real FX exposure sits inside the earnings — CAC 40 and STOXX 600 constituents are multinationals earning substantially abroad. The exposure is smaller, slower and partly offset by foreign cost bases; it is not absent.
Japan (Nikkei / TOPIX ETFs)
23.30x trailing, an 11% premium to its historical average — the mildest overvaluation in the table. The dominant variable is the BOJ, which hiked to 1.00% in June 2026 (the first time at that level since 1995) and held there on 31 July in an 8–1 vote, with one member pushing for 1.25%. The BOJ has said core inflation should run clearly above 2% from the second half of the fiscal year, so further tightening is live. With USD/JPY at 159.31, an unhedged euro or dollar investor is carrying a currency position that a BOJ hike would move sharply — the hedge decision is not secondary here. Corporate governance reform continues to support the domestic bid.
Emerging Markets (MSCI EM ETFs)
17.56x trailing is a 25.4% premium to EM's own historical average, so the familiar "EM is cheap" framing does not hold against its own history — it holds only against the US. China's index weight is the single largest determinant of returns, and today's 1.3–1.4% rally in Hong Kong and Shanghai came with both indices still below their 200-day averages. Currency and political risk are the standing caveats.
Overall Risk Score (qualitative, not financial advice)
- United States — high valuation risk / low margin of safety. A 53.5% premium to historical average combined with a negative nominal earnings yield gap and a 2.44% real risk-free rate.
- Europe — moderate, the most balanced of the majors. Mid-teens premium, a solidly positive earnings yield gap that holds up in real terms, offset by political and geopolitical risk.
- Japan — moderate, with the risk concentrated in policy and currency rather than valuation.
- Emerging Markets — moderate, attractive only relative to the US, not relative to its own past.
Disclaimer: This is financial information, not personalised investment advice. Past valuations do not guarantee future returns. Consult a financial advisor before investing.
US Economic Indicators (FRED — authoritative)
| Indicator | Current | Prior | Delta | Reference Date | FRED Series |
|---|---|---|---|---|---|
| CPI YoY % | 3.30% | 3.46% | −0.16 pp | Jul 2026 | CPIAUCSL |
| Core CPI YoY % | 2.47% | 2.57% | −0.10 pp | Jul 2026 | CPILFESL |
| Unemployment Rate | 4.1% | 4.2% | −0.1 pp | Jul 2026 | UNRATE |
| Nonfarm Payrolls | −23k | +57k | −80k | Jul 2026 (m/m) | PAYEMS |
| 10Y TIPS Real Yield | 2.44% | 2.41% | +0.03 pp | 2026-08-17 | DFII10 |
Note: FRED macro data is monthly and typically lags 4–6 weeks. Prior values for CPI, Core CPI, unemployment and payrolls are the June 2026 reference month as recorded in this project's own earlier archives.
The July payrolls figure is the one to sit with: −23,000, an outright monthly contraction against +57,000 in June, an 80,000 swing. Headline CPI cooled to 3.30% and core to 2.47%, and unemployment ticked down to 4.1% — a combination that is internally awkward (falling unemployment alongside negative payrolls usually means labour force participation is falling too). Disinflation plus a shrinking payroll count would ordinarily argue for a lower long end, which makes today's 30-year at its highest since 2007 a term-premium and supply phenomenon rather than an inflation-expectations one. The breakeven arithmetic below supports that reading.
Other economic releases today (from web search): the UK labour market report showed unemployment at 4.9% with regular pay +3.4% y/y and total pay +4.4% y/y, total pay slightly above estimates. The German and euro-area ZEW economic sentiment indices for August were released today, but the actual print could not be retrieved from a reliable source — (not retrieved). US housing starts, industrial and manufacturing production, and import/export prices for July were also on the calendar; actuals (not retrieved).
Fixed Income & Bond Analysis
Policy Rates
| Central Bank | Rate | Source |
|---|---|---|
| Fed Funds (upper) | 3.75% | FRED DFEDTARU (2026-08-17) |
| Fed Funds (lower) | 3.50% | FRED DFEDTARL (2026-08-17) |
| Effective FFR | 3.63% | FRED DFF (2026-08-13) |
| ECB Deposit Rate | 2.25% | FRED ECBDFR (2026-08-17) |
| BOJ Policy Rate | 1.00% | web search (hiked Jun 2026, held 31 Jul) |
| BOE Bank Rate | ~3.73% | FRED IUDSOIA (SONIA proxy, 2026-08-13) |
Government Bond Yields
| Country | 2Y Yield | 10Y Yield | 30Y Yield | Day Chg (10Y) | Source |
|---|---|---|---|---|---|
| USA | 4.19% | 4.72% | 5.31% | +4 bps | US Treasury par curve (2026-08-17 vs 08-14) |
| Germany/AAA | 2.73% | 3.21% | 3.68% | +6 bps | ECB YC API (2026-08-14 vs 08-13) |
| France | (not retrieved) | (not retrieved) | (not retrieved) | — | web |
| UK | (not retrieved) | 5.07% | (not retrieved) | — | web |
| Japan | (not retrieved) | 2.86% | (not retrieved) | — | web |
| Italy | (not retrieved) | 3.99% (2026-08-14) | (not retrieved) | — | web |
The euro row is the ECB's AAA-rated euro area government curve, which tracks the Bund closely but is not identical to it. The US row is the settled 17 August curve throughout — all three maturities, the day change and the spreads below share that one date, so the +4 bps at the 10-year describes 17 vs 14 August and does capture the session's long-end move. The euro row remains dated 14 August and the web-sourced yields are 17 August or Friday's; those dates are stated inline rather than assumed to match.
Yield Curve Spreads (US Treasury par curve, 2026-08-17):
- 10Y–2Y spread: +53 bps — positively sloped and normal. Not steep (which would need roughly +75 bps or more historically) and well clear of inversion. The curve completed its disinversion some time ago and is now in ordinary territory at the belly.
- 10Y–3M spread: +85 bps — no recession signal. This is the spread with the better historical track record as a leading indicator, and it is comfortably positive.
What the pair signals: the market is not pricing imminent Fed easing (the front end is anchored near the target range) and is not pricing a downturn. The action is entirely beyond the 10-year, where the 30Y–10Y segment at +59 bps carries the term premium story.
OAT-Bund Spread: (not retrieved). Contemporaneous French 10-year data could not be sourced for today — the only OAT-Bund figures returned by search were from May 2026 and are too stale to quote. This remains the key French fiscal risk indicator and is worth watching given the political backdrop, but no current value is stated here rather than an old one.
Yield Curve Charts
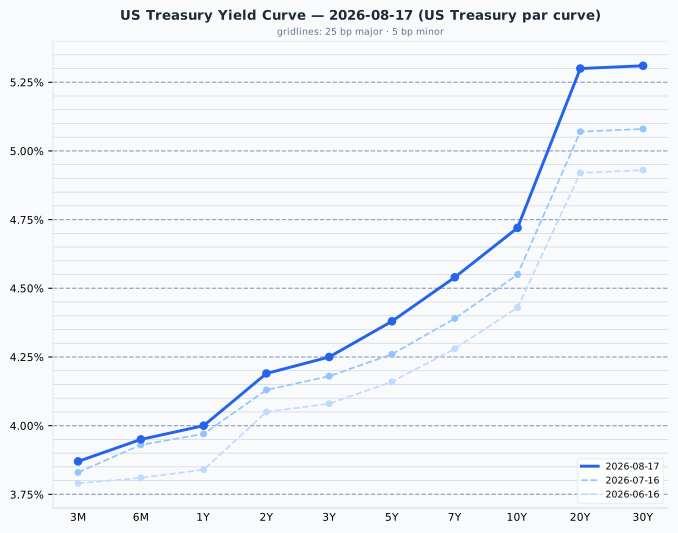
The US curve is upward-sloping throughout with a pronounced steepening beyond 10 years — the jump from 4.72% at 10Y to 5.30% at 20Y is the single largest segment on the curve. Against a month ago (16 July) the whole curve has shifted up, but unevenly: the 3-month is +4 bps and the 2-year +6 bps, while the 20-year is +23 bps and the 30-year +23 bps, a clear bear-steepening of the long end rather than a parallel move.
Sanity check: the 3-month at 3.87% sits 24.5 bps above the Fed Funds target midpoint of 3.625%, within the expected tolerance.
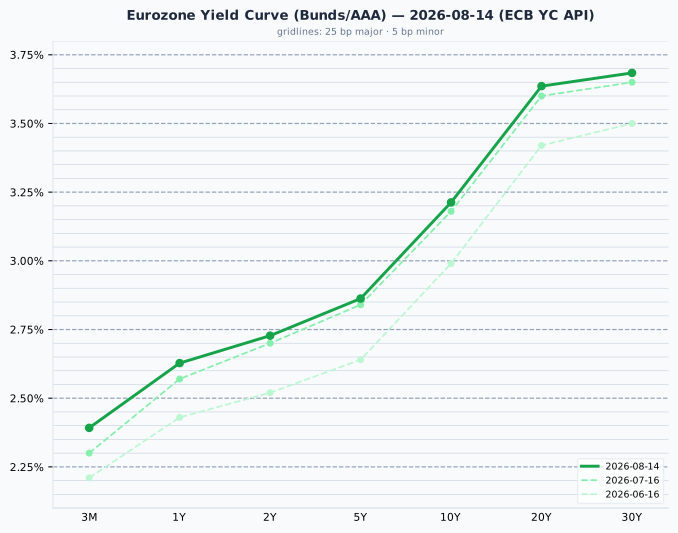
The euro AAA curve is also upward-sloping and, like the US, steepest at the long end — 3.21% at 10Y rising to 3.64% at 20Y. It is a flatter curve overall, spanning 129 bps from 3M to 30Y against 134 bps for the US, and it sits roughly 140 bps lower in level. Versus a month ago (16 July) the shift is smaller and more even: +9 bps at 3M, +3 bps at 10Y, +4 bps at 20Y. Europe has not experienced the long-end pressure the US has.
Credit Markets (from FRED — authoritative, 2026-08-14)
| Market | OAS Spread | Series ID |
|---|---|---|
| US Investment Grade | 80 bps | BAMLC0A0CM |
| US High Yield | 267 bps | BAMLH0A0HYM2 |
| Euro High Yield | 254 bps | BAMLHE00EHYIOAS |
All three are historically tight. US high yield at 267 bps is below the 300–500 bps range that constitutes normal conditions, and nowhere near the >500 bps that would indicate stress. US investment grade at 80 bps sits exactly at the floor of its 80–150 bps normal band. Euro high yield at 254 bps is tighter than its US equivalent.
Tight spreads at this level mean credit investors are being paid very little to take default risk. Combined with a VIX at 14.25, this is a market pricing benign outcomes — which is worth registering precisely because the long end of the Treasury curve is simultaneously pricing something less benign. The two are not obviously reconcilable, and that divergence is the most interesting thing in today's data.
Real Yields (US and Euro Area)
| Region | Nominal 10Y | Expected inflation | Real 10Y | How the real yield is obtained |
|---|---|---|---|---|
| United States | 4.72% (US Treasury par curve, 2026-08-17) | 2.28% (residual) | 2.44% (US Treasury real curve, 2026-08-17) | Measured. TIPS trade, so the market quotes a real yield directly; expected inflation is the residual (the breakeven) |
| Euro area | 3.21% (ECB YC API, 2026-08-14) | 2.04% (ECB SPF, 2026-Q3, measured) | 1.18% (residual) | Constructed. No euro inflation-linked benchmark is published, so a survey expectation is subtracted from the nominal yield |
The two rows are built in opposite directions. The US measures the real yield in the market and infers inflation from it; the euro area measures inflation in a survey and infers the real yield. Only the US figure of 2.44% is something anyone actually trades — the euro 1.18% is the softer number and should be treated as such. Two mismatches follow from this and should be stated whenever the pair is compared: the US breakeven carries an inflation risk premium that a survey does not, and the SPF horizon is five calendar years ahead against the bond's ten.
Decomposing the gap: the 151 bps nominal difference between the US and euro 10-year splits into just 24 bps of expected inflation (2.28% vs 2.04%) and 126 bps of real rate (2.44% vs 1.18%). This is overwhelmingly a real-rate story, not an inflation story — the two regions' inflation expectations are nearly converged, and essentially the entire yield differential is real compensation.
⚠️ This gap is not an investment opportunity
The US real yield has exceeded the euro one in every quarter since 2014. It is a structural feature — higher US trend growth, euro-area excess savings, Bund scarcity, US fiscal supply — not a trade a euro-based reader can capture. Hedging the currency cancels it exactly, because the forward rate is set to remove the interest differential; unhedged, it is a currency bet rather than a bond decision. A real yield is real in its own currency: 2.44% means 2.44% above US inflation, which is not a real return for someone who spends euros. A gap of this size persisting for twelve years is the proof that it is compensation for risk borne by dollar investors, not a mispricing.
Bond Portfolio Implications
Earnings yield gap — what it is good for, and what it is not. This is the earnings yield gap, not the equity risk premium. The equity risk premium is expected total return on equities minus the risk-free rate and requires a growth forecast; the gap below deliberately omits growth. Its virtue is that it uses nothing but quoted prices — it tells an investor honestly what today's trade-off is between locking in a bond coupon and accepting equity risk at a given earnings yield. It does not forecast whether equities will beat bonds, and no such inference is drawn here.
- S&P 500 gap = (1÷26.09) − 4.72% = 3.83% − 4.72% = −0.89 pp. Negative: bonds offer more current yield than equities today.
- Euro gap = (1÷18.10) − 3.21% = 5.53% − 3.21% = +2.31 pp.
Two structural biases to disclose, since the number carries weight above:
- It ignores growth. A bond coupon is fixed for a decade; the earnings behind the equity yield grow roughly with inflation, so the gap understates equities by approximately expected inflation. The cleanest correction is the real-yield version: 3.83% − 2.44% = +1.39 pp for the US, and 5.53% − 1.18% = +4.35 pp for Europe. The point of interest is the size of the correction — 2.28 pp in the US, enough to flip the sign of the gap outright, and 2.04 pp in Europe.
- An equity holder does not receive the full earnings yield. Only the dividend and buyback portion arrives as cash; the remainder is retained by the company. As a pure income comparison, the equity leg overstates what actually reaches the investor.
Cross-country caveat: comparing the US gap to the euro gap partly measures the difference between two currencies rather than relative risk compensation, which is why the real-yield version is quoted alongside. Here the decomposition happens to be reassuring — as shown above, only 24 bps of the 151 bps yield differential is inflation, so Europe's advantage on this measure is not a currency illusion. For the forward-looking valuation argument, the more reliable measure is earnings yield versus its own history, not the gap.
Duration risk: a 100 bps rise in yields costs roughly 8–9% in price on a 10-year bond, and substantially more at 20–30 years, which is precisely where today's move has been concentrated. With the curve positively sloped at +53 bps (10Y–2Y) but the real action in the 30Y–10Y segment at +59 bps, an investor is being paid something to extend from 2 to 10 years, and rather more to extend beyond — but the long end is where the volatility currently sits. Short-to-intermediate duration captures most of the available term premium with a fraction of the mark-to-market risk; the case for the very long end rests on a view that today's term premium repricing is overdone.
Currencies & Commodities
Currencies:
| Pair | Rate | Source |
|---|---|---|
| EUR/USD | 1.1559 | FRED DEXUSEU (2026-08-07) ⚠ |
| USD Index | 119.06 | FRED DTWEXBGS (2026-08-07) ⚠ |
| USD/JPY | 159.31 | web search |
| GBP/USD | 1.3562 | web search |
| USD/CHF | 0.8092 | web search |
⚠ The two FRED FX series were last published for 7 August — ten days stale. Treat the EUR/USD and broad dollar index levels as indicative rather than current.
USD/JPY at 159.31 remains the pair to watch given the BOJ's stated tightening bias.
Commodities (all front-month futures — 17 Aug close):
| Commodity | Price | Day Chg % | Ticker | Source |
|---|---|---|---|---|
| Brent Crude | 90.87 | +2.65% | BZ=F | yfinance |
| WTI Crude | 84.50 | +2.55% | CL=F † | yfinance |
| Gold ($/oz) | 4,473.70 | +0.82% | GC=F | yfinance |
| Silver ($/oz) | 66.231 | +1.72% | SI=F | yfinance |
| Copper ($/lb) | 6.617 | +0.06% | HG=F | yfinance |
| Nat Gas ($/MMBtu) | 2.690 | −1.57% | NG=F | yfinance |
Prices are exchange settlement prices and day changes are settlement-to-settlement: the 17 August settlement against the 14 August settlement. Settlement is the official daily mark, struck 13:00–14:30 ET depending on contract, and is the basis financial media use for futures day changes. It is not the last trade, which comes up to 2½ hours later when the session ends at 17:00 ET — WTI last traded at 84.95 against its 84.50 settlement.
† WTI contract roll. On 17 August the WTI generic (CL=F) pointed at the September contract, CLU26.NYM; it has since rolled to October, CLV26.NYM. The $84.50 above is CLU26's 17 August settlement, which is the contract this briefing was reporting, and the +2.55% is measured against that same contract's 14 August settlement of $82.40. A current screen quote for CL=F will show a different and lower level — the spread between the two contracts, not a price move. Every other commodity here is still on the contract it was quoted on.
Precious metals. Gold at $4,473.70 is 19.9% below its all-time high of $5,586.20, set on 29 January 2026 — a recent record, so the distance is meaningful rather than a historical artefact. Silver at $66.231 is 45.4% below its all-time high of $121.30, also set on 29 January 2026. Both metals gained on the day but gave back part of their intraday advance into the close, gold finishing at +0.82% against +1.02% at midday and silver at +1.72% against +2.22%. Neither is anywhere near its highs; silver in particular has retraced nearly half of a spike that peaked less than seven months ago, and its 52-week range of $37.21–$121.30 shows how violent that episode was. "Safe haven bid" describes today's direction, not the level.
Copper at $6.617/lb is the standout: 1.6% below its all-time high of $6.728, set on 6 August 2026, so it is genuinely trading at/near all-time highs after an almost unbroken advance from a 52-week low of $4.41.
Crude. Brent closed at $90.87 and WTI at $84.50, both in the upper-middle of their 52-week ranges ($58.72–$126.10 for Brent, $54.98–$119.48 for WTI). Both are well below their 2008 record highs, but that record is eighteen years old and set in a structurally different market, so the distance carries no useful information. The geopolitical bid strengthened through the afternoon: at midday Brent was +0.87% and WTI +0.52%, and both closed at roughly three times those gains. Crude was the clearest expression of the day's risk premium, and the equity tape did not share it.
Natural gas at $2.690/MMBtu is near the bottom of its 52-week range of $2.483–$7.827, down 1.6% on the day — the only commodity lower, and the divergence from the crude complex points to a supply and storage story rather than a shared macro driver.
Crypto: no notable moves retrieved — (not retrieved).
Sector & Theme Highlights
Best performing: Chipmakers and AI infrastructure, on Anthropic's $11.5bn quarterly revenue print reinforcing the datacentre capex thesis — the sole reason the Nasdaq 100 held positive while the Dow fell 0.40%. Precious metals miners would be the second-order beneficiary of gold +1.0% and silver +2.2%. Greater China equities broadly.
Worst performing: Long-duration fixed income, the day's worst-performing asset class — the iShares 20+ Year Treasury Bond ETF marked its lowest close in over two decades. Rate-sensitive equity sectors (utilities, REITs, and other bond proxies) would be the natural equity casualties of a 30-year at its highest since 2007. European equities broadly, though modestly.
Cross-market themes:
- Term premium, not policy. The defining theme. The front end is anchored, the belly is normal, and the entire repricing is at 20–30 years. Fiscal supply and duration appetite, not the Fed.
- AI capex durability. Each quarter that hyperscaler and model-developer revenue compounds, the capex thesis gets a further stay of execution — and index concentration deepens with it.
- Geopolitical risk premium in commodities, absent in volatility. Middle East escalation is visible in crude and gold but not in a VIX of 14.25 or a 267 bps high yield spread.
- China rally within a downtrend. Above the 50-day, below the 200-day, in both Hong Kong and Shanghai.
- Divergent regional rate paths. The euro curve has barely moved in a month while the US long end has sold off — the 121 bps real-rate gap is the accumulated result.
Top Stories (Global)
- US 30-year Treasury yield reaches its highest since 2007, with the iShares 20+ Year Treasury Bond ETF marking its weakest close in more than twenty years. The 30Y settled at 5.31% and the 20Y at 5.30% (US Treasury par curve, 2026-08-17), +6 bps and +5 bps on the session. This is the day's dominant macro event.
- Anthropic reports $11.5bn in second-quarter revenue, driving a rally in chipmakers and AI infrastructure names that carried the Nasdaq 100 through the middle of the session before it reversed to close −0.17%, alongside a broadly weaker US tape.
- Renewed Middle East violence and US–Iran tensions unsettled risk appetite, supporting crude (Brent +2.65% to $90.87, WTI +2.55%) and precious metals (gold +0.82%, silver +1.72%) while capping equity upside. The crude bid strengthened into the close after President Trump said he does not expect the war to end soon, taking Brent through $90 a barrel.
- US July payrolls contracted by 23,000 against +57,000 in June (FRED PAYEMS), even as headline CPI cooled to 3.30% and unemployment fell to 4.1% — a mixed labour picture that sits awkwardly with a selling-off long end.
- UK labour market data showed unemployment at 4.9%, with regular pay growth of 3.4% y/y and total pay of 4.4% y/y, slightly ahead of estimates. The UK 10-year gilt trades around 5.07%, high by post-2008 standards and 134 bps above SONIA.
- Greater China equities led global markets, with the Shanghai Composite +1.41% and the Hang Seng +1.34%, pulling emerging market ETFs up with them (EEM +1.07%).
- South Korean markets were closed for Liberation Day, observed Monday 17 August.
Looking Ahead
Central banks - FOMC minutes are due midweek — the week's principal scheduled catalyst, and unusually relevant given the disconnect between an anchored front end and a selling-off long end. Watch for any discussion of the balance sheet or duration supply. - No ECB, BOE or BOJ decision this week. The BOJ's guidance that core inflation will run clearly above 2% from the second half of the fiscal year keeps a further hike live at forthcoming meetings.
Economic releases - Global S&P flash PMIs (August) on Friday — the first read on August activity across the US, euro area, UK and Japan, and the week's second focal point. - German PPI (July) and Canadian PPI (July) later in the week. - Ongoing US data: after today's housing starts and industrial production, the market will be looking for confirmation or reversal of the July payrolls contraction.
Earnings - Q2 reporting season is in its late stages. Attention centres on remaining AI infrastructure and semiconductor names, given how much of the index-level earnings story now rests on that theme. - Large-cap retail reports this week — Walmart, Home Depot and Target. Much of Monday's wait-and-see tone was attributed to positioning ahead of them, which makes them the read on the US consumer that the week's equity direction is most likely to turn on.
Geopolitical - Middle East escalation and the US–Iran situation remain the live tail risk, with the transmission running through crude first and equity risk appetite second. - French budget politics remain a slow-burning driver of euro periphery and semi-core spreads.
Market closures (from the Nager.Date holiday calendar) - Monday 31 August — Summer Bank Holiday: UK markets closed. - Monday 7 September — Labour Day: US, Canada and (Independence Day) Brazil markets closed. - No closures in the next five trading days in any tracked market. India's holiday calendar is absent from the calendar, so Indian closures cannot be confirmed from this source.
Data sources: FRED (US Treasuries, policy rates, credit spreads, US macro, VIX, FX), ECB Yield Curve API and ECB Survey of Professional Forecasters (euro curve, inflation expectations), yfinance (all equity index levels, ETF trailing P/E, commodity futures), and targeted web search (non-US bond yields, non-USD FX, BOJ policy, economic calendar, market news). Every figure above is live-sourced except the historical average P/E column, which uses static reference constants. Values marked (not retrieved) had no reliable live source and have been left blank rather than estimated.