2026 10 16
Global Financial Briefing — Friday, 16 October 2026
Figures reflect the 16 Oct close wherever close data exists. FX quotes and the French, UK, Japanese and Italian bond yields are evening quotes; other figures are dated inline. The US Treasury curve is the 16 Oct close; the euro AAA curve is the ECB's 15 Oct curve, the latest it had published.
Market Overview
The sell-off in technology shares moved back to New York. The Nasdaq 100 fell 2.50% and the S&P 500 1.09%, while the Dow, with fewer technology companies, fell only 0.34%. Chip makers and the companies borrowing to build AI data centres fell most: CoreWeave dropped nearly 12% on renewed worries about its debts and Micron more than 5% (TradingKey, CNN), and the Philadelphia index of chip stocks fell 3.83%, its eighth fall in a row, for a loss of 11.42% on the week (Yahoo Finance). Two things weighed on the AI trade: doubts that data-centre operators can turn profitable in time to repay their debts as borrowing costs rise, and a Reuters report that some investors in Anthropic, whose third-quarter revenue was reported this week at $16.8 billion, up about 45% on the quarter but growing more slowly than earlier in the year, are weighing a lower valuation for its planned share listing (Reuters; CNBC). The fund tracking the S&P 500's technology companies fell 3.02%, and those for communication services 1.89%, while energy rose 2.52% and utilities 1.34%. Over the week the Nasdaq 100 lost 5.49% and the S&P 500 1.95%, while the Dow gained 0.67%.
Asia and Europe went the other way. South Korea's Kospi rose 2.05% to 5,668.05, its first rise since its 2 October close of 7,003.74 after seven falls in a row, and Japan's Nikkei 225 rose 1.39%, as investors bought chip stocks after Thursday's falls of 7.57% and 4.90%; Samsung Electronics gained 2.62% and SK hynix 0.79%, both well below their early gains (Korea JoongAng Daily, TradingKey). Even so, the Kospi lost 14.46% over the week, its worst week since October 2008, and the Nikkei 5.37%. Europe closed higher across the board, led by banks: the STOXX 600 rose 0.72%, its fifth gain in six sessions, the DAX 0.95% and the CAC 40 0.28% (Trading Economics). Over the week the STOXX 600 gained 2.09% and the FTSE 100 3.13%, against the Nasdaq 100's 5.49% fall: investors have been selling US technology and AI shares and buying European banks, drug makers and consumer-staples companies.
Oil jumped. The December Brent contract (BZZ26) settled at $109.86, up 3.72% from Thursday's settlement, after a container ship, the GFS Pride, sank in the Strait of Hormuz when it was hit by an Iranian projectile, although more than 40 ships passed through the strait in the previous 24 hours and members of the International Energy Agency agreed to release the remaining 100 million barrels of the emergency stocks they began releasing in March (Trading Economics). More inflation news came from the US: import prices rose 1.1% in September, above the 0.8–0.9% expected, and 8.1% on a year earlier, the most since July 2022; industrial production rose 0.7% against 0.4% expected (Rallies, yournews). Fed Chair Kevin Warsh said a surge in spending is adding to inflation but the economy is resilient, and markets increasingly expect the Fed to hold rates at its 27–28 October meeting, with Barclays forecasting rises of 25 bp in December and January (Reuters). Treasury yields barely moved: the 10-year settled at 5.09%, down 1 bp on the day, the 30-year was unchanged at 5.43% and the 3-month bill fell 2 bp to 4.26% (US Treasury par curve, 16 Oct). In the euro area, final figures confirmed that inflation rose to 3.8% in September from 3.2% in August, with energy prices up 18.9% on a year earlier (Eurostat), and the German 10-year yield rose about 5 bp to 3.46% by the evening (Trading Economics).
Global Indices Snapshot
Americas
| Index | Level | Day Chg | Day Chg % | Source |
|---|---|---|---|---|
| S&P 500 | 7,659.44 | −84.62 | −1.09% | yfinance ^GSPC |
| Nasdaq 100 | 29,187.55 | −748.04 | −2.50% | yfinance ^NDX |
| Dow Jones | 52,002.41 | −175.28 | −0.34% | yfinance ^DJI |
| Brazil IBOV | 205,430.33 | +1,106.06 | +0.54% | yfinance ^BVSP |
Americas data reflects the 16 Oct close.
The S&P 500 is 0.62% below its 50-day average, 5.39% above its 200-day average and 2.36% below its 52-week high of 7,844.52. The Nasdaq 100 fell below its 50-day average today, to 2.29% under it, and is 6.93% below its 52-week high of 31,361.37. The Dow is 0.94% below its 50-day average; Goldman Sachs and JPMorgan rose, briefly taking it to its highest level in over a month earlier in the session (Reuters), before the technology sell-off deepened. Brazil's Ibovespa rose 0.54%, to 2.04% below its 52-week high, nine days before the presidential runoff on 25 October.
Europe
| Index | Level | Day Chg | Day Chg % | Source |
|---|---|---|---|---|
| Euro STOXX 600 | 644.74 | +4.58 | +0.72% | yfinance ^STOXX |
| CAC 40 | 7,956.70 | +22.00 | +0.28% | yfinance ^FCHI |
| DAX | 25,622.61 | +239.99 | +0.95% | yfinance ^GDAXI |
| FTSE 100 | 10,881.90 | +41.55 | +0.38% | yfinance ^FTSE |
| SMI (Swiss) | 14,391.31 | +41.80 | +0.29% | yfinance ^SSMI |
European data reflects today's close (16 Oct).
Banks led Europe after Thursday's fall in bond yields: ING and Deutsche Bank rose 1.5%, and UniCredit 1.4% after the ECB approved an increase in its stake in Commerzbank, which clears the way for a takeover bid (Trading Economics). Unlike in New York, Europe's AI-related shares recovered: ASML rose 1% and Siemens Energy, which supplies power equipment to data centres, 2%, and the Euro STOXX 50 of the largest euro-area companies rose 0.58% to 6,204.23 after Thursday's fall, a little less than the STOXX 600. The DAX gained most of the major indices and is now 0.43% below its 50-day average. The CAC 40 rose for a third day in a row, from its 13 October close of 7,827.63, but remains the weakest against its trend: 3.14% below its 50-day average and 3.25% below its 200-day average. The STOXX 600 is back at its 50-day average (0.07% above), and the FTSE 100 is 0.98% below its 52-week high of 10,989.50.
Asia-Pacific
| Index | Level | Day Chg | Day Chg % | Source |
|---|---|---|---|---|
| Nikkei 225 | 65,324.29 | +898.34 | +1.39% | yfinance ^N225 |
| Hang Seng | 24,186.83 | +124.11 | +0.52% | yfinance ^HSI |
| Shanghai Comp | 3,716.28 | +8.81 | +0.24% | yfinance 000001.SS |
| ASX 200 | 8,806.70 | +87.00 | +1.00% | yfinance ^AXJO |
| Kospi (Korea) | 5,668.05 | +113.83 | +2.05% | yfinance ^KS11 |
Asia-Pacific data reflects today's close (16 Oct).
The Kospi's rebound faded during the day: Samsung Electronics and SK hynix were both up more than 3% before the open, and selling by individual and institutional investors late in the session trimmed the index's gain (Korea JoongAng Daily). It remains 19.07% below its 2 October close and 15.29% below its 50-day average. The Nikkei's rise was its first since its 6 October close of 70,683.98, and it is still 7.58% below that level and 10.31% below its 52-week high of 72,831.73. Australia's ASX 200 rose 1.00%. In China the Shanghai Composite edged up 0.24%, 1.13% above the 52-week low it touched on Thursday, and the Hang Seng rose 0.52%.
Emerging Markets
| Index | Level | Day Chg % | Source |
|---|---|---|---|
| MSCI EM (EEM) | 62.85 | −1.74% | yfinance EEM |
| India Nifty 50 | 23,146.15 | +0.65% | yfinance ^NSEI |
| South Africa | 65.28 | +0.42% | yfinance EZA |
MSCI EM (EEM) and South Africa (EZA) are New York-listed funds; all three rows are the 16 Oct close.
EEM and the markets it holds moved in opposite directions today. The Asian markets that make up most of the MSCI emerging-markets index rose (Korea 2.05%, India 0.65%, Hong Kong 0.52%, Shanghai 0.24%), but EEM, which trades in New York after those markets have closed, fell 1.74% as US investors sold chip stocks again in their own session, as they had on Wednesday. EEM's fall is therefore New York's valuation of Asian chip makers, not what Asian markets did; Monday's Asian session will show whether local markets follow. For a euro investor, EEM's fall is about 1.8% in euros. India's Nifty rose for a second day, from its 14 October close of 22,622.70, and is 1.83% below its 50-day average.
Index Valuations & Investment Risk
Valuation Table
| Index | Trailing P/E (live) | 50-day avg | 100-day avg | 200-day avg |
|---|---|---|---|---|
| S&P 500 | 24.2x | 25.2x | 26.1x | — |
| Nasdaq 100 | 27.2x | 30.0x | 31.3x | — |
| Euro STOXX 600 | 17.8x | 17.8x | 18.1x | — |
| CAC 40 | 16.7x | 16.8x | 17.2x | — |
| DAX | 18.1x | 18.4x | 18.4x | — |
| FTSE 100 | 16.9x | 16.8x | 17.3x | — |
| Nikkei 225 | 17.1x | 21.4x | 22.4x | — |
| MSCI EM | 13.5x | 15.4x | 16.5x | — |
Averages of the daily trailing P/E readings recorded since 1 May 2026 (n = 112); shown for reference only. Trailing P/E is Yahoo Finance's trailing P/E for the ETF proxies SPY, QQQ, EXSA.DE, CAC.PA, EXS1.DE, ISF.L, 1321.T and EEM, at the 16 Oct close.
Investment Risk Assessment for ETF Investors
United States (S&P 500 / Nasdaq ETFs)
The S&P 500's trailing P/E of 24.2x gives an earnings yield of 4.13% (1÷24.23). Against the settled 10-year Treasury yield of 5.09% (US Treasury par curve, 16 Oct) the earnings yield gap is −0.96 pp: a 10-year government bond pays more income than the index's earnings come to per dollar invested. Against the real 10-year yield of 2.74% (US Treasury real curve, 16 Oct) the gap is +1.39 pp; the 2.35 pp between the two is the correction for company earnings growing with inflation while a bond coupon is fixed. Only the part of earnings paid out as dividends and buybacks reaches a holder as cash. The Nasdaq 100 at 27.2x has an earnings yield of 3.68%, 1.41 pp below the 10-year Treasury. The risk for US funds this week has been the AI spending behind the largest technology companies' valuations: the Nasdaq 100 has lost 5.49% since last Friday as investors questioned whether the companies borrowing to build data centres, CoreWeave above all, can repay their debts, and whether the AI developers renting that capacity are worth what investors had assumed. Meanwhile inflation keeps surprising upwards: import prices rose 1.1% in September after producer prices rose 1.3%, and Barclays expects Fed rate rises in December and January (Reuters), which would raise borrowing costs for exactly those indebted companies.
Europe (STOXX 600 / CAC 40 / DAX ETFs)
The STOXX 600 at 17.8x gives an earnings yield of 5.61% (1÷17.83); against the euro AAA 10-year yield of 3.39% (ECB YC API, 15 Oct) the euro earnings yield gap is +2.22 pp, and against today's 10-year Bund at 3.46% (Trading Economics) it is +2.15 pp. Against the euro-area real 10-year yield of 1.35% (see Real Yields below) it is +4.25 pp. The S&P 500 trades at a 35.9% P/E premium to the STOXX 600 (24.2x against 17.8x). Part of the difference between the US and euro gaps reflects different inflation and policy paths rather than different compensation for risk, which is why the real-yield versions are shown alongside. The CAC 40 at 16.7x has an earnings yield of 5.97% (1÷16.75), 1.18 pp above the French 10-year yield of 4.79%; the DAX at 18.1x yields 5.51%, 2.05 pp above the Bund; and the FTSE 100 at 16.9x yields 5.93%, 0.53 pp above the 10-year gilt at 5.40%. Europe gained from this week's move out of US technology because its indices hold more banks, drug makers and consumer-staples companies, but today's bank gains were put down to Thursday's fall in bond yields (Trading Economics), and with euro-area inflation at 3.8% and an ECB rate rise expected in December, those yields can turn back up, as the Bund did this evening. The first French parliamentary vote on the budget's revenue measures is on 20 October and Moody's reviews France's rating on 23 October (FXStreet, 13 Oct). A euro investor in euro-quoted funds has no exchange-rate effect on the quoted value, but the constituents earn much of their profit abroad, so their earnings in euros still move with the currency.
Japan (Nikkei / TOPIX ETFs)
The Nikkei proxy's P/E is 17.1x (earnings yield 5.84%), 2.91 pp above the 10-year Japanese government bond at 2.93% (Trading Economics). The index rose 1.39% today but lost 5.37% over the week, because its weight in chip-equipment and technology companies such as Advantest and SoftBank Group ties it to the AI trade. The Bank of Japan raised its policy rate to 1.25% on 18 September, from the 1.00% set in June (as cited in the 13 Oct briefing), and meets next on 29–30 October; board member Junko Koeda warned today against holding back on rate rises (Trading Economics). The yen weakened to 158.15 per dollar and fell about 0.2% against the euro, so a euro investor in an unhedged Japan fund gained about 1.2% today rather than the index's 1.39%.
Emerging Markets (MSCI EM ETFs)
EEM trades at 13.5x, the cheapest index in the table and a 44.4% discount to the S&P 500, but this week shows why a low P/E is not protection: the Kospi fell 14.46% because its largest companies are memory-chip makers whose profits depend on chip prices and on AI spending in the US, and EEM has fallen 5.91% since last Friday. Today's fall in EEM while Asia rose is New York repricing those chip makers after Asian markets had closed. For a euro investor the currency barely mattered today, with the euro up 0.06% against the dollar; the bigger risk for emerging markets is a Fed that keeps raising rates, which tends to draw money out of them and raises the cost of their dollar debts.
Overall Risk Score: - United States: High valuation risk / low margin of safety. A negative nominal earnings yield gap, a 10-year yield above 5%, import and producer prices rising fast, and a Nasdaq 100 at 27.2x that has lost 5.49% this week on doubts about the return on AI spending. - Europe: Moderate. Positive earnings yield gaps on both measures, a P/E well below the US and fewer technology companies in the indices; against that, Brent above $109, euro-area inflation at 3.8%, an ECB that markets expect to raise rates in December after its 10 September rise to 2.50%, and a French budget without a stable majority. - Japan: Moderate. A P/E of 17.1x, but an index whose moves depend on a few chip and technology stocks, BOJ rate rises and a yen near 158 per dollar. - Emerging Markets: Attractive relative valuation, with Korea's chip makers, China's share market near its 52-week low, oil and Brazil's 25 October runoff as the near-term risks.
US Economic Indicators (FRED - authoritative)
| Indicator | Current | Prior | Delta | Reference Date | FRED Series |
|---|---|---|---|---|---|
| CPI YoY % | 3.72% | 3.35% | +0.36 pp | Sep 2026 (prior Aug) | CPIAUCSL |
| Core CPI YoY % | 2.57% | 2.45% | +0.12 pp | Sep 2026 (prior Aug) | CPILFESL |
| Unemployment Rate | 4.2% | 4.1% | +0.10 pp | Sep 2026 (prior Aug) | UNRATE |
| Nonfarm Payrolls | +29k | +133k | −104k | Sep 2026 (prior Aug), monthly chg | PAYEMS |
| 10Y TIPS Real Yield | 2.74% | 2.78% | −4 bp | 16 Oct 2026 (prior 15 Oct) | DFII10 (US Treasury real curve) |
Consumer prices rose 3.72% on a year earlier in September, with core inflation at 2.57%. This week's figures for prices further up the chain point the same way: producer prices rose 1.3% in September (Thursday's release) and import prices 1.1% (today's), both well above forecasts and both driven largely by energy, though import prices excluding food and fuel also rose 0.7% (yournews). Industrial production rising 0.7% against hiring of only 29,000 in September leaves the Fed with an economy that is producing more but adding few jobs, while prices accelerate.
Other economic releases today (web search)
| Release | Actual | Consensus | Prior | Note |
|---|---|---|---|---|
| Euro area inflation (HICP), Sep final, YoY | 3.8% | 3.8% (flash) | 3.2% | Energy 18.9% (Aug 14.3%), services 3.2% (3.0%); France 3.4%, Germany 3.3%, Italy 4.2%, Spain 5.0% (Eurostat) |
| US import prices, Sep, MoM | +1.1% | +0.8–0.9% | +0.5% (revised) | YoY 8.1%, the most since July 2022; excluding food and fuel +0.7% (Rallies, yournews) |
| US industrial production, Sep, MoM | +0.7% | +0.4% | +0.1% | Manufacturing +0.3%, as expected; capacity use 76.9%, up 0.5 point (Rallies) |
The euro-area figure confirms the flash estimate published on 2 October, so it did not move markets, but the detail shows how uneven the energy shock is: inflation is 5.0% in Spain and 4.2% in Italy against 3.4% in France, where prices fell 0.3% in the month. Energy contributed 1.71 points of the 3.8%, and services inflation rose to 3.2%, the part the ECB watches for signs that higher energy costs are spreading into wages and other prices (Eurostat). US import prices measure what US buyers pay for foreign goods before tariffs, so a 1.1% monthly rise, much of it fuel, adds to the pressure on consumer prices in the coming months.
Fixed Income & Bond Analysis
Policy Rates
| Central Bank | Rate | Source |
|---|---|---|
| Fed Funds (upper) | 4.00% | FRED DFEDTARU (16 Oct 2026) |
| Fed Funds (lower) | 3.75% | FRED DFEDTARL (16 Oct 2026) |
| Effective FFR | 3.88% | FRED DFF (15 Oct 2026) |
| ECB Deposit Rate | 2.50% | FRED ECBDFR (16 Oct 2026) |
| BOJ Policy Rate | 1.25% | web search (raised 18 Sep 2026) |
| BOE Bank Rate | ~3.73% (SONIA/FRED) | FRED IUDSOIA (14 Oct 2026) |
The Fed raised its target range to 3.75–4.00% at its 15–16 September meeting and meets next on 27–28 October; Reuters reports that markets increasingly expect it to hold this month, and Barclays expects 25 bp rises in December and January. The ECB raised its deposit rate to 2.50% on 10 September, its second rise this year after June's move to 2.25%, and markets expect another in December (Trading Economics, 15 Oct).
Government Bond Yields
| Country | 2Y Yield | 10Y Yield | 30Y Yield | Day Chg (10Y) | Source |
|---|---|---|---|---|---|
| USA | 4.74% | 5.09% | 5.43% | −1 bp | US Treasury par curve (16 Oct 2026) |
| Euro area AAA (ECB) | 2.99% | 3.39% | 3.67% | −12 bp | ECB YC API (15 Oct 2026) |
| Germany | 3.11% | 3.46% | 3.82% | +5 bp | web (Trading Economics, 16 Oct 2026) |
| France | — | 4.79% | — | −1 bp | web (Trading Economics, 16 Oct 2026) |
| UK | 4.73% | 5.40% | 5.86% | +4 bp | web (Trading Economics, 16 Oct 2026) |
| Japan | — | 2.93% | — | +1 bp | web (Trading Economics, 16 Oct 2026) |
| Italy | — | 4.51% | — | +2 bp | web (Trading Economics, 16 Oct 2026) |
The USA row is the settled 16 Oct curve, its day change against 15 Oct. The Euro area AAA row's day change is 15 Oct against 14 Oct. The other rows are 16 Oct evening quotes, with Trading Economics's own day changes.
Yield Curve Spreads (US Treasury par curve, 16 Oct 2026): - 10Y-2Y spread: +35 bp, positive, 10 bp outside the ±25 bp flat band and under the 75 bp steep threshold, +2 bp on the day. - 10Y-3M spread: +83 bp, positive, no recession signal, +1 bp on the day.
OAT-Bund Spread: 133 bp (10-year OAT 4.79% against Bund 3.46%, Trading Economics, 16 Oct 2026), against 138 bp on Thursday's quotes.
These positive US spreads are what investors normally demand for lending for longer and do not signal an expected recession. In Europe, Friday's quotes undid Thursday's rally in Germany: the 10-year Bund rose about 5 bp, back to Wednesday's 3.46%, and the 2-year about 4 bp, though Trading Economics's own report earlier in the day had the 10-year little changed near 3.42%, close to a five-week low, so most of the rise came late. France's 10-year was quoted 1 bp lower, which would narrow its extra cost over Germany by 5 bp to 133 bp; the two quotes may not have been taken at the same moment, so treat the narrowing as approximate. Italy's spread over Germany narrowed to about 105 bp. The UK curve steepened: the 2-year gilt fell 3 bp to 4.73% while the 10-year rose 4 bp to 5.40% after Thursday's three-week low, and remains the highest 10-year yield in the table, twelve days before the 28 October budget.
Yield Curve Charts
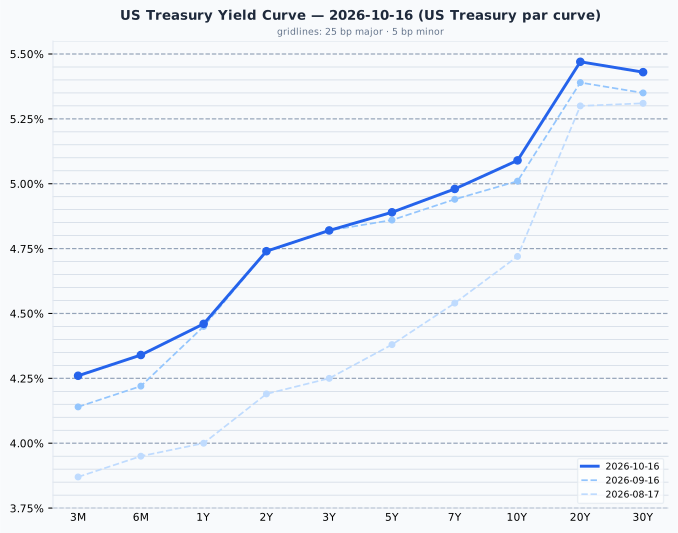
US Treasury par curve, 16 Oct 2026: 3M 4.26%, 6M 4.34%, 1Y 4.46%, 2Y 4.74%, 3Y 4.82%, 5Y 4.89%, 7Y 4.98%, 10Y 5.09%, 20Y 5.47%, 30Y 5.43%; 2-to-10 slope +35 bp. Prior curves: 16 Sep and 17 Aug 2026. The 3-month bill at 4.26% is 38.5 bp above the Fed Funds midpoint of 3.875%, more than the usual 25 bp, consistent with markets allowing for a further rise by December.
The US curve rises from 4.26% at three months to 5.47% at 20 years, with the 30-year 4 bp below the 20-year. Since 16 September the two- and three-year yields are unchanged and every other maturity is higher, by 1 bp at one year to 12 bp at three and six months, with the 10-year up 8 bp, so the 2-to-10 slope has widened from 27 bp to 35 bp.
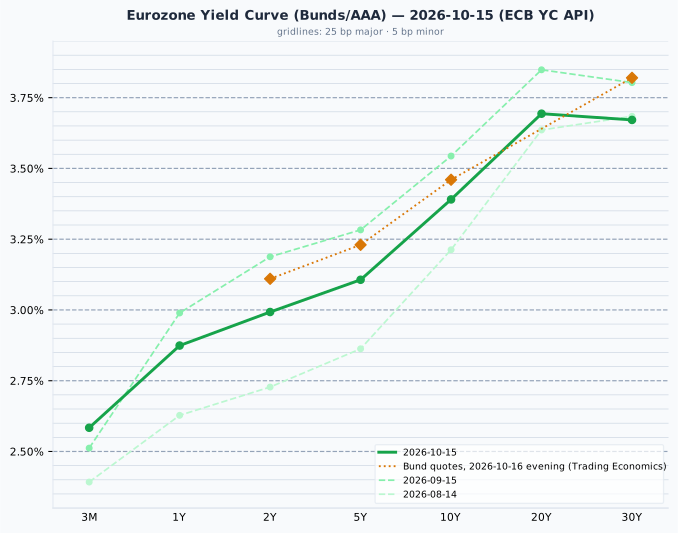
Euro area AAA government curve, 15 Oct 2026 (ECB YC API): 3M 2.58%, 1Y 2.87%, 2Y 2.99%, 5Y 3.11%, 10Y 3.39%, 20Y 3.69%, 30Y 3.67%; 2-to-10 slope +40 bp. Prior curves: 15 Sep and 14 Aug 2026. Today's Bund quotes (Trading Economics, 16 Oct 2026), shown as amber markers, are above the plotted curve by 7 bp at 10 years and 12 to 15 bp at two, five and thirty years. The curve is the ECB's fitted AAA euro-area composite and the quotes are the most recently issued German bonds, which sit a few basis points apart by construction; on Thursday's quotes the Bund was already 9 bp above the curve at two years, 2 bp at ten and 11 bp at thirty, so about 3 to 5 bp of today's gap at each maturity is the day's rise.
The euro AAA curve rises from 2.58% at three months to 3.69% at 20 years, with the 30-year 2 bp below the 20-year. Against 15 September it is lower by 12 to 20 bp from one year out, most at two years, and 7 bp higher at three months, so its 2-to-10 slope has widened from 36 bp to 40 bp; over the same month US yields rose or held steady at every maturity.
Credit Markets (from FRED - authoritative)
| Market | OAS | Obs. date | vs prior obs | Series ID |
|---|---|---|---|---|
| US Investment Grade | 84 bp | 15 Oct 2026 | 0 bp | BAMLC0A0CM |
| US High Yield | 323 bp | 15 Oct 2026 | −2 bp | BAMLH0A0HYM2 |
| Euro High Yield | 336 bp | 15 Oct 2026 | +10 bp | BAMLHE00EHYIOAS |
Change is 15 Oct 2026 vs 14 Oct 2026. Credit spreads are the 15 October close; today's session is not in them yet.
US high-yield spreads, the extra yield on lower-rated company bonds over Treasuries, narrowed 2 bp to 323 bp on 15 October, in the lower part of their normal 300–500 bp range, and investment-grade spreads were unchanged at 84 bp, near the bottom of their 80–150 bp range. Euro high-yield spreads widened 10 bp to 336 bp on the same day. The calm in the broad US market contrasts with CoreWeave, whose bonds yielded more than 15% this week (Reuters): the stress is so far concentrated in a few heavily indebted AI-infrastructure borrowers rather than spread across lower-rated companies in general. The VIX closed at 16.46 on 15 October (FRED VIXCLS), down from 16.87 on 14 October, a moderate reading.
Real Yields (US and Euro Area)
| Region | Nominal 10Y | Expected inflation | Real 10Y | How the real yield is obtained |
|---|---|---|---|---|
| United States | 5.09% (US Treasury par curve, 16 Oct 2026) | 2.35% (residual: nominal − real) | 2.74% (US Treasury real curve, 16 Oct 2026) | Measured. TIPS trade, so the market quotes a real yield directly; expected inflation is the residual (the breakeven) |
| Euro area | 3.39% (ECB YC API, 15 Oct 2026) | 2.04% (ECB SPF, 2026 Q3, measured) | 1.35% (residual: nominal − expected) | Constructed. No euro inflation-linked benchmark is published, so a survey expectation is subtracted from the nominal yield |
Only the US real yield is a market price; the euro figure is derived from a survey and is the softer of the two. Two mismatches apply when comparing them: the US breakeven includes a premium investors demand for inflation risk, which a survey does not, and the survey looks five years ahead against the bond's ten. The US leg is dated 16 October and the euro leg 15 October, the newest curve the ECB has published. The 170 bp gap between US and euro nominal 10-year yields splits into 31 bp of expected-inflation difference (2.35% against 2.04%) and 139 bp of real-rate difference (2.74% against 1.35%), so the gap is almost entirely real. The US real yield fell 4 bp on 16 October, from 2.78% on 15 October.
Why the US real-yield advantage is not a return a euro investor can capture
The US real yield has exceeded the euro one in every quarter since 2014, by 1.52 pp on average, and the 139 bp here is below that mean. It is a structural feature (US trend growth, euro-area savings, the scarcity of German government bonds, heavy US government borrowing), not a return a euro-based reader can capture: hedging the currency removes it, because the forward exchange rate is set from the same interest differential, and holding Treasuries unhedged is a bet on the dollar rather than a bond decision. A real yield is real in its own currency; a US real yield of 2.74% is that much above US inflation, which is not a real return for someone who spends euros. The gap is stated here as a description of relative policy stance and growth expectations, and no portfolio conclusion is drawn from it.
Bond Portfolio Implications
A 10 bp rise in yields is an ordinary day's move. At the 16 Oct 2026 par yields it costs:
| Maturity | Yield | Modified duration | Loss for a 10 bp rise | Months of coupon lost |
|---|---|---|---|---|
| 2-year | 4.74% | 1.89 | 0.19% | 0.5 |
| 10-year | 5.09% | 7.76 | 0.77% | 1.8 |
| 30-year | 5.43% | 14.73 | 1.46% | 3.2 |
Months of coupon lost is the loss divided by one month of coupon (yield ÷ 12) on a par bond. Source: US Treasury par curve, 16 October.
Friday's 1 bp fall at the 10-year gained a holder about 0.08%, after Thursday's 9 bp fall gained about 0.7%. The 30-year pays 0.69 pp more than the 2-year for nearly eight times as much price movement per 10 bp. This week showed both sides of holding long bonds: on Wednesday's inflation figures short yields rose and long yields fell only 2 to 4 bp, little cover against the Nasdaq 100's 2.02% fall, while on Thursday, when chip stocks slumped, they fell and gave cover. Today, with another hot inflation figure and technology shares down 3%, they barely moved. Short maturities keep most of the income with far less exposure to either kind of day.
Currencies & Commodities
Currencies (Yahoo Finance live quotes)
| Pair | Rate | Day chg % | Source |
|---|---|---|---|
| EUR/USD | 1.1227 | +0.06% | yfinance (19:34 CEST) |
| USD Index (DXY, ICE) | 101.91 | −0.14% | yfinance (19:24 CEST) |
| USD/JPY | 158.15 | +0.12% | yfinance (19:34 CEST) |
| GBP/USD | 1.3315 | +0.31% | yfinance (19:34 CEST) |
| USD/CHF | 0.8247 | −0.20% | yfinance (19:34 CEST) |
FX quotes as of 19:34 CEST; day change vs the previous 17:00 ET close.
A quiet day for currencies. The ICE dollar index edged down 0.14% to 101.91, extending Thursday's 0.43% fall, and the euro was little changed at $1.1227. The pound rose 0.31% to $1.3315 and the Swiss franc 0.20%. The yen was the exception, weakening 0.12% to 158.15 per dollar despite a Bank of Japan board member's call for further rate rises, and so fell about 0.2% against the euro.
Commodities (Yahoo Finance front-month futures)
| Commodity | Price | Day Chg % | Ticker | Source |
|---|---|---|---|---|
| Brent Crude ($/bbl) | 109.86 | +3.72% | BZ=F | yfinance (BZZ26, Dec) |
| WTI Crude ($/bbl) | 99.02 | +2.61% | CL=F | yfinance (CLZ26, Dec) |
| Gold ($/oz) | 4,181.10 | +0.26% | GC=F | yfinance (GCZ26, Dec) |
| Silver ($/oz) | 57.305 | +0.26% | SI=F | yfinance (SIZ26, Dec) |
| Copper ($/lb) | 6.5735 | +0.26% | HG=F | yfinance (HGZ26, Dec) |
| Nat Gas ($/MMBtu) | 3.116 | −3.71% | NG=F | yfinance (NGX26, Nov) |
Day changes are settlement-to-settlement: 16 Oct 2026 settlement vs 15 Oct 2026 settlement.
Both oil rows show the same December contracts as Thursday's table, so the levels are comparable. The December Brent contract (BZZ26) settled at $109.86, up 3.72% from its Thursday settlement of $105.92, and the December WTI contract (CLZ26) at $99.02, up 2.61% from $96.50. Brent rose more because the sinking of the GFS Pride after an Iranian strike threatens the seaborne trade through the Strait of Hormuz that Brent prices, while WTI is priced at a US inland delivery point; the gap between the two December contracts widened to $10.84 from $9.42 at Thursday's settlements. December Brent is 12.88% below the 52-week high of $126.10 set by an earlier contract (range $58.72 to $126.10), and December WTI 17.12% below its $119.48 high (range $54.98 to $119.48). The November WTI contract (CLX26), which the WTI row showed until Wednesday, expires on 20 October.
Gold settled 0.26% higher at $4,181.10, 25.15% below its all-time high of $5,586.20 set on 29 January 2026, and silver 0.26% higher at $57.305, 52.76% below its all-time high of $121.30 set the same day. Copper edged up 0.26% to $6.5735, slightly below its all-time high of $6.83 set on 22 September (3.76% below it). Natural gas fell 3.71% to $3.116, in the lower part of its 52-week range of $2.483 to $7.827.
Sector & Theme Highlights
US sector funds (Select Sector SPDRs, 16 Oct close): six of the eleven rose and five fell, and technology and communication services fell most, with consumer discretionary, health care and industrials also slightly lower. Technology (XLK) −3.02% fell most, followed by communication services (XLC) −1.89%, home of Meta and Alphabet, consumer discretionary (XLY) −0.84%, health care (XLV) −0.27% and industrials (XLI), barely changed at −0.08%. Energy (XLE) +2.52% led with oil, followed by utilities (XLU) +1.34%, consumer staples (XLP) +1.08%, materials (XLB) +0.71%, financials (XLF) +0.45% and real estate (XLRE) +0.40%. Utilities and consumer staples are the sectors investors buy when they want earnings that do not depend on growth or on AI.
- Doubts about AI spending, now in New York: after Thursday's falls of 7.57% in Seoul and 4.90% in Tokyo, Asia bounced and the US sold. CoreWeave's debts, a report that some Anthropic investors are weighing a lower valuation for its share listing, and rising borrowing costs all point at the same question: whether the money borrowed to build AI capacity will earn enough to be repaid. The demand for chips is not in doubt (TSMC's results on Thursday showed that); the price paid for it and how it is financed are.
- Inflation that keeps surprising: import prices up 1.1% in September, after producer prices up 1.3% and consumer prices above forecasts earlier in the week; euro-area inflation confirmed at 3.8%.
- Oil and the Strait of Hormuz: Brent up 3.7% after a container ship sank following an Iranian strike, despite the IEA's release of 100 million barrels.
- Europe over the US this week: the STOXX 600 up 2.09% and the FTSE 100 3.13% since last Friday, against a 5.49% fall in the Nasdaq 100, with European banks leading today.
Top Stories (Global)
- Nasdaq 100 falls 2.50% as AI stocks fall again. CoreWeave dropped nearly 12% and Micron more than 5%, and the Philadelphia chip index fell 3.83%, its eighth fall in a row and 11.42% on the week; the Nasdaq 100 lost 5.49% on the week (TradingKey, CNN, Yahoo Finance).
- Report: some Anthropic investors weigh a lower IPO valuation. The AI developer's third-quarter revenue was reported this week at $16.8 billion, up about 45% on the quarter, with growth slowing (Reuters, CNBC).
- Kospi rebounds 2.05% but loses 14.46% on the week. Its worst week since October 2008 ended with Samsung Electronics up 2.62%; the Nikkei 225 rose 1.39% and lost 5.37% on the week (TradingKey, Korea JoongAng Daily).
- Brent settles 3.7% higher at $109.86. The container ship GFS Pride sank in the Strait of Hormuz after being hit by an Iranian projectile; IEA members agreed to release the remaining 100 million barrels of emergency stocks (Trading Economics).
- US import prices rise 1.1% in September. The annual rate of 8.1% is the highest since July 2022; industrial production rose 0.7% (Rallies, yournews).
- Warsh: spending surge adds to inflation. Markets increasingly expect the Fed to hold on 28 October, with Barclays forecasting rises in December and January (Reuters).
- Euro-area inflation confirmed at 3.8%. Energy prices up 18.9% on a year earlier; Spain at 5.0%, Italy 4.2% (Eurostat).
- ECB clears UniCredit to raise its Commerzbank stake. UniCredit rose 1.4% as European banks led the STOXX 600 up 0.72% (Trading Economics).
Looking Ahead
- Next week: Germany's ZEW survey and UK labour figures on 20 October, the day of the first French vote on budget revenue and of the November WTI contract's expiry; Moody's review of France on 23 October.
- Later: Brazil's presidential runoff on 25 October; the Fed meets on 27–28 October; the UK budget on 28 October (Trading Economics); the Bank of Japan meets on 29–30 October; US midterm elections on 3 November; the euro-area flash inflation estimate for October on 4 November (Eurostat).
Market closures - None in the next five days. - Indian market holidays are not covered.
Data sources: US Treasury par and real curves (16 Oct 2026) and FRED (policy rates, VIX, credit spreads, CPI and labour data); ECB YC API (AAA curve, 15 Oct 2026) and ECB SPF (2026 Q3); equity indices, ETF P/E proxies, commodity futures and sector funds via Yahoo Finance (16 Oct close, plus the Philadelphia Semiconductor Index ^SOX daily closes) and FX via Yahoo Finance (as of 19:34 CEST); European, UK and Japanese bond yields, economic releases and news via web search (Trading Economics, Reuters via MarketScreener, CNBC, CNN, Quartz, Korea JoongAng Daily, TradingKey, Eurostat, Rallies, yournews, FXStreet).