2026 09 24
Global Financial Briefing — Thursday, 24 September 2026
Americas index levels, US sector funds, US-listed EM funds, commodities and day changes reflect the 24 Sep closing print (commodities the 24 Sep settlement), and the US Treasury curve is the 24 Sep close. The euro AAA curve is the 23 Sep curve, the latest the ECB has published. FX and macro figures are dated inline.
Market Overview
Bond yields kept rising today, a day after the 23 September session in which the US 10-year Treasury settled at 5.11% on the Treasury par curve, up 15.0 bp and at a level the press reports as the highest since 2007. It settled a further 7 bp higher on 24 September, at 5.18%, with the 30-year at 5.47%, up 7 bp. Two things kept the pressure on. Oil jumped again: the November Brent contract (BZX26) settled at 106.60, up 3.41%, after a senior Iranian military official said Tehran could widen the war to the Indian Ocean if attacked, which hurt the chances of a deal to reopen the Strait of Hormuz. Oil gave back part of the rise later, when Reuters reported that US and Iranian negotiators were exploring a phased plan under which Iran would reopen the strait and the US would lift its blockade. And the data stayed strong: US weekly jobless claims came in at 197,000 against 201,000 expected, and Germany's Ifo business climate index rose to 89.9, its highest since May 2023. Higher oil prices feed straight into inflation expectations, and strong activity data makes further rate rises more likely, so bonds sold off on both.
US equities ended close to flat. The S&P 500 closed down 0.02% after erasing a larger loss on the Reuters Hormuz report, the Nasdaq 100 closed up 0.03%, and the Dow fell 0.31%. Technology fell 0.32% (XLK) after Oracle sent a force majeure notice to the Blue Owl unit that is developing its $165 billion Project Jupiter data centre in New Mexico, a legal step that would let Oracle delay payments if the campus is not running by 2028 as planned; Oracle shares fell about 4% on the news. Communication services (+1.27%) and health care (+0.63%) were the strongest US sectors, materials (−1.19%) the weakest.
Europe closed lower across the board: the STOXX 600 fell 0.55%, the DAX 0.57% and the CAC 40 0.52%, all three now below their 50-day averages. The German 10-year Bund rose 4.1 bp to 3.59% while the 2-year slipped 1 bp to 3.27%, so the German curve steepened. For a France-based reader the notable figure is the French 10-year OAT: it rose 8.0 bp to 4.72%, widening its premium over the Bund to 113 bp from 108.5 bp yesterday, and France now pays 22 bp more than Italy (4.50%) to borrow for ten years. The Swiss National Bank held its policy rate at 0% and raised its inflation forecasts, and the franc weakened, the dollar rising 0.47% to 0.8284 francs. In Asia, Tokyo reopened after its holidays and the Nikkei 225 rose 0.76% on its 18 September close, while the Japanese 10-year yield rose 9.5 bp over the same period to 3.08%. Chinese and Indian shares fell (Shanghai −1.22%, Nifty 50 −1.64%) and Korea was closed for Chuseok.
Global Indices Snapshot
Americas
| Index | Level | Day Chg | Day Chg % | Source |
|---|---|---|---|---|
| S&P 500 | 7,704.13 | −1.90 | −0.02% | yfinance ^GSPC |
| Nasdaq 100 | 30,478.86 | +8.56 | +0.03% | yfinance ^NDX |
| Dow Jones | 51,349.98 | −161.62 | −0.31% | yfinance ^DJI |
| Brazil IBOV | 183,965.90 | −1,848.20 | −0.99% | yfinance ^BVSP |
Americas data reflects the 24 Sep close. The S&P 500 is 1.44% below its record of 7,816.70 and 0.98% above its 50-day average (7,629); the Nasdaq 100 is 0.92% below its record.
Europe
| Index | Level | Day Chg | Day Chg % | Source |
|---|---|---|---|---|
| Euro STOXX 600 | 636.43 | −3.49 | −0.55% | yfinance ^STOXX |
| CAC 40 | 8,081.43 | −41.98 | −0.52% | yfinance ^FCHI |
| DAX | 25,266.53 | −144.10 | −0.57% | yfinance ^GDAXI |
| FTSE 100 | 10,679.99 | −25.27 | −0.24% | yfinance ^FTSE |
| SMI (Swiss) | 13,905.82 | −15.90 | −0.11% | yfinance ^SSMI |
European data reflects today's close (24 Sep). All five indices are below their 50-day averages: the STOXX 600 by 1.86%, the DAX by 2.04%, the FTSE by 0.76%, the SMI by 2.61% and the CAC 40 by 3.73%. All remain above their 200-day averages except the CAC, which is 1.95% below its own (8,242). The Euro STOXX 50 closed at 6,272.50, down 0.43%.
Asia-Pacific
| Index | Level | Day Chg | Day Chg % | Source |
|---|---|---|---|---|
| Nikkei 225 | 65,513.99 | +495.04 | +0.76% | yfinance ^N225 |
| Hang Seng | 24,761.13 | −72.99 | −0.29% | yfinance ^HSI |
| Shanghai Comp | 3,888.37 | −48.15 | −1.22% | yfinance 000001.SS |
| ASX 200 | 8,702.00 | −63.30 | −0.72% | yfinance ^AXJO |
| Kospi (Korea) | 7,080.92 † | — | — | yfinance ^KS11 |
Asia-Pacific data reflects today's close (24 Sep). The Nikkei's change is measured from 18 September, its last session before the Tokyo holidays (21 September, Respect for the Aged Day, and 23 September, Autumnal Equinox Day). † Kospi: 24 September is Chuseok, market closed today; the level is the 23 September close.
Emerging Markets
| Index | Level | Day Chg % | Source |
|---|---|---|---|
| MSCI EM (EEM) | 67.25 | −0.68% | yfinance EEM |
| India Nifty 50 | 23,063.10 | −1.64% | yfinance ^NSEI |
| South Africa | 65.90 | −0.81% | yfinance EZA |
EEM and EZA are US-listed dollar funds; figures are their 24 Sep New York close. The Nifty 50 closed 24 Sep and is now 3.97% above its 52-week low of 22,182.55 and 5.66% below its 200-day average.
Index Valuations & Investment Risk
Valuation Table
| Index | Trailing P/E (live) | 50-day avg | 100-day avg | 200-day avg |
|---|---|---|---|---|
| S&P 500 | 24.8x | 25.8x | — | — |
| Nasdaq 100 | 30.1x | 30.4x | — | — |
| Euro STOXX 600 | 17.5x | 18.2x | — | — |
| CAC 40 | 16.5x | 17.3x | — | — |
| DAX | 17.9x | 18.7x | — | — |
| FTSE 100 | 15.2x | 17.5x | — | — |
| Nikkei 225 | 21.7x | 21.7x | — | — |
| MSCI EM | 14.3x | 16.2x | — | — |
Trailing P/E from yfinance trailingPE on the ETF proxies SPY, QQQ, EXSA.DE, CAC.PA, EXS1.DE, ISF.L, 1321.T and EEM. Averages of the daily trailing P/E readings recorded since 1 May 2026 (n = 96); shown for reference only.
Investment Risk Assessment for ETF Investors
United States (S&P 500 / Nasdaq ETFs)
The S&P 500 at 24.8x trailing earnings has an earnings yield of 4.04% (1÷24.77). Against the 10-year Treasury at 5.18% (US Treasury par curve, 24 Sep) the earnings yield gap is negative 1.14 pp: a buyer today accepts equity risk for 1.14 pp less current income than a ten-year bond pays. Measured against the 10-year real yield of 2.85% (US Treasury real curve, 24 Sep) the gap is positive 1.19 pp. The correction is the expected inflation of 2.33 pp that the nominal comparison leaves out, and it is large enough to flip the sign. Only part of the earnings yield reaches an investor as cash (dividends and buybacks); the rest is reinvested by the companies. The Nasdaq 100 at 30.1x earns 3.32%, 1.86 pp below the Treasury.
The index is 1.44% below its record, above its 50-day (7,629) and 200-day (7,197) averages, so the level still reflects a market close to its highs while the bond yield it is compared against has risen 22 bp in two sessions. Today's Oracle notice shows the index's exposure to setbacks in spending on artificial intelligence data centres, with the technology sector down 0.32% on the news. Rising real yields raise the rate at which future profits are discounted, which weighs most on the highest-multiple shares.
Risk score: High valuation risk / low margin of safety.
Europe (STOXX 600 / CAC 40 / DAX ETFs)
The STOXX 600 at 17.5x earns 5.71%, a gap of positive 2.12 pp over the 10-year Bund at 3.59% (TradingEconomics, 24 Sep intraday), and positive 4.22 pp over the euro real 10-year of 1.49%. The DAX at 17.9x earns 5.59% (+2.00 pp over the Bund). The CAC 40 at 16.5x earns 6.07%, but measured against France's own borrowing cost, the OAT at 4.72%, its gap is positive 1.34 pp, the narrowest of the three and below yesterday's 1.39 pp. Europe trades at a discount of about 7.3 multiple points to the US (17.5x against 24.8x).
Part of the difference between the US and euro gaps is simply the difference between US and euro-area inflation and policy paths rather than a difference in risk compensation, so the real-yield versions are the check: 1.19 pp for the US against 4.22 pp for the euro area. Europe's advantage survives the correction. For a euro investor holding euro-quoted funds the quoted value carries no currency conversion, but the currency exposure sits inside the earnings: many CAC 40 and STOXX 600 companies earn a large share of their profits outside the euro area, so a stronger euro lowers those profits in euro terms. The specific European risk is French: the OAT premium over the Bund widened to 113 bp today, so French public finances are costing more to fund even as the Ifo points to improving German activity.
Risk score: Moderate, fair value with mixed signals.
Japan (Nikkei / TOPIX ETFs)
The Nikkei at 21.7x earns 4.60%, a gap of +1.52 pp over the 10-year JGB at 3.08%. The Bank of Japan raised its policy rate to 1.25% from 1.00% at its September meeting in a 7-2 vote, its second rise this year after the 16 June move to 1.00% from 0.75%, and the 10-year yield rose 9.5 bp between the 18 September close and today as Tokyo reopened. The yen is weak at 158.91 per dollar (+0.39% for the dollar today). For a euro investor an unhedged Japanese fund is partly a bet on the yen; a currency-hedged fund removes that exposure.
Risk score: Moderate.
Emerging Markets (MSCI EM ETFs)
EEM at 14.3x earns 7.00%, the highest earnings yield in the table and a clear discount to developed markets. EEM fell 0.68% in New York, and this time the local markets agree: Shanghai fell 1.22%, India's Nifty 1.64% and the Hang Seng 0.29%, with Korea closed, so the fall is not only New York repricing emerging markets after their close. A stronger dollar (the ICE dollar index up 0.23%) and higher US real yields (up 13 bp to 2.76% on 23 Sep and a further 9 bp to 2.85% on 24 Sep) hurt emerging-market shares in two ways. For a euro investor the currency conversion largely cancels, because the euro has also fallen against the dollar (−0.16% today). The economic effect does not cancel: companies and governments with dollar debt pay more to service it, capital is drawn towards higher-yielding US bonds, and local central banks may have to raise rates to defend their currencies, all of which lowers local share prices whatever the investor's home currency.
Risk score: Attractive relative valuation, with high rate and currency sensitivity.
Overall Risk Score: Moderate. Valuations are high in the US and reasonable elsewhere, but a 10-year Treasury above 5% raises the bar every equity market must clear.
US Economic Indicators (FRED - authoritative)
| Indicator | Current | Prior | Delta | Reference Date | FRED Series |
|---|---|---|---|---|---|
| CPI YoY % | 3.35% | 3.30% | +0.05 pp | Aug 2026 (prior Jul) | CPIAUCSL |
| Core CPI YoY % | 2.45% | 2.47% | −0.02 pp | Aug 2026 (prior Jul) | CPILFESL |
| Unemployment Rate | 4.1% | 4.1% | 0.0 pp | Aug 2026 (prior Jul) | UNRATE |
| Nonfarm Payrolls | +162k | +21k | +141k | Aug 2026 (prior Jul), monthly chg | PAYEMS |
| 10Y TIPS Real Yield | 2.76% | 2.63% | +0.13 pp | 23 Sep 2026 (prior 22 Sep) | DFII10 (US Treasury real curve) |
Headline inflation is running almost a point above core, the gap that oil above $100 keeps open.
Other economic releases today (web search):
| Release | Actual | Consensus | Prior | Note |
|---|---|---|---|---|
| Germany Ifo business climate (Sep) | 89.9 | 89.1 | 88.8 | Highest since May 2023; expectations 90.4 (from 89.0), current conditions 89.5 (from 88.5) |
| US initial jobless claims (week) | 197k | 201k | — | Lower than expected |
| SNB policy rate | 0.00% | 0.00% | 0.00% | Held; inflation forecast raised to 0.7% for 2026 and 0.8% for 2027 and 2028 |
The Ifo survey asks German firms about their current business and their expectations; both components improved, and the ifo Institute reported that the services climate turned positive again and manufacturing expectations improved, particularly in electrical equipment. Together with low jobless claims, it added to the evidence that activity is holding up on both sides of the Atlantic, which is what keeps markets expecting higher policy rates.
Fixed Income & Bond Analysis
Policy Rates
| Central Bank | Rate | Source |
|---|---|---|
| Fed Funds (upper) | 4.00% | FRED DFEDTARU (24 Sep) |
| Fed Funds (lower) | 3.75% | FRED DFEDTARL (24 Sep) |
| Effective FFR | 3.88% | FRED DFF (22 Sep) |
| ECB Deposit Rate | 2.50% | FRED ECBDFR (24 Sep) |
| BOJ Policy Rate | 1.25% | web search |
| BOE Bank Rate | ~3.73% (SONIA/FRED) | FRED IUDSOIA (22 Sep) |
| SNB Policy Rate | 0.00% | web search (held 24 Sep) |
The Fed raised its target range to 3.75–4.00% on 16 September, its first hike since 2023. The ECB deposit rate has been 2.50% since 10 September, its second hike this year after 17 June's move to 2.25%.
Government Bond Yields
| Country | 2Y Yield | 10Y Yield | 30Y Yield | Day Chg (10Y) | Source |
|---|---|---|---|---|---|
| USA | 4.87% | 5.18% | 5.47% | +7.0 bp | US Treasury par curve (2026-09-24) |
| Germany | 3.27% | 3.59% | 3.85% | +4.1 bp | web (TradingEconomics, 24 Sep) |
| France | — | 4.72% | — | +8.0 bp | web (TradingEconomics, 24 Sep) |
| UK | 4.79% | 5.35% | 5.85% | +1.0 bp | web (TradingEconomics, 24 Sep) |
| Japan | — | 3.08% | — | +9.5 bp | web (TradingEconomics, 24 Sep) |
| Italy | — | 4.50% | — | +1.3 bp | web (TradingEconomics, 24 Sep) |
USA row: 24 Sep settled close vs 23 Sep, one date for the whole row. European, UK and Japanese yields are intraday quotes around 20:00 CEST. Japan's change is against the 18 Sep close, Tokyo having been closed 21 and 23 Sep.
Yield Curve Spreads (US Treasury par curve, 24 Sep):
- 10Y-2Y spread: +31 bp. Positive and outside the ±25 bp range usually called flat; the curve is gently upward-sloping, not inverted. On 24 September the 10-year rose 7 bp and the 2-year only 2 bp, so the curve steepened by 5 bp: after 23 September's rise at both ends, this session's rise came mainly from the extra yield demanded for holding long bonds rather than from the expected path of Fed rates.
- 10Y-3M spread: +94 bp. Firmly positive and not a recession signal. The 3-month bill at 4.24% sits 37 bp above the Fed funds midpoint of 3.875%, which is the bill market expecting the Fed to raise rates again within the next few months.
OAT-Bund Spread: 113 bp (France 4.72% less Germany 3.59%, TradingEconomics, 24 Sep intraday), up from 108.5 bp on 23 September and 104 bp on 22 September. The BTP-Bund spread is 91 bp, so France pays 22 bp more than Italy for ten-year money. French yields rose 8 bp today against 4 bp for Germany and about 1 bp for Italy, so the widening came from French bonds specifically, not from a general move in the higher-yielding euro-area countries.
Yield Curve Charts
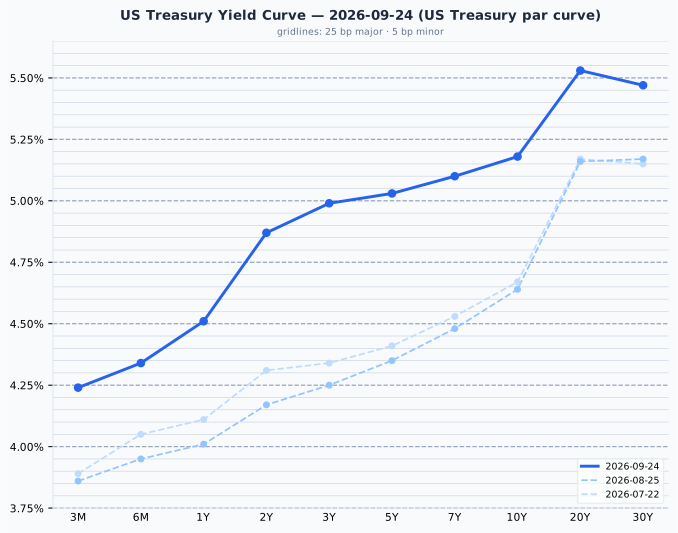
The US curve slopes upward throughout except for a slight dip between 20 and 30 years, with every maturity from 2 years out above 4.8%. Since 25 August it has shifted up by 54 bp at the 10-year (4.64% to 5.18%) and 70 bp at the 2-year (4.17% to 4.87%), so the short end has risen the most: the rise is led by the Fed's September hike and the expectation of more to come.
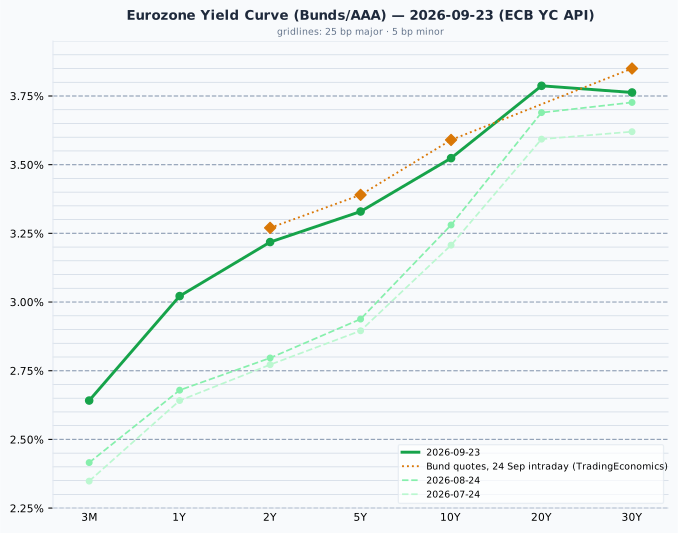
The euro AAA curve slopes upward from 2.64% at 3 months to 3.79% at 20 years, flattening slightly beyond. Since 24 August it has risen by 42 bp at the 2-year (2.80% to 3.22%) and 24 bp at the 10-year (3.28% to 3.52%), again led by the short end after the ECB's 10 September hike. Today's Bund quotes sit 5 to 9 bp above the plotted 23 September curve, the largest gap at 30 years (3.85% against 3.76%); the curve is the ECB's fitted AAA euro-area curve and the quotes are individual German bonds, which normally sit a few bp apart (yesterday's 10-year gap was 3.5 bp), so only a few bp of today's gap is a day move.
Credit Markets (from FRED, authoritative)
| Market | OAS | Obs. date | vs prior obs | Series ID |
|---|---|---|---|---|
| US Investment Grade | 77 bp | 23 Sep | 0 bp | BAMLC0A0CM |
| US High Yield | 273 bp | 23 Sep | +5 bp | BAMLH0A0HYM2 |
| Euro High Yield | 266 bp | 23 Sep | −6 bp | BAMLHE00EHYIOAS |
Change is 23 Sep vs 22 Sep.
Credit spreads are the 23 Sep close; today's session is not in them yet. On 23 September, the day the 10-year rose 15 bp, US high yield widened 5 bp while investment grade did not move and euro high yield tightened 6 bp. All three remain historically tight: US high yield at 273 bp is below the 300–500 bp normal range and investment grade at 77 bp is below its 80–150 bp range. Lenders are still charging companies little for default risk even as the risk-free rate rises. The VIX, at 14.21 (FRED VIXCLS), is low, but its latest reading is 22 September and does not yet include either this week's bond selloff or today's session.
Real Yields (US and Euro Area)
| Region | Nominal 10Y | Expected inflation | Real 10Y | How the real yield is obtained |
|---|---|---|---|---|
| United States | 5.18% | 2.33% (nominal − real) | 2.85% | Measured. TIPS trade, so the market quotes a real yield directly; expected inflation is the residual (the breakeven) |
| Euro area | 3.52% | 2.04% (ECB SPF, 2026 Q3) | 1.49% (nominal − expected) | Constructed. No euro inflation-linked benchmark is published, so a survey expectation is subtracted from the nominal yield |
The two legs carry different dates: the US leg is 24 September (US Treasury curves), the euro leg 23 September (ECB AAA curve, the latest the ECB has published). Only the US real yield is a traded market price; the euro figure is derived from a survey and is the softer of the two. The US breakeven also carries an inflation risk premium that a survey does not, and the SPF horizon is 5 years against the bond's 10. The 166 bp nominal gap between the two 10-year yields splits into 29 bp of expected-inflation difference and 136 bp of real-rate difference, so it is overwhelmingly a difference in real rates. The US real yield rose 13 bp on 23 September (2.63% to 2.76%) and a further 9 bp on 24 September (to 2.85%), more than that day's 7 bp nominal rise, so the breakeven slipped 2 bp even as oil climbed.
Why the US real-yield advantage is not a return a euro investor can capture
A 2.85% real yield is real in dollars, above US inflation, not above euro inflation. A euro investor who hedges a Treasury back into euros gives up the interest-rate difference in the cost of the hedge, which leaves a return close to the euro bond's; unhedged, the extra yield becomes a bet on the dollar rather than a bond decision. The gap describes the two economies' different policy stances and growth expectations and is not a reason to switch into US bonds.
Bond Portfolio Implications
The earnings yield gap compares today's income on each asset, using quoted prices only; it leaves out earnings growth and does not forecast which will do better.
- S&P 500: 4.04% earnings yield (1÷24.77) less the 10-year Treasury at 5.18% = −1.14 pp. Bonds pay more current income than US equities. Against the real yield the gap is +1.19 pp; the difference is expected inflation, which the earnings behind a share can grow with and a fixed coupon cannot.
- Euro area: 5.71% earnings yield (1÷17.52) less the Bund at 3.59% = +2.12 pp; +4.22 pp against the euro real yield of 1.49%.
With the Treasury above 5%, US investors can now lock in more nominal income from a government bond than from the S&P 500's earnings. In Europe equities still out-earn the Bund comfortably.
A 10 bp rise in yields is an ordinary day's move. At the settled 24 September par yields it costs:
| Maturity | Yield | Modified duration | Loss for a 10 bp rise | Months of coupon lost |
|---|---|---|---|---|
| 2-year | 4.87% | 1.88 | 0.19% | 0.5 |
| 10-year | 5.18% | 7.73 | 0.77% | 1.8 |
| 30-year | 5.47% | 14.66 | 1.45% | 3.2 |
The 7 bp rise at the 10-year on 24 September cost a holder about 0.5%, or 1.3 months of coupon, on top of the 15 bp rise the day before. A 2-year note now yields 4.87% for a quarter of the 10-year's day-to-day price risk, and while the market keeps expecting more rate rises, shorter maturities offer most of the income for much less of the loss on each bad day.
Currencies & Commodities
Currencies
| Pair | Rate | Day chg % | Source |
|---|---|---|---|
| EUR/USD | 1.1370 | −0.16% | yfinance (19:57 CEST) |
| USD Index (DXY, ICE) | 101.33 | +0.23% | yfinance (19:47 CEST) |
| USD/JPY | 158.91 | +0.39% | yfinance (19:57 CEST) |
| GBP/USD | 1.3212 | −0.24% | yfinance (19:57 CEST) |
| USD/CHF | 0.8284 | +0.47% | yfinance (19:57 CEST) |
FX quotes as of 19:57 CEST (dollar index 19:47); day change vs the previous 17:00 ET close.
The dollar rose against every currency in the table, most against the franc after the SNB held at 0% while US yields kept climbing: the gap between Swiss and US short-term rates is now almost 4 percentage points. The euro slipped 0.16% to 1.1370 despite the strong Ifo.
Commodities
| Commodity | Price | Day Chg % | Ticker | Source |
|---|---|---|---|---|
| Brent Crude | 106.60 | +3.41% | BZX26.NYM | yfinance |
| WTI Crude | 94.61 | +2.66% | CL=F | yfinance |
| Gold ($/oz) | 4,298.00 | −0.47% | GC=F | yfinance |
| Silver ($/oz) | 64.00 | −1.48% | SI=F | yfinance |
| Copper ($/lb) | 6.790 | +0.54% | HG=F | yfinance |
| Nat Gas ($/MMBtu) | 3.370 | +6.88% | NG=F | yfinance |
Prices are the 24 Sep settlement; day changes are settlement vs settlement (24 Sep vs 23 Sep).
A note on which contracts these are. The Brent row is the November contract (BZX26), which expires on 30 September, while yesterday's table showed the December contract (BZZ26) at 98.12, so the two levels are not comparable: the November contract settled at 103.08 on 23 September, about $5 above December, and that gap is the premium the market pays for oil delivered sooner, not a price move. The December contract, next in line when November expires, settled at 100.22 on 24 September, up 2.14%. The +3.41% compares the November contract with its own previous settlement and is not distorted. WTI is the November contract (CLX26), expiring 20 October, and natural gas is also November (NGX26).
Oil led the day on the Iranian threat to widen the war, and pared its gain on the Reuters report of a phased plan to reopen Hormuz. Brent is 15.5% below its 52-week high of 126.10 and WTI 20.8% below its own of 119.48; both all-time highs date from July 2008 and describe a different market. Natural gas rose 6.88% to 3.370, in the lower half of its 52-week range (2.483 to 7.827). Gold at 4,298.00 is 23.1% below its all-time high of 5,586.20 (29 January 2026) and fell 0.47%; gold pays no income, so higher real yields raise what an investor gives up by holding it. Silver at 64.00 is 47.2% below its all-time high of 121.30, set the same day. Copper, at 6.790, is at/near its all-time high, 0.59% below the 6.830 record set on 22 September.
Sector & Theme Highlights
US sector funds at the 24 Sep close: communication services +1.27% (XLC), health care +0.63% (XLV), energy +0.37% (XLE), financials −0.02% (XLF), consumer discretionary −0.30% (XLY), technology −0.32% (XLK), real estate −0.45% (XLRE), industrials −0.75% (XLI), consumer staples −0.89% (XLP), utilities −0.98% (XLU) and materials −1.19% (XLB). Energy moved with oil and technology fell on the Oracle news; the income-oriented sectors, staples, utilities and real estate, fell further as the 10-year settled 7 bp higher.
- AI infrastructure: Oracle's force majeure notice on Project Jupiter, the New Mexico campus central to the Stargate AI announcement with OpenAI and SoftBank, puts a date risk on one of the largest announced AI data centre projects. The trigger was a natural gas pipeline meant to power the site, delayed by about six months to 1 February 2027 after repeated route-permit refusals. Oracle remains the tenant; the notice lets it defer payments if the site misses its 2028 start. It also touches private credit: the developer is a unit of Blue Owl Capital, whose shares, according to 24/7 Wall St., had already fallen more than 45% over the past year.
- Energy and inflation: oil above $100 with the Strait of Hormuz still contested keeps headline inflation above core (3.35% against 2.45% in August) and is the main reason yields are rising alongside strong data.
- Europe: German business confidence is at its best since May 2023 while French borrowing costs rise; the gap between the two countries' bonds, not the region's growth, is the euro-area risk to watch.
Top Stories (Global)
- The 10-year Treasury extended its rise, settling at 5.18% on 24 September (+7 bp) after 5.11% on 23 September, which the press reported as the highest since 2007; the 30-year settled at 5.47%, up 7 bp, a level the same reports put at its highest since 2004.
- Oracle sent a force majeure notice to Blue Owl's development unit over its $165 billion Project Jupiter data centre, citing a delayed gas pipeline; Oracle shares fell about 4% and the technology sector 0.32%.
- Brent jumped 3.41% to settle at 106.60 (November contract) after an Iranian military official threatened to extend the war to the Indian Ocean; it pared gains on a Reuters report that US and Iranian negotiators are exploring a phased reopening of the Strait of Hormuz in exchange for the US lifting its blockade.
- Germany's Ifo index rose to 89.9 in September from 88.8, above the 89.1 expected and the highest since May 2023, with both current conditions and expectations improving.
- The SNB held its policy rate at 0% and raised its inflation forecasts to 0.7% for 2026 and 0.8% for 2027 and 2028; the dollar rose 0.47% against the franc.
- France's 10-year OAT rose 8 bp to 4.72%, taking its spread over the Bund to 113 bp and its premium over Italy to 22 bp.
- US jobless claims fell to 197,000, below the 201,000 expected, a sign of a labour market strong enough to support further Fed hikes.
Looking Ahead
- Friday 25 September: US durable goods orders (08:30 ET), a gauge of business investment.
- Tuesday 29 September: US consumer confidence and JOLTS job openings (10:00 ET).
- Wednesday 30 September: US GDP and personal income and outlays, including the PCE price index the Fed targets (08:30 ET). After this week's rise in yields, the PCE reading is the next test of whether the market's expectation of further Fed hikes holds.
- Thursday 1 October: US ISM manufacturing and weekly jobless claims; the September employment report follows on Friday 2 October.
- Middle East: any progress, or setback, in the US-Iran talks on reopening the Strait of Hormuz moves oil, and through oil the inflation outlook and bond yields.
- Oracle and AI capex: watch for responses from Blue Owl and other data centre developers, and for any change in spending plans from the largest technology companies.
- France: budget and fiscal news, with the OAT-Bund spread at 113 bp.
Market closures - Friday 25 September: Korea closed (Chuseok). - Saturday 26 September: Korea closed (Chuseok), a weekend date. - No Indian holiday data is available here, so Indian closures are not checked.