2026 07 07
Global Financial Briefing — Tuesday, 7 July 2026
Market Overview
Markets are in rotation-mode rather than broad risk-off today. A chipmaker selloff is dragging the Nasdaq 100 down 1.46% intraday (semiconductor sub-index down roughly 6%) on renewed doubts about whether massive AI capital spending will pay off, even as most S&P 500 constituents are higher — a sector rotation, not a market-wide flight from risk. The headline event is SpaceX's IPO — reportedly the largest ever — and its simultaneous entry into the Nasdaq-100 under newly created "fast-track" mega-IPO rules, with the company's market cap now exceeding $2 trillion. Meanwhile the four major hyperscalers have raised combined 2026 AI capex guidance to roughly $750 billion, on a path to cross $1 trillion in 2027 — fuel that keeps the AI-spend-versus-payoff debate alive rather than resolving it.
Asia-Pacific saw the sharpest single-day dislocation: South Korea's Kospi plunged 4.91% and triggered a trading-halt circuit breaker after falling more than 8% intraday. Japan's Nikkei 225 fell 2.12% as the AI-hardware selloff spilled over, while the 10-year JGB yield climbed to 2.82% — its highest level since 1997 — compounding the Bank of Japan's June rate hike to 1.00% (the highest since 1995) with fresh fiscal-spending and bond-supply concerns. Europe closed the day modestly softer and mixed (DAX -1.37%, FTSE 100 +0.13%), a fairly muted session by comparison.
The bigger structural story remains US valuation and rates. The S&P 500 trades at a trailing P/E of 26.93x (SPY proxy) — 58% above the midpoint of its historical 16–18x range — while the 10-Year Treasury yield sits at 4.49% (FRED DGS10, 2026-07-02) and the 10Y TIPS real yield at 2.26% (FRED DFII10, 2026-07-02). That combination pushes the S&P 500's equity risk premium into negative territory (see Bond Portfolio Implications below). US headline CPI has also accelerated sharply over the past four months, from 2.39% YoY in January to 4.17% YoY in May (FRED CPIAUCSL), even as core CPI has stayed comparatively contained at 2.82% (FRED CPILFESL) — a divergence likely tied to energy price swings, worth watching into the next Fed communications. Credit markets, by contrast, remain remarkably calm: US high-yield spreads at 272 bps and investment-grade at 75 bps are both historically tight, a sign of continued risk-on complacency in credit even as equity valuations and headline inflation both flash caution.
Global Indices Snapshot
Americas
All markets open. Americas figures below are from the open session on 7 July, not the closing print.
| Index | Level | Day Chg | Day Chg % | Source |
|---|---|---|---|---|
| S&P 500 | 7,513.82 | -23.61 | -0.31% | yfinance ^GSPC |
| Nasdaq 100 | 29,263.68 | -434.19 | -1.46% | yfinance ^NDX |
| Dow Jones | 52,896.86 | -159.05 | -0.30% | yfinance ^DJI |
| Brazil IBOV | 171,549.62 | -897.95 | -0.52% | yfinance ^BVSP |
FRED SP500 official close for 2026-07-06 was 7,537.43 — consistent with today's intraday level trading modestly lower. The S&P 500 is 1.4% below its 52-week high (7,620.90) and comfortably above both its 50-day (7,402.74) and 200-day (6,947.56) moving averages.
Europe
| Index | Level | Day Chg | Day Chg % | Source |
|---|---|---|---|---|
| Euro STOXX 600 | 646.29 | -4.21 | -0.65% | yfinance ^STOXX |
| Euro STOXX 50 | 6,319.86 | -78.15 | -1.22% | yfinance ^STOXX50E |
| CAC 40 | 8,436.24 | -43.63 | -0.51% | yfinance ^FCHI |
| DAX | 25,465.25 | -352.64 | -1.37% | yfinance ^GDAXI |
| FTSE 100 | 10,665.88 | +14.11 | +0.13% | yfinance ^FTSE |
| SMI (Swiss) | 14,360.45 | +58.19 | +0.41% | yfinance ^SSMI |
European data reflects today's close (7 Jul). All six indices remain within 2% of their 52-week highs except the FTSE 100 (-2.5%).
Asia-Pacific
| Index | Level | Day Chg | Day Chg % | Source |
|---|---|---|---|---|
| Nikkei 225 | 68,256.96 | -1,480.73 | -2.12% | yfinance ^N225 |
| Hang Seng | 23,496.89 | -119.43 | -0.51% | yfinance ^HSI |
| Shanghai Comp | 3,990.24 | -51.00 | -1.26% | yfinance 000001.SS |
| ASX 200 | 8,803.90 | -27.10 | -0.31% | yfinance ^AXJO |
| Kospi (Korea) | 7,656.31 | -395.02 | -4.91% | yfinance ^KS11 |
Asia-Pacific data reflects today's close (7 Jul). Kospi's session included an intraday drawdown of over 8% before a circuit breaker paused trading for 20 minutes; Hang Seng is 16.3% below its 52-week high, the largest gap of any major index covered in this briefing.
Emerging Markets
| Index | Level | Day Chg % | Source |
|---|---|---|---|
| MSCI EM (EEM) | 65.72 | -2.74% | yfinance EEM |
| India Nifty 50 | 24,398.70 | -0.13% | yfinance ^NSEI |
| South Africa (EZA) | 63.95 | -1.05% | yfinance EZA |
MSCI EM's -2.74% move (EEM ETF) is largely a read-through of today's Korea and China weakness given the ETF's regional weightings.
Index Valuations & Investment Risk
Valuation Table
| Index | Trailing P/E (live) | Hist avg trailing P/E (†) |
|---|---|---|
| S&P 500 | 26.93x | ~16-18x |
| Nasdaq 100 | 31.59x | ~25-30x |
| Euro STOXX 600 | 18.44x | ~15-17x |
| CAC 40 | 17.66x | ~14-16x |
| DAX | 18.60x | ~15-17x |
| FTSE 100 | 18.00x | ~13-15x |
| Nikkei 225 | 23.08x | ~20-22x |
| MSCI EM | 16.94x | ~13-15x |
(†) Hist avg trailing P/E: static long-run reference constants. Trailing P/E (live): yfinance trailingPE on ETF proxies (SPY, QQQ, EXSA.DE, CAC.PA, EXS1.DE, ISF.L, 1321.T, EEM), fetched 2026-07-07.
Premium/discount to historical average midpoint:
| Index | Premium/Discount |
|---|---|
| S&P 500 | +58% (historically stretched) |
| Nasdaq 100 | +14.9% |
| Euro STOXX 600 | +15.3% |
| CAC 40 | +17.7% |
| DAX | +16.3% |
| FTSE 100 | +28.6% (elevated) |
| Nikkei 225 | +9.9% |
| MSCI EM | +21.0% (elevated) |
Investment Risk Assessment for ETF Investors
United States (S&P 500 / Nasdaq ETFs) The S&P 500's trailing P/E of 26.93x sits 58% above the midpoint of its 16–18x historical range — historically stretched territory. Earnings yield is 3.71% (1÷26.93) versus the 10Y Treasury yield of 4.49% (FRED DGS10, 2026-07-02), producing a negative equity risk premium of -0.78% — bonds are currently yielding more than the earnings on stocks, a genuine caution signal. The 10Y TIPS real yield of 2.26% (FRED DFII10) is also elevated, adding further pressure on the discount rate applied to future earnings. The index is 1.4% below its 52-week high and above both moving averages — a well-established uptrend — but today's session highlights concentration risk: the Nasdaq 100 (31.59x trailing P/E) is being pulled down by a semiconductor-specific AI-capex reassessment, while SpaceX's entry into the index adds a fresh concentration dynamic. Despite this, the VIX remains low at 15.57 (FRED VIXCLS, 2026-07-06) — just above the ~15 threshold that typically denotes complacent conditions — suggesting broad US equity volatility has not meaningfully picked up from today's sector-specific stress.
Europe (STOXX 600 / CAC 40 / DAX ETFs) Euro STOXX 600 trades at 18.44x trailing P/E, 15.3% above its historical average — a milder premium than the US. Earnings yield of 5.42% (1÷18.44) versus the German 10Y Bund yield of 2.92% (web search) gives a positive Euro ERP of +2.50%, a healthier cushion than the US. STOXX 600 also trades at roughly a 32% valuation discount to the S&P 500 (18.44x vs 26.93x). Currency risk applies for non-EUR investors given EUR/USD at 1.1448 (FRED DEXUSEU). The France-Germany OAT-Bund spread stands at approximately 61 bps — a moderate, non-stressed level of French fiscal risk premium.
Japan (Nikkei / TOPIX ETFs) The Nikkei fell 2.12% today amid AI-hardware selloff spillover, and its 23.08x trailing P/E is already 9.9% above its historical band. USD/JPY at 161.87 (web search) reflects a persistently weak yen, a live hedging consideration for foreign investors. The BOJ's policy rate is 1.00% (hiked from 0.75% on 2026-06-16 — the highest since 1995), with board commentary suggesting a further move toward a ~2% neutral rate, plausibly in Q4 2026. The 10Y JGB yield has now reached 2.82%, its highest since 1997, which raises the discount-rate risk to Nikkei valuations from here.
Emerging Markets (MSCI EM ETFs) MSCI EM's 16.94x trailing P/E is 21% above its historical band — a narrower discount to developed markets than has typically prevailed. Today's -2.74% EEM move and Kospi's circuit-breaker session underscore that single-market volatility (Korea) can dominate the ETF's return even when China and India are comparatively calm (Shanghai -1.26%, Nifty -0.13%).
Overall Risk Score (qualitative, not financial advice): - United States: High valuation risk / low margin of safety — negative ERP, stretched trailing P/E. - Europe: Moderate to attractive — positive ERP, meaningful discount to US valuations. - Japan: Moderate, rising policy-normalization risk — JGB yields at multi-decade highs. - Emerging Markets: Moderate — valuation premium has narrowed versus history, and single-market volatility (Korea) is elevated.
Disclaimer: This is financial information, not personalised investment advice. Past valuations do not guarantee future returns. Consult a financial advisor before investing.
US Economic Indicators (FRED - authoritative)
| Indicator | Current | Prior | Delta | Reference Date | FRED Series |
|---|---|---|---|---|---|
| CPI YoY % | 4.17% | 3.78% (Apr) | +0.39pp | 2026-05 | CPIAUCSL |
| Core CPI YoY % | 2.82% | 2.74% (Apr) | +0.08pp | 2026-05 | CPILFESL |
| Unemployment Rate | 4.2% | 4.3% (May) | -0.1pp | 2026-06 | UNRATE |
| Nonfarm Payrolls | 158,984k | 158,927k (May) | +57k | 2026-06 | PAYEMS |
| 10Y TIPS Real Yield | 2.26% | 2.20% (Jun-30) | +0.06pp | 2026-07-02 | DFII10 |
Headline CPI has accelerated sharply over the last four reported months (2.39% in January to 4.17% in May), while core CPI has drifted up more modestly (2.51% to 2.82%) — a gap consistent with energy-price-driven headline volatility rather than a broad-based inflation resurgence, but one worth monitoring closely.
Other economic releases (web search): Eurozone Services PMI rose to 49.4 in June (vs. 48.9 consensus, 47.7 prior) — the softest downturn in the bloc's services sector since the Middle East energy shock, though still in contraction territory below 50. Eurozone Manufacturing PMI came in at 51.4 (vs. 51.3 consensus), a fifth consecutive month of expansion. Note: the US ISM Services PMI release was shifted this week due to the July 4th holiday falling on July 3.
Fixed Income & Bond Analysis
All US Treasury yields from FRED. European and Asian yields from web search (ECB API returned an error today — see note below).
Policy Rates
| Central Bank | Rate | Source |
|---|---|---|
| Fed Funds (upper) | 3.75% | FRED DFEDTARU |
| Fed Funds (lower) | 3.50% | FRED DFEDTARL |
| Effective FFR | 3.63% (2026-07-03) | FRED DFF |
| ECB Deposit Rate | 2.25% | FRED ECBDFR |
| BOJ Policy Rate | 1.00% | web search (hiked from 0.75% on 2026-06-16) |
| BOE Bank Rate | ~3.73% (SONIA/FRED, 2026-07-03) | FRED IUDSOIA |
Government Bond Yields
| Country | 2Y Yield | 10Y Yield | 30Y Yield | Source |
|---|---|---|---|---|
| USA | 4.14% | 4.49% | 4.98% | FRED |
| Germany | (not retrieved) | 2.92% | (not retrieved) | web |
| France | (not retrieved) | 3.53% | (not retrieved) | web |
| UK | 4.13% (2026-07-06) | 4.79% | (not retrieved) | web |
| Japan | (not retrieved) | 2.82% | (not retrieved) | web |
| Italy | (not retrieved) | 3.68% (2026-07-02) | (not retrieved) | web |
Yield Curve Spreads (FRED pre-computed): - 10Y-2Y spread: +35 bps (2026-07-06) — no longer inverted and just outside this briefing's ±25 bps "flat" band, but still well below the 75–100+ bps typical of a normally-sloped curve; the curve has normalized from its 2022–2024 inversion without yet steepening meaningfully. - 10Y-3M spread: +61 bps (2026-07-06) — positive, and not currently signalling recession risk under the classic 10Y-3M framework.
OAT-Bund Spread: approximately 61 bps (France 3.53% minus Germany 2.92%, both from web search on the same day) — a moderate, non-stressed level of French fiscal risk premium.
Yield Curve Charts
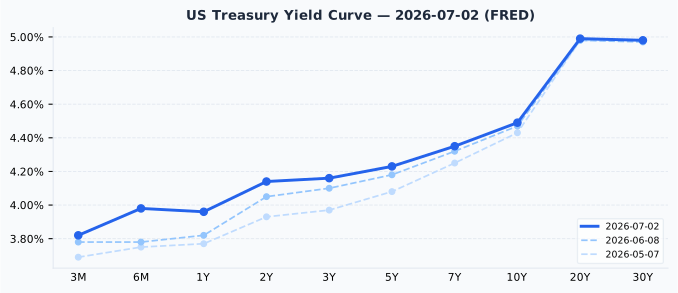
The current US Treasury curve is continuously upward-sloping from 3M (3.82%) out to 30Y (4.98%), with no dips or inversions along any segment — a "normalizing" shape following the 2022–2024 inversion era. Versus one month ago (2026-06-08), the curve has shifted up by roughly 4–9 bps at the front end (3M +4bps, 2Y +9bps) and by a smaller ~1–2 bps at the long end (10Y +2bps, 30Y +1bp), a mild bear-flattening-into-steepening move consistent with firmer near-term rate expectations without a matching rise in the long-run term premium.
Eurozone yield curve chart omitted today: the ECB Yield Curve API was unavailable, and only the German 10Y point (2.92%, web search) could be sourced, which is insufficient for a full-curve chart.
Credit Markets (from FRED — authoritative)
| Market | OAS Spread | Series ID |
|---|---|---|
| US Investment Grade | 75 bps | BAMLC0A0CM |
| US High Yield | 272 bps | BAMLH0A0HYM2 |
| Euro High Yield | 262 bps | BAMLHE00EHYIOAS |
All three spreads sit below their respective long-run "normal" floors (IG ~80–150 bps, HY ~300–500 bps) — historically tight, signalling credit-market complacency about default risk even as equity valuations and headline inflation both show signs of stress.
Bond Portfolio Implications
S&P 500 ERP = earnings yield (1÷26.93) − 10Y Treasury yield = 3.71% − 4.49% = -0.78%. A negative ERP means Treasuries currently yield more than S&P 500 earnings — historically a caution signal for forward equity returns, and one that has been flagged in this briefing for multiple consecutive sessions.
Euro ERP = earnings yield (1÷18.44) − German 10Y Bund yield = 5.42% − 2.92% = +2.50%, a meaningfully healthier cushion than the US.
Duration risk: a 100 bps rise in yields implies roughly an 8–9% price loss on a 10-year bond. With the front end of the US curve still flat-to-modestly-positive and real yields elevated (DFII10 at 2.26%), shorter-duration positioning continues to carry a lower opportunity cost than in a steeply upward-sloping curve environment.
Currencies & Commodities
Currencies:
| Pair | Rate | Source |
|---|---|---|
| EUR/USD | 1.1448 | FRED DEXUSEU |
| USD Index | 120.69 | FRED DTWEXBGS |
| USD/JPY | 161.87 | web search |
| GBP/USD | 1.3350 | web search |
| USD/CHF | 0.8031 (2026-07-04) | web search |
Commodities (all from yfinance MCP front-month futures):
| Commodity | Price | Day Chg % | Ticker | Source |
|---|---|---|---|---|
| Brent Crude | $74.16 | +3.01% | BZ=F | yfinance |
| WTI Crude | $70.48 | +2.82% | CL=F | yfinance |
| Gold ($/oz) | $4,156.00 | -0.28% | GC=F | yfinance |
| Silver ($/oz) | $61.37 | -1.54% | SI=F | yfinance |
| Copper ($/lb) | $6.2295 | -0.04% | HG=F | yfinance |
| Nat Gas ($/MMBtu) | $3.275 | +0.92% | NG=F | yfinance |
Gold is 25.6% below its all-time high of $5,586.20/oz — a significant pullback from a peak reached within the past 52 weeks, not "near highs" territory. Silver has retraced even further, 49.4% below its all-time high of $121.30/oz. Both metals' 52-week highs coincide with their all-time highs, meaning this represents a real correction from recent records rather than a slow historical drift.
WTI and Brent are both rebounding today (+2.8% and +3.0%) but remain deeply below their historical peaks: WTI is 41.0% below its 52-week high of $119.48 (and 52.1% below its decades-old 2008 all-time high of $147.27); Brent is 41.2% below its 52-week high of $126.10 (49.7% below its all-time high of $147.43). Copper, at $6.2295/lb, is 6.4% below its all-time high of $6.6525/lb — closer to its record than the other commodities, but still outside "near highs" range under this briefing's ≤2% threshold.
Sector & Theme Highlights
Today's dominant cross-market theme is a sector rotation within AI-exposed names: semiconductors sold off sharply (~-6% for the sub-index, dragging the Nasdaq 100 down 1.46%) on renewed scrutiny of whether massive AI capex will generate commensurate returns, even as hyperscalers simultaneously raised 2026 AI capex guidance to ~$750 billion (seen crossing $1 trillion in 2027) and most other S&P 500 constituents advanced. SpaceX's Nasdaq-100 inclusion via new mega-IPO fast-track rules adds a second concentration-risk narrative on top of existing AI mega-cap weighting concerns. Elsewhere, energy is the other visible theme, with oil's rebound (+2.8–3.0%) lifting global bond yields, and Asia's rate-normalization story continues via the BOJ's policy path and Japan's 31-year JGB yield high.
Top Stories (Global)
- Chipmaker selloff drags the Nasdaq 100 down 1.46% intraday (semiconductor sub-index down roughly 6%) on AI-capex payoff doubts, even as broader S&P 500 breadth stays positive — a rotation, not a broad risk-off move.
- SpaceX completes its IPO — reportedly the largest ever — and joins the Nasdaq-100 under newly created "fast-track" mega-IPO inclusion rules, with a market capitalization exceeding $2 trillion.
- Major hyperscalers raise combined 2026 AI capex guidance to roughly $750 billion, on a path to cross $1 trillion in 2027 — sustaining rather than resolving the AI-spend-versus-payoff debate.
- South Korea's Kospi plunges 4.91% and triggers a 20-minute trading-halt circuit breaker after falling more than 8% intraday — the sharpest single-day dislocation among major indices today.
- Japan's 10-year JGB yield climbs to 2.82%, its highest since 1997, compounding the BOJ's June rate hike to 1.00% with fresh fiscal-spending and bond-supply concerns.
- Oil rebounds (WTI +2.8%, Brent +3.0%) and lifts global bond yields, though both benchmarks remain more than 40% below their respective 52-week highs.
- US headline CPI has accelerated sharply over four months (2.39% to 4.17% YoY) even as core CPI stays comparatively contained at 2.82% — a divergence worth watching into upcoming Fed communications.
Looking Ahead
Market closures in the next several days (from the Nager.Date holiday calendar; India holiday data was not available):
- 14 July 2026 — Bastille Day (France) — French markets closed.
- 17 July 2026 — Constitution Day (Korea) — Korean markets closed.
- 20 July 2026 — Marine Day (Japan) — Japanese markets closed.
- 1 August 2026 — Swiss National Day (Switzerland) — Swiss markets closed.
- 11 August 2026 — Mountain Day (Japan) — Japanese markets closed.
Central banks: BOJ board commentary (from today's web search) suggests another hike toward a ~2% neutral rate is plausible, tentatively flagged for Q4 2026, contingent on confirmation that underlying inflation trends hold. Exact FOMC, ECB, and BOJ meeting calendar dates were not available; check central bank websites directly for confirmed dates.
Data: US ISM Services PMI, delayed this week by the July 4th holiday, is still pending. No other specific upcoming release dates were confirmed.