Global Financial Briefing — Friday, 14 August 2026
Americas index levels, commodities and day changes reflect the 14 August closing print. Fixed income, FX and macro figures are dated inline.
Market Overview
The week ended on a jarring note. Having closed at a record 7,798.99 on Thursday (FRED SP500, 2026-08-13) on the back of cooler July CPI and PPI prints and renewed enthusiasm for the AI trade, US equities gave ground on Friday as two consumer datapoints landed badly. July retail sales fell 0.6% month-on-month against a consensus of +0.3% — the largest monthly decline in over a year — and the University of Michigan's preliminary August sentiment index dropped to 51.0 from 55.2, well short of the ~54.5 expected. Both readings point the same way: the American consumer is cooling now that the summer tax-refund boost has faded. Wall Street pared its losses into the close, however: the S&P 500 finished down 0.17% at 7,785.76, roughly a third better than the −0.26% it showed at midday, and the Nasdaq 100 recovered from −0.41% to close off just 0.13%. For all that, this was a wobble rather than a scare — the VIX closed Thursday at 14.63 (FRED VIXCLS, 2026-08-13), a low reading that sits below the 15 mark and points to a market that is, if anything, complacent.
That consumer weakness sits alongside a labour market that has already turned. Nonfarm payrolls contracted by 23,000 in July after +20k in June, +63k in May and +148k in April (FRED PAYEMS, 2026-07-01) — a four-month deceleration that has now crossed into outright job losses, even as the unemployment rate ticked down to 4.1%. Headline CPI has fallen from 4.17% in May to 3.30% in July, with core at 2.47%, but at 3.3% inflation remains above target with the Fed holding at 3.50–3.75%. The bond market is not treating this as a cutting cycle: the 10Y sits at 4.68% and both the 20Y and 30Y at 5.24%, a very long end that has steepened materially over the past two months.
Europe was quietly mixed and, unusually, decoupled: the DAX rose 0.53% while the CAC 40 (-0.16%), FTSE 100 (-0.21%) and SMI (-0.58%) slipped, leaving the STOXX 600 down 0.21%. Euro-area Q2 GDP was confirmed at +0.4% QoQ / +1.0% YoY with no revision. Core European sovereign yields backed up across the board — Bund 10Y +7bp to 3.21%, OAT +10bp to 4.06%, gilts +9bp to 5.05%. Asia was the day's bright spot and the story was Korea: the Kospi closed +2.42% at 6,977.94, briefly reclaiming 7,000 and capping a run of roughly +22% in ten sessions as foreign money returned to memory-chip names (SK Hynix, Samsung) after months of outflows. The Nikkei added 0.59%. Hong Kong (-1.10%) and Australia (-0.80%) were the regional laggards.
Global Indices Snapshot
Americas
| Index | Level | Day Chg | Day Chg % | Source |
|---|---|---|---|---|
| S&P 500 | 7,785.76 | −13.23 | −0.17% | yfinance ^GSPC |
| Nasdaq 100 | 30,046.14 | −38.36 | −0.13% | yfinance ^NDX |
| Dow Jones | 53,732.41 | −107.58 | −0.20% | yfinance ^DJI |
| Brazil IBOV | 166,934.20 | −166.75 | −0.10% | yfinance ^BVSP |
Americas data reflects the 14 Aug close.
The S&P 500 close of 7,785.76 is confirmed against FRED SP500 for 2026-08-14, which agrees to the cent. Every Americas row recovered materially into the close: the IBOV in particular finished −0.10% against −0.97% mid-afternoon, and the Nasdaq 100 went from worst of the four to best.
Europe
| Index | Level | Day Chg | Day Chg % | Source |
|---|---|---|---|---|
| Euro STOXX 600 | 657.86 | −1.38 | −0.21% | yfinance ^STOXX |
| Euro STOXX 50 | 6,539.59 | −5.88 | −0.09% | yfinance ^STOXX50E |
| CAC 40 | 8,636.80 | −13.76 | −0.16% | yfinance ^FCHI |
| DAX | 26,440.31 | +140.57 | +0.53% | yfinance ^GDAXI |
| FTSE 100 | 10,750.11 | −22.56 | −0.21% | yfinance ^FTSE |
| SMI (Swiss) | 14,390.67 | −84.46 | −0.58% | yfinance ^SSMI |
European data reflects today's close (14 Aug).
Asia-Pacific
| Index | Level | Day Chg | Day Chg % | Source |
|---|---|---|---|---|
| Nikkei 225 | 68,713.80 | +405.20 | +0.59% | yfinance ^N225 |
| Hang Seng | 25,116.85 | −279.66 | −1.10% | yfinance ^HSI |
| Shanghai Comp | 3,927.18 | +0.21 | +0.01% | yfinance 000001.SS |
| ASX 200 | 9,115.20 | −73.30 | −0.80% | yfinance ^AXJO |
| Kospi (Korea) | 6,977.94 | +164.60 | +2.42% | yfinance ^KS11 |
Asia-Pacific data reflects today's close (14 Aug).
Emerging Markets
| Index | Level | Day Chg % | Source |
|---|---|---|---|
| MSCI EM (EEM) | 66.61 | −0.10% | yfinance EEM |
| India Nifty 50 | 24,366.00 | −0.12% | yfinance ^NSEI |
| South Africa | 67.53 | +0.30% | yfinance EZA |
All three rows reflect the 14 Aug close. EEM and EZA are US-listed ETFs; the Nifty row reflects the Mumbai close.
Where indices stand relative to records. The S&P 500 closed 0.4% below its all-time high, 3.7% above its 50-day and 10.1% above its 200-day moving average — a market still in an uptrend that had a soft session and recovered much of it, not a market breaking down. The DAX is similarly close to its record. Elsewhere the picture is very different: the Kospi's rally has recovered only part of a severe drawdown and it remains well below both its record and its 50-day average; Shanghai and the Hang Seng are trading below both their 50- and 200-day averages; and Brazil's IBOV is below both, having fallen materially from its high. The Nifty 50 is also below its 200-day average.
Index Valuations & Investment Risk
Valuation Table
| Index | Trailing P/E (live) | Hist avg trailing P/E (†) | Premium to hist mid |
|---|---|---|---|
| S&P 500 | 26.13x | ~16-18x | +53.7% |
| Nasdaq 100 | 31.17x | ~25-30x | +13.3% |
| Euro STOXX 600 | 18.13x | ~15-17x | +13.3% |
| CAC 40 | 17.70x | ~14-16x | +18.0% |
| DAX | 19.13x | ~15-17x | +19.5% |
| FTSE 100 | 18.03x | ~13-15x | +28.8% |
| Nikkei 225 | 23.13x | ~20-22x | +10.1% |
| MSCI EM | 17.26x | ~13-15x | +23.3% |
(†) Hist avg trailing P/E: static long-run reference constants — the only non-live figures in this briefing. Live trailing P/E from yfinance trailingPE on ETF proxies (SPY, QQQ, EXSA.DE, CAC.PA, EXS1.DE, ISF.L, 1321.T, EEM), fetched 2026-08-14.
The striking feature is that every index in the table trades above its own long-run average — there is no cheap major market on this measure today. The S&P 500 at 53.7% above its historical midpoint is the standout and sits in "historically stretched" territory (>40%). Note that the Nasdaq 100's premium looks modest only because its own historical benchmark is already high; at 31.2x it is the most expensive index in absolute terms.
Investment Risk Assessment for ETF Investors
United States (S&P 500 / Nasdaq ETFs) S&P 500 earnings yield = (1÷26.13) = 3.83%, against a 10Y Treasury at 4.68% (FRED DGS10, 2026-08-12). The nominal earnings yield gap is therefore −0.85 pp: on today's quoted prices, the Treasury pays more current yield than the index earns. Measured against the 10Y TIPS real yield of 2.42% (FRED DFII10, 2026-08-12) the gap is +1.41 pp — the inflation correction is worth 2.26 pp and flips the sign, which is exactly why the nominal version should not be read on its own. See the note under Bond Portfolio Implications on what this measure can and cannot tell you.
The index is 3.7% above its 50-day and 10.1% above its 200-day moving average, near record highs, on a valuation 54% above its long-run norm, with payrolls now shrinking and the consumer visibly slowing. That combination — full valuation plus a decelerating real economy plus a real risk-free rate of 2.42% — is what makes the US the least forgiving entry point among the majors. Concentration in a handful of AI-linked megacaps remains the dominant single risk: it is what has driven the multiple, and it is what would drive a de-rating.
Europe (STOXX 600 / CAC 40 / DAX ETFs) STOXX 600 earnings yield = (1÷18.13) = 5.51%, against a German 10Y Bund at 3.21% — a +2.30 pp nominal gap, versus −0.85 pp in the US. On real yields the euro gap is +4.40 pp (5.51% less a euro real 10Y of 1.12%) against +1.41 pp for the US.
The cross-country comparison needs the standard caveat: part of any US–euro gap difference is the difference between the two currencies' inflation and policy paths, not a difference in risk compensation. Here, though, the caveat does very little work — the nominal difference between the two gaps is 3.15 pp and the real-yield difference is 2.99 pp, so only about 0.16 pp of Europe's advantage is an inflation artifact. What is left is a genuine valuation gap: 18.1x versus 26.1x.
Europe's own risks are not small. French fiscal politics keep the OAT-Bund spread at roughly 85bp with the OAT 10Y at 4.06%, and the whole core curve backed up today. A euro-based investor holding EUR-quoted European funds has no FX effect on the quoted value of the holding, but real currency exposure remains inside the earnings — CAC 40 and STOXX 600 constituents are multinationals earning substantially abroad. That exposure is smaller and slower than a direct FX position, not absent.
Japan (Nikkei / TOPIX ETFs) The Nikkei at 23.13x is the closest of the majors to its own historical average (+10.1%), but it is 5.7% below its record and the policy backdrop is tightening rather than loosening. The BOJ raised to 1.00% in June — the highest since 1995 — held in July, and its July summary of opinions flagged upside price risks and the possibility of a faster hike pace; September is live, with markets putting roughly 62% on no change. The JGB 10Y at 2.87% is a level that would have been unthinkable a few years ago. For a euro-based investor the currency decision matters at least as much as the equity one: with USD/JPY around 159, an unhedged position is a substantial yen bet, and a BOJ that hikes into a weak yen is precisely the scenario that would move it.
Emerging Markets (MSCI EM ETFs) EEM at 17.26x is 23% above its own long-run average — cheaper than the US in absolute terms but not cheap against its own history, which is the more relevant comparison. The EM story right now is really a Korea and China story pulling in opposite directions: Korean semis are in a violent recovery (+22% in ten sessions) from an equally violent drawdown, while Shanghai and Hong Kong both trade below their 50- and 200-day averages. EEM itself is a USD-denominated vehicle, so a euro-based holder carries the full dollar exposure on top of the underlying EM currency risk.
Overall Risk Score (qualitative, not financial advice): - United States — high valuation risk / low margin of safety. Stretched multiple, negative nominal earnings yield gap, real risk-free rate at 2.42%, and a labour market now shedding jobs. - Europe — moderate. Fair-to-full rather than stretched, with a meaningfully better income trade-off than the US, offset by French fiscal risk and a curve that is selling off. - Japan — moderate. Closest to its own historical norm, but tightening policy and a live currency decision. - Emerging Markets — moderate. Discount to the US, premium to its own history, and unusually high dispersion between constituents.
Disclaimer: This is financial information, not personalised investment advice. Past valuations do not guarantee future returns. Consult a financial advisor before investing.
US Economic Indicators (FRED — authoritative)
| Indicator | Current | Prior | Delta | Reference Date | FRED Series |
|---|---|---|---|---|---|
| CPI YoY % | 3.30% | 3.46% | −0.16 pp | 2026-07-01 | CPIAUCSL |
| Core CPI YoY % | 2.47% | 2.57% | −0.10 pp | 2026-07-01 | CPILFESL |
| Unemployment Rate | 4.1% | 4.2% | −0.1 pp | 2026-07-01 | UNRATE |
| Nonfarm Payrolls | −23k | +20k | −43k | 2026-07-01 | PAYEMS |
| 10Y TIPS Real Yield | 2.42% | 2.43% | −0.01 pp | 2026-08-12 | DFII10 |
FRED macro data is monthly and lags by 4–6 weeks; the reference month is shown for each. Two things stand out. Headline CPI has fallen sharply — 4.17% in May, 3.46% in June, 3.30% in July — and core CPI at 2.47% is now running below headline, which locates the remaining excess in food and energy rather than in underlying prices. Meanwhile payrolls have gone +148k → +63k → +20k → −23k over four months. The unemployment rate falling to 4.1% against negative payrolls is a combination that usually reflects labour-force withdrawal rather than strength, and is worth watching in next month's household survey detail.
Other economic releases today (web search):
| Indicator | Actual | Consensus | Prior | Reaction |
|---|---|---|---|---|
| US Retail Sales, July (MoM) | −0.6% | +0.3% | +0.2% | Large downside miss — biggest monthly fall in over a year. Declines in online retail, motor vehicles, gasoline stations and electronics. Control group −0.4%, weakest since early 2025. Level $763.6bn, +5.0% YoY. Fading summer tax-refund boost cited. |
| US UMich Consumer Sentiment, Aug prelim | 51.0 | ~54.5 | 55.2 | Downside miss, −8% and ending a two-month rebound. Broad-based, sharpest among low-income, older and non-college households. 1-yr inflation expectations ~4.2%. |
| Euro area GDP, Q2 (2nd est.) | +0.4% QoQ / +1.0% YoY | +0.4% / +1.0% | +0.4% / +1.0% | In line, no revision to the flash. |
Fixed Income & Bond Analysis
Policy Rates
| Central Bank | Rate | Source |
|---|---|---|
| Fed Funds (upper) | 3.75% | FRED DFEDTARU (2026-08-14) |
| Fed Funds (lower) | 3.50% | FRED DFEDTARL (2026-08-14) |
| Effective FFR | 3.63% | FRED DFF (2026-08-12) |
| ECB Deposit Rate | 2.25% | FRED ECBDFR (2026-08-14) |
| BOJ Policy Rate | 1.00% | web search — hiked June 2026, held July; next MPM 17 Sep |
| BOE Bank Rate | ~3.73% (SONIA) | FRED IUDSOIA (2026-08-12) |
Government Bond Yields
| Country | 2Y Yield | 10Y Yield | 30Y Yield | Day Chg (10Y) | Source |
|---|---|---|---|---|---|
| USA | 4.20% | 4.68% | 5.24% | (prior-session data) | FRED DGS2/DGS10/DGS30 (2026-08-12) |
| Germany | 2.79% | 3.21% | 3.73% | +7 bp | web (tradingeconomics, 14 Aug) |
| France | (not retrieved) | 4.06% | (not retrieved) | +10 bp | web (tradingeconomics, 14 Aug) |
| UK | 4.42% | 5.05% | (not retrieved) | +9 bp | web (tradingeconomics, 14 Aug) |
| Japan | (not retrieved) | 2.87% | (not retrieved) | ~unchanged | web (tradingeconomics, 14 Aug) |
| Italy | (not retrieved) | 3.99% | (not retrieved) | +8 bp | web (tradingeconomics, 14 Aug) |
US Treasury yields are as of the 2026-08-12 FRED observation and so are two sessions behind the European figures — day changes are not comparable across those rows.
Yield Curve Spreads (FRED pre-computed, 2026-08-13): - 10Y−2Y spread: +48 bps — positively sloped and clearly not inverted, but below the ~75 bp threshold that would count as historically steep. This is a normal, moderately upward-sloping curve. - 10Y−3M spread: +76 bps — comfortably positive. The classic recession signal is not flashing, having spent much of the prior cycle inverted.
The more interesting feature is further out: the 20Y and 30Y are both at 5.24%, an entirely flat 20s–30s segment, while 10s–30s is +56 bp. The market is demanding a substantial term premium to go beyond ten years and then differentiating not at all within the long end — a supply-and-term-premium story rather than a growth-expectations one.
OAT-Bund Spread: roughly 85 bp (OAT 10Y 4.06% vs Bund 10Y 3.21%, both 14 Aug), wider than the ~69 bp seen in May. French fiscal and political risk remains the principal idiosyncratic credit story in the euro area. The Italian BTP at 3.99% is now inside the French OAT — a reversal of the historical ordering that has become established over the past year.
Yield Curve Charts
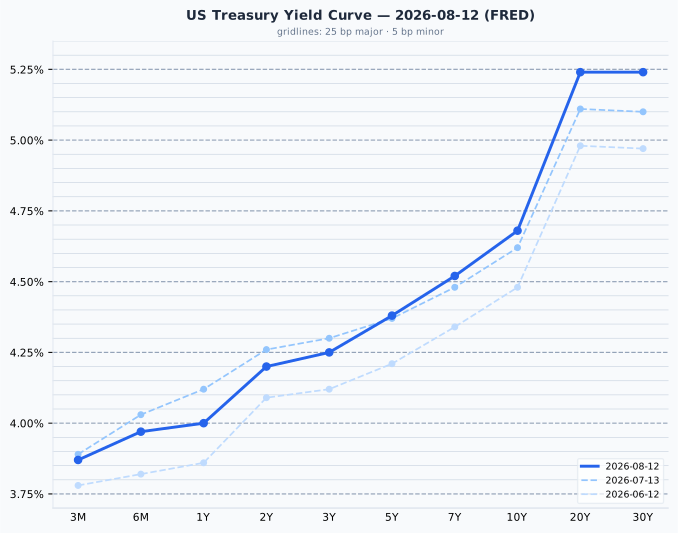
The US curve is upward-sloping throughout with a pronounced kink between 10Y and 20Y and a flat long end. Against a month ago the curve has twisted: the front end has fallen (1Y −12 bp, 2Y −6 bp) while the long end has risen sharply (20Y +13 bp, 30Y +14 bp) — a bear steepening of the back end even as the market prices a softer near-term path. Against two months ago the entire curve is higher, with the 30Y up 27 bp.
Note: the 3-month bill at 3.87% sits 24.5 bp above the Fed Funds target midpoint of 3.625%, at the outer edge of the normal range but within tolerance.
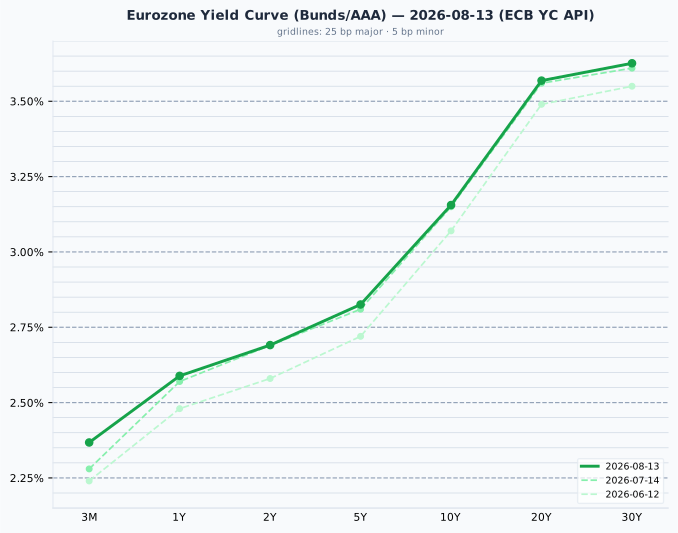
The euro AAA curve is smoothly upward-sloping from 2.37% at 3M to 3.63% at 30Y, with no kink and none of the long-end flatness of the US. Against a month ago it is essentially unchanged in the belly and long end (10Y +0.6 bp, 30Y +1.6 bp) with the 3M up 9 bp — a curve that has gone nowhere for a month, in marked contrast to the US. Against June it is 8–9 bp higher across the middle of the curve. Note the chart uses the ECB AAA composite as of 13 Aug; the German Bund specifically rose 7 bp on 14 Aug and so today's actual level is above what the curve shows.
Credit Markets (FRED — authoritative)
| Market | OAS Spread | Series ID | Observation |
|---|---|---|---|
| US Investment Grade | 79 bps | BAMLC0A0CM | 2026-08-13 |
| US High Yield | 271 bps | BAMLH0A0HYM2 | 2026-08-13 |
| Euro High Yield | 257 bps | BAMLHE00EHYIOAS | 2026-08-13 |
All three are historically tight — US IG at 79 bp is below the 80–150 bp normal band, and US high yield at 271 bp is below the 300–500 bp normal band, nowhere near the >500 bp that signals stress. Euro high yield at 257 bp is tighter still than its US counterpart. Credit is pricing essentially no default risk, which is a notable divergence from the equity market's reaction to today's consumer data and from a labour market that has started shedding jobs. Tight spreads offer very little cushion: at these levels the compensation for taking credit risk over duration risk is close to its historical minimum, and the asymmetry favours government paper over corporate.
Real Yields (US and Euro Area)
| Region | Nominal 10Y | Expected inflation | Real 10Y | How the real yield is obtained |
|---|---|---|---|---|
| United States | 4.68% (FRED DGS10, 2026-08-12) | 2.26% (residual — the breakeven) | 2.42% (FRED DFII10, 2026-08-12) | Measured. TIPS trade, so the market quotes a real yield directly; expected inflation is backed out as the residual |
| Euro area | 3.16% (ECB YC AAA SR_10Y, 2026-08-13) | 2.04% (ECB SPF long-term HICP, 2026-Q3 — measured) | 1.12% (residual) | Constructed. No euro inflation-linked benchmark is published, so a survey expectation is subtracted from the nominal yield |
The two rows are built in opposite directions, and only the US real yield is a price at which anyone actually transacts. The euro figure is the softer of the two and should be treated as such. Two mismatches follow from the construction: the US breakeven embeds an inflation risk premium that a survey of forecasters does not, and the SPF horizon is five calendar years ahead against the bond's ten.
Decomposing the 152 bp nominal gap between the US and euro 10Y: only 22 bp is expected inflation (2.26% vs 2.04%), while 130 bp is real rates (2.42% vs 1.12%). The gap is almost entirely a real-rate story, not an inflation story — the same shape seen a week ago, and it is worth recomputing each time because the split moves with the cycle.
The US–euro real rate gap is not an investment opportunity
The 130 bp real-yield advantage the US enjoys is a structural feature of the two economies — higher US trend growth, euro-area excess savings, Bund scarcity, heavy US fiscal supply — and has persisted in every quarter since 2014. It is not something a euro-based investor can capture.
Hedge the currency and the advantage cancels almost exactly, because the forward rate is set to remove the interest differential; on a recent check, a 10Y Treasury hedged into EUR returned roughly the same as, or slightly less than, the euro AAA bond, with the commonly used rolling three-month hedge the worst of the available tenors. Leave it unhedged and you are making a currency bet, not a bond decision. A real yield is real in its own currency: 2.42% means 2.42% above US inflation, which is not a real return for someone who spends euros. The correct reading of the gap is descriptive — it tells you about relative policy stance and growth expectations, and no portfolio conclusion should be drawn from it.
Bond Portfolio Implications
Earnings yield gap: what it is good for, and what it is not
This is the earnings yield gap — not the equity risk premium. The equity risk premium is expected total return on equities minus the risk-free rate and requires an estimate of future earnings growth; the measure below leaves growth out entirely.
| Region | Earnings yield | vs nominal 10Y | Nominal gap | vs real 10Y | Real gap |
|---|---|---|---|---|---|
| US (SPY 26.13x) | 3.83% | 4.68% | −0.85 pp | 2.42% | +1.41 pp |
| Europe (EXSA.DE 18.13x) | 5.51% | 3.21% (Bund) | +2.30 pp | 1.12% | +4.40 pp |
What the gap is genuinely good for: it compares the income the two instruments offer today using nothing but quoted prices — no growth forecast, no assumptions. Read in that spirit, it says that a US investor can currently lock a Treasury coupon of 4.68% or accept equity risk at a 3.83% earnings yield, while a euro investor chooses between 3.21% on a Bund and a 5.51% earnings yield on European equities. That is a real and useful distinction.
What it cannot do is forecast whether equities will beat bonds. Adding the bond yield empirically makes the equity forecast worse than the earnings yield alone, because the bond leg imports long inflation-driven swings that swamp the signal. Nothing about the −0.85 pp US reading should be taken as a prediction about forward US equity returns.
Two structural biases worth stating explicitly here, because the number carries weight in this write-up:
- It ignores growth. A bond coupon is fixed for a decade; the earnings behind the equity yield grow roughly with inflation. The real-yield column above corrects for this, and the size of the correction is the interesting part — 2.26 pp for the US, enough to flip the sign of the gap from negative to positive. For Europe it is 2.04 pp. Recall from the Real Yields section that the two real yields are constructed in opposite directions, so the euro column is the softer number.
- An equity holder does not receive the full earnings yield. Only the dividend and buyback portion arrives as cash; the remainder is retained by the company. Whenever this comparison is framed as one of income, that distinction matters.
Are bonds attractive versus equities here? For a euro-based investor the honest answer is that the euro AAA 10Y at 3.16% nominal / 1.12% real is a modest but positive real return with genuine safety, against European equities at an 18.1x multiple offering a 5.51% earnings yield — a 4.40 pp real gap that still favours equities on today's prices, though by less than it would have at any point in the past decade of negative real yields. The US comparison is far less flattering to equities on nominal figures and only mildly favourable on real ones.
Credit adds nothing to this trade-off at present: with US IG at 79 bp and US HY at 271 bp, the extra spread on offer for taking corporate credit risk is close to historic minimums and provides almost no buffer against either a widening or the labour-market deterioration now visible in the payrolls data.
Duration risk: a 100 bp rise in yields implies roughly an 8–9% price loss on a 10Y bond. At the long end the exposure is far larger — a 30Y at 5.24% carries roughly double that sensitivity. Given that the long end has risen 27 bp in two months while the front end has fallen, the case for concentrating duration in the 2–7 year part of the curve rather than reaching for the extra 56 bp at 30Y looks stronger than usual: an investor is being paid comparatively little to accept a great deal more interest-rate risk.
Currencies & Commodities
Currencies:
| Pair | Rate | Source |
|---|---|---|
| EUR/USD | 1.1559 | FRED DEXUSEU (2026-08-07) ‡ |
| USD Index | 119.06 | FRED DTWEXBGS (2026-08-07) ‡ |
| USD/JPY | ~159.26 | web search ◊ |
| GBP/USD | ~1.3503 | web search ◊ |
| USD/CHF | ~0.8136 | web search ◊ |
‡ FRED FX series are a week stale — 2026-08-07 is the most recent published observation. ◊ Latest available rates from web search; the exact quote timestamp for 14 Aug could not be confirmed. Treat as approximate.
Commodities (front-month futures, yfinance):
| Commodity | Price | Day Chg % | Ticker | Source |
|---|---|---|---|---|
| Brent Crude | $88.52 | +1.67% | BZ=F | yfinance |
| WTI Crude | $82.40 | +1.42% | CL=F | yfinance |
| Gold ($/oz) | $4,437.30 | +0.38% | GC=F | yfinance |
| Silver ($/oz) | $65.11 | +0.18% | SI=F | yfinance |
| Copper ($/lb) | $6.6130 | +0.08% | HG=F | yfinance |
| Nat Gas ($/MMBtu) | $2.733 | +0.22% | NG=F | yfinance |
Commodities reflect the 14 Aug close (last trade of the futures session).
Copper is the one commodity at all-time highs — $6.6130/lb is just 1.7% below its record of $6.728, set on 6 August, and it also sits at the top of a 52-week range whose low was $4.4075. Copper also ground out a small gain by the close, having been fractionally negative at midday. That is a striking divergence from the demand signal coming out of the US consumer data, and it is the electrification and grid-buildout story rather than a cyclical one.
Precious metals tell the opposite story. Gold at $4,437.30 is 20.6% below its all-time high of $5,586.20, and silver at $65.11 is 46.3% below its all-time high of $121.30 — both records set on 29 January this year, within the past twelve months, since each equals its 52-week high. These are not markets near their records; they are markets that spiked violently and have retraced a great deal, silver especially, whose 52-week range runs from $37.21 to $121.30. Anyone reading "gold above $4,400" as strength should hold it against that drawdown.
Crude was the day's strongest move and extended it into the close despite the weak US consumer print, with Brent at $88.52 (+1.67%) and WTI at $82.40 (+1.42%). Brent sits in the middle of a 52-week range running from $58.72 to $126.10. Both crude benchmarks last set records in July 2008, in a market since reshaped by shale, so the distance from those highs is not a meaningful drawdown. Natural gas gave back most of its intraday gain to close +0.22% at $2.733, near the bottom of its 52-week range ($2.483–$7.827); its $15.78 record dates from December 2005 and describes a pre-shale market that no longer exists.
Sector & Theme Highlights
Energy and basic materials finished as the top-performing US sectors, with real estate also firm; technology and healthcare lagged, the S&P 500 information technology index closing down 0.5% — a rotation consistent with the day's oil move and with the rate-sensitive names catching a bid as consumer weakness pulled yields' near-term path lower. Note the split within tech: the megacap-weighted Nasdaq 100 closed off only 0.13% while the broader Nasdaq Composite fell 0.28%, with Broadcom −6% the notable drag. Other single-stock moves included Reddit +14% on news of its addition to the S&P 500, an index-inclusion flow story on an otherwise thin summer session, and Valneva +22% in Europe after earnings and EU regulatory validation of its Lyme disease vaccine application.
The cross-market themes worth tracking: - Memory semiconductors produced the largest index-level moves of the week, driving Korea's +22% ten-session run and much of the Nikkei's resilience. SK Group's chairman floated joint-venture models for new memory fabs to share the capital burden and hedge overcapacity risk through the cycle — a sign the industry is planning for the cycle to turn even while the trade is running. - AI capex continues to underwrite US megacap multiples, with OpenAI's prospective public listing now part of the conversation. This remains the load-bearing assumption in the S&P 500's 26.1x. - Copper and electrification — at record highs while the consumer weakens, an unusual and informative divergence. - US consumer deterioration is now visible in three independent series: retail sales, sentiment, and payrolls. - European fiscal risk persists via the OAT, with the BTP now trading through it.
Top Stories (Global)
- US retail sales unexpectedly fell 0.6% in July, the largest monthly drop in more than a year, against a +0.3% consensus. Weakness was broad — online retail, motor vehicles, gasoline stations and electronics — with the control group down 0.4%, its weakest since early 2025. Fading tax-refund support is the leading explanation. (Bloomberg / CNN / Washington Post)
- University of Michigan consumer sentiment sank to 51.0 in the August preliminary reading from 55.2, an 8% fall ending a two-month rebound, with the sharpest declines among low-income, older and non-college households. This is what turned US equities negative in the afternoon. (The Epoch Times / Yahoo Finance)
- The S&P 500 slipped from Thursday's record close of 7,798.99, which had been set on cooler-than-expected July CPI and PPI and continued AI optimism, finishing Friday at 7,785.76 (−0.17%). It still capped a third consecutive weekly gain. The broader Nasdaq Composite underperformed at −0.28%, though the Nasdaq 100 held up better at −0.13%. (TheStreet / Yahoo Finance / CNBC)
- The Kospi closed +2.42% at 6,977.94, briefly reclaiming 7,000 for the first time in three weeks and capping roughly a 22% gain over ten sessions, as foreign investors put an estimated $2bn net into Korean equities on the week — concentrated in SK Hynix and Samsung — after months of outflows. (Korea Times / Bloomberg / 24-7 Wall St)
- Reddit jumped about 14% on confirmation it will join the S&P 500. (The Motley Fool)
- The BOJ's July summary of opinions flagged upside price risks and the possibility of a faster hike pace, with several policymakers warning that underlying inflation could overshoot 2% as a weak yen, fuel costs and a tight labour market feed through. The policy rate stands at 1.00%, the highest since 1995; the next meeting is 17 September, with roughly 62% market-implied probability of no change. (Bloomberg)
- Valneva rose 22% in European trading following earnings and the EU regulatory validation of its Lyme disease vaccine application.
Looking Ahead
Central banks - BOJ Monetary Policy Meeting, 17 September — the live one. Market-implied probability of no change is around 62%, so a hike is a genuine possibility and would be the second of the cycle. Watch the yen into it. - Fed — with payrolls now negative, retail sales falling and headline CPI down to 3.30%, the debate has shifted materially. The 3M bill at 3.87% against a 3.625% target midpoint suggests the front end is not yet pricing imminent easing; that tension is the thing to watch over the coming weeks. - ECB — deposit rate at 2.25%, with the euro curve essentially unchanged over the past month and Q2 GDP confirmed at +0.4% QoQ. Little near-term pressure in either direction.
Data - Next week brings the usual mid-month flow of regional US surveys and housing data; the August payrolls report in early September carries unusual weight given July's −23k, since it will show whether that was a one-month distortion or the start of contraction. - Watch the household survey detail behind the 4.1% unemployment rate — a falling jobless rate alongside falling payrolls generally means people leaving the labour force.
Market closures (from the Nager.Date holiday calendar) - Monday 17 August — South Korea, Liberation Day (observed; the holiday itself falls on Saturday 15 August). KRX closed. Relevant given the size of this week's Korean move. - Saturday 15 August is Assumption Day in France — a weekend date, so no market impact. - Monday 31 August — UK Summer Bank Holiday, London closed. - No US, German, Japanese, Australian, Swiss, Canadian or Brazilian closures in the next three weeks per the calendar. India's entry in the holiday calendar is empty, so Indian closures could not be checked.
Data sources: FRED (US Treasuries, policy rates, credit spreads, US macro, FX), ECB Yield Curve API and ECB Survey of Professional Forecasters (euro curve and inflation expectations), Yahoo Finance (all index levels, P/E proxies, commodities), and targeted web search (European/Asian bond yields, non-USD FX, BOJ policy, economic calendar, news).