2026 07 20
Global Financial Briefing — Monday, July 20, 2026
Market Overview
Markets are navigating a collision of two forces today: an escalating US-Iran military conflict pushing energy prices higher, and a heavy earnings week (roughly 80 S&P 500 companies reporting, including Tesla, Alphabet, IBM, ServiceNow, and Intel). Fresh US airstrikes on Iran over the weekend, plus the reported death of a third American service member in northern Iraq, kept risk sentiment cautious into Monday's open. Oil briefly topped $91/bbl on Brent last week before easing; as of the latest yfinance data, WTI trades at $82.12 (+0.42%) and Brent at $88.98 (+1.00%). US equities are modestly higher intraday (S&P 500 +0.20%, Nasdaq 100 +0.70%) as chip-sector names stabilize after Friday's AI-driven selloff (S&P 500 -1.0%, Nasdaq Composite -1.4%, VIX +12.2% to 18.77 (FRED VIXCLS, 2026-07-17)).
Fixed income and currency markets are showing clearer signs of the geopolitical/inflation-risk transmission: the 10-Year US Treasury sits at 4.57% (FRED DGS10, 2026-07-16), the UK 10-Year Gilt is near a two-month high around 4.95% on rising Bank of England tightening expectations, and Japan's 10-Year JGB climbed to 2.73% on Friday as oil-driven inflation risk builds. The Bank of Japan's June 16 hike to 1.00% — its highest policy rate since 1995 — combined with a weak yen (USD/JPY ~162.5) keeps BOJ normalization firmly in focus. The Fed funds target sits at 3.50-3.75% (effective rate 3.63%), and the US Treasury curve remains only modestly positive (10Y-2Y spread of 37 bps) — not inverted, but well short of a historically steep curve.
Divergence between regions is notable: European equities are broadly softer on the day (STOXX 600 -0.30%, FTSE 100 -0.71%, SMI -0.62%) while the CAC 40 and DAX are little changed. In Asia-Pacific, Japan's market is closed for Marine Day (a national holiday), leaving the Nikkei's level frozen at Friday's close, while Hang Seng (+2.36%) and Shanghai Composite (+0.85%) posted solid gains and the Kospi fell sharply (-4.46%). Credit markets remain notably calm relative to equity volatility: US investment-grade and high-yield OAS spreads (79 bps and 273 bps respectively) sit at historically tight levels, suggesting credit investors are not yet pricing meaningful stress from the geopolitical backdrop.
Global Indices Snapshot
Americas
| Index | Level | Day Chg | Day Chg % | Source |
|---|---|---|---|---|
| S&P 500 | 7,472.88 | +15.19 | +0.20% | yfinance ^GSPC |
| Nasdaq 100 | 28,792.92 | +200.26 | +0.70% | yfinance ^NDX |
| Dow Jones | 51,975.69 | -170.73 | -0.33% | yfinance ^DJI |
| Brazil IBOV | 173,898.95 | +184.88 | +0.11% | yfinance ^BVSP |
Americas data reflects today's close/intraday session (20 Jul).
Europe
| Index | Level | Day Chg | Day Chg % | Source |
|---|---|---|---|---|
| Euro STOXX 600 | 639.60 | -1.93 | -0.30% | yfinance ^STOXX |
| Euro STOXX 50 | 6,227.40 | -3.47 | -0.06% | yfinance ^STOXX50E |
| CAC 40 | 8,340.11 | +1.30 | +0.02% | yfinance ^FCHI |
| DAX | 24,846.69 | +15.71 | +0.06% | yfinance ^GDAXI |
| FTSE 100 | 10,524.76 | -75.61 | -0.71% | yfinance ^FTSE |
| SMI (Swiss) | 14,254.36 | -89.34 | -0.62% | yfinance ^SSMI |
European data reflects today's close (20 Jul).
Asia-Pacific
| Index | Level | Day Chg | Day Chg % | Source |
|---|---|---|---|---|
| Nikkei 225 † | 64,141.12 † | — | — | yfinance ^N225 |
| Hang Seng | 25,143.05 | +580.81 | +2.36% | yfinance ^HSI |
| Shanghai Comp | 3,796.28 | +32.13 | +0.85% | yfinance 000001.SS |
| ASX 200 | 8,791.30 | -5.40 | -0.06% | yfinance ^AXJO |
| Kospi (Korea) | 6,516.27 | -304.33 | -4.46% | yfinance ^KS11 |
Asia-Pacific data (ex-Japan) reflects today's close (20 Jul). † Nikkei 225: 20 Jul 2026 is Marine Day — market closed today. Level reflects Friday, 17 Jul close.
Emerging Markets
| Index | Level | Day Chg % | Source |
|---|---|---|---|
| MSCI EM (EEM) | 63.83 | +0.85% | yfinance EEM |
| India Nifty 50 | 24,238.50 | -0.39% | yfinance ^NSEI |
| South Africa (EZA) | 61.89 | -0.76% | yfinance EZA |
Index Valuations & Investment Risk
Valuation Table
| Index | Trailing P/E (live) | Hist avg trailing P/E (†) | Premium/Discount |
|---|---|---|---|
| S&P 500 | 26.79x | ~16-18x | +57.6% |
| Nasdaq 100 | 31.08x | ~25-30x | +13.0% |
| Euro STOXX 600 | 18.48x | ~15-17x | +15.5% |
| CAC 40 | 17.55x | ~14-16x | +17.0% |
| DAX | 18.16x | ~15-17x | +13.5% |
| FTSE 100 | 17.59x | ~13-15x | +25.6% |
| Nikkei 225 | 21.01x | ~20-22x | +0.0% |
| MSCI EM | 16.45x | ~13-15x | +17.5% |
(†) Hist avg trailing P/E: static long-run reference constants.
Trailing P/E (live): sourced from yfinance trailingPE on ETF proxies (SPY, QQQ, EXSA.DE, CAC.PA,
EXS1.DE, ISF.L, 1321.T, EEM). Premium/discount computed vs the historical-average midpoint;
figures above 20% are bolded as elevated. The S&P 500's +57.6% premium exceeds the 40% threshold
treated here as "historically stretched."
Investment Risk Assessment for ETF Investors
United States (S&P 500 / Nasdaq ETFs) SPY's trailing P/E of 26.79x sits 57.6% above the ~16-18x long-run historical average — historically stretched on that measure. Earnings yield is 1÷26.79 = 3.73%; against the 10Y Treasury yield of 4.57% (FRED DGS10), the Equity Risk Premium is -0.84% — negative, meaning Treasuries currently yield more than S&P 500 earnings. This is historically a caution signal for forward equity returns, and it comes alongside the S&P 500 trading only about 2% off its all-time high (7,620.90) even as the market remains volatile around AI/chip-sector sentiment. QQQ's premium is more moderate (+13.0% vs history). Real yields (FRED DFII10, 2.35%) remain elevated, which continues to raise the discount rate applied to future earnings — a headwind for long-duration growth names in particular. Concentration in mega-cap AI/semiconductor names remains the key idiosyncratic risk highlighted by Friday's chip-led selloff.
Europe (STOXX 600 / CAC 40 / DAX ETFs) European valuations are richer than their own history but cheaper than the US in absolute terms: STOXX 600 (EXSA.DE proxy) trades at 18.48x, +15.5% over its historical average. Using the ECB AAA euro-area 10Y yield (3.15%, ECB YC API) as the Bund proxy, the euro earnings yield of 5.41% (1÷18.48) produces a positive Equity Risk Premium of +2.26% — a meaningfully more supportive backdrop for equities relative to bonds than in the US. FTSE 100's +25.6% premium is the most stretched reading in the region. Currency risk is live for non-EUR/GBP investors given ongoing yen and dollar cross-currents; geopolitical risk (Middle East-driven energy costs) is a direct European inflation channel given the region's energy-import dependence.
Japan (Nikkei / TOPIX ETFs) The Nikkei's proxy trailing P/E (1321.T, 21.01x) is essentially in line with its ~20-22x historical range — the only major index shown here trading near fair value. The BOJ's June 16 hike to 1.00% (highest since 1995) and stated intent to move gradually toward a ~2% neutral rate is a genuine policy-normalization risk for JGB-sensitive names, and JPY weakness (USD/JPY ~162.5) makes currency-hedging decisions consequential for unhedged foreign holders. Japan's market is closed today for Marine Day.
Emerging Markets (MSCI EM ETFs) EEM's trailing P/E of 16.45x is +17.5% above its historical average — a discount to DM valuations in absolute P/E terms but no longer "cheap" relative to its own history. China's weight in the index, currency risk, and political risk remain the standing considerations; today's EEM move (+0.85%) was led by strength in Hang Seng (+2.36%) and Shanghai (+0.85%).
Overall Risk Score (qualitative, not financial advice): - United States: High valuation risk / low margin of safety — stretched P/E, negative ERP. - Europe: Moderate — valuations elevated vs history but supported by a positive ERP. - Japan: Moderate — valuation near fair value, but BOJ policy-normalization and currency risk are live. - Emerging Markets: Moderate — valuation discount to DM narrowing; country/currency risk persists.
Disclaimer: This is financial information, not personalised investment advice. Past valuations do not guarantee future returns. Consult a financial advisor before investing.
US Economic Indicators (FRED - authoritative)
| Indicator | Current | Prior | Delta | Reference Date | FRED Series |
|---|---|---|---|---|---|
| CPI YoY % | 3.46% | 4.17% | -0.71pp | 2026-06 | CPIAUCSL |
| Core CPI YoY % | 2.57% | 2.82% | -0.26pp | 2026-06 | CPILFESL |
| Unemployment Rate | 4.2% | 4.3% | -0.1pp | 2026-06 | UNRATE |
| Nonfarm Payrolls | 158,984k | 158,927k | +57k | 2026-06 (m/m chg) | PAYEMS |
| 10Y TIPS Real Yield | 2.35% | 2.32% | +0.03pp | 2026-07-16 | DFII10 |
Note: FRED macro data is monthly and typically lags 4-6 weeks; the June 2026 CPI/payrolls reference month is the latest available.
Other economic releases today: no specific same-day scheduled US/global release with an actual-vs-consensus print was identified via search for July 20, 2026. Markets are instead focused on the start of a heavy earnings week (Tesla, Alphabet, IBM, ServiceNow, Intel among the ~80 S&P 500 companies reporting) and the ongoing US-Iran conflict as the dominant near-term catalysts.
Fixed Income & Bond Analysis
Policy Rates
| Central Bank | Rate | Source |
|---|---|---|
| Fed Funds (upper) | 3.75% | FRED DFEDTARU |
| Fed Funds (lower) | 3.50% | FRED DFEDTARL |
| Effective FFR | 3.63% | FRED DFF |
| ECB Deposit Rate | 2.25% | FRED ECBDFR |
| BOJ Policy Rate | 1.00% | web search (hiked 2026-06-16, effective 2026-06-17) |
| BOE Bank Rate | ~3.73% (SONIA/FRED) | FRED IUDSOIA; formal Bank Rate reported at 3.75% per web search |
Government Bond Yields
| Country | 2Y Yield | 10Y Yield | 30Y Yield | Source |
|---|---|---|---|---|
| USA | 4.16% | 4.57% | 5.09% | FRED |
| Germany (AAA euro proxy) | 2.70% | 3.15% | 3.60% | ECB YC API |
| France | (not retrieved) | (not retrieved) | (not retrieved) | — |
| UK | (not retrieved) | 4.95% | (not retrieved) | web |
| Japan | (not retrieved) | 2.73% | (not retrieved) | web |
| Italy | (not retrieved) | (not retrieved) | (not retrieved) | — |
Germany/euro-area figures use the ECB AAA-rated government bond curve (Svensson model) as the Bund proxy; the OAT-Bund and BTP-Bund spreads are not available today, the euro area AAA curve standing in for the region.
Yield Curve Spreads (FRED pre-computed): - 10Y-2Y spread: +37 bps (FRED T10Y2Y) — positive/not inverted, but well below a historically steep curve (>75 bps); best described as modestly positive and still historically compressed. - 10Y-3M spread: +70 bps (FRED T10Y3M) — positive, no recession signal at present.
Bund proxy note: the ECB AAA curve trades meaningfully tighter than the German Bund proper would in practice (it reflects only AAA-rated euro-area issuers), so treat the 3.15% "Germany" 10Y figure above as a lower-bound proxy rather than the literal Bund yield.
Yield Curve Charts
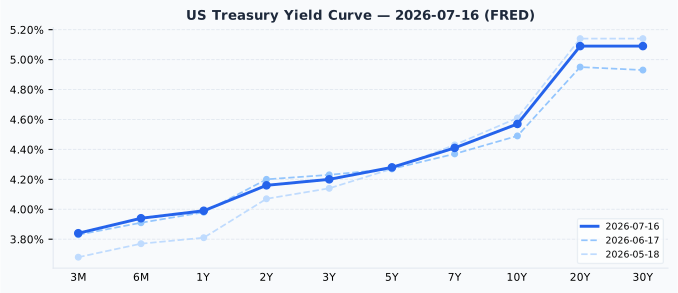
The US curve is upward-sloping across its full length with a modest hump-free rise from the 3-month bill (3.84%) out to the 30-year bond (5.09%) — positively sloped but still historically flat relative to pre-2022 norms. Versus one month ago (17 Jun 2026), short-end yields (3M-2Y) are little changed to slightly lower, while the long end (20Y/30Y) has risen roughly 14-16 bps, steepening the curve modestly over the period.
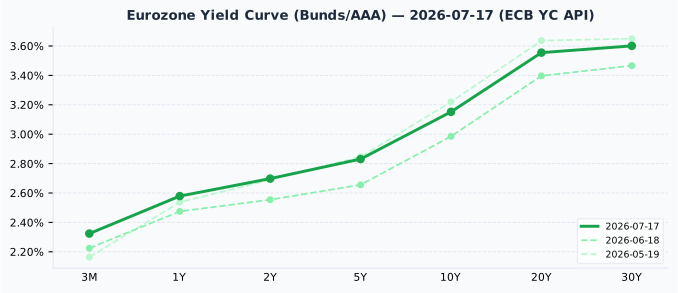
The eurozone AAA curve is also upward-sloping, rising from 2.32% at 3 months to 3.60% at 30 years. Compared to one month ago (18 Jun 2026), yields across the curve have risen by roughly 15-20 bps at most maturities, a bigger one-month shift than in the US curve, consistent with the oil-driven inflation-risk repricing discussed above.
Credit Markets (from FRED — authoritative)
| Market | OAS Spread | Series ID |
|---|---|---|
| US Investment Grade | 79 bps | BAMLC0A0CM |
| US High Yield | 273 bps | BAMLH0A0HYM2 |
| Euro High Yield | 252 bps | BAMLHE00EHYIOAS |
Both US IG (79 bps, below the typical 80-150 bps range) and US HY (273 bps, below the typical 300-500 bps range) sit at historically tight levels — credit markets are pricing very little stress, a contrast with the pickup in equity-market volatility (VIX 18.77, moderate territory) and the ongoing geopolitical backdrop. Euro HY at 252 bps is similarly tight.
Bond Portfolio Implications
The US Equity Risk Premium is negative (-0.84%) — Treasuries currently out-yield S&P 500 earnings, a historically unusual and cautionary signal for the relative attractiveness of US equities versus bonds at current valuations. In the euro area, the ERP is positive (+2.26%), a more supportive setup for equities relative to bonds. Duration risk remains a live consideration for bond allocators: a 100 bps rise in yields would produce roughly an 8-9% price loss on a 10-year bond, so with real yields already elevated (DFII10 at 2.35%) and short-end yields still above 3.8%, shorter-duration positioning continues to carry a meaningfully better risk/reward trade-off than in prior low-rate cycles, absent a view that yields are set to fall sharply from here.
Currencies & Commodities
Currencies:
| Pair | Rate | Source |
|---|---|---|
| EUR/USD | 1.1438 (as of 2026-07-10 — FRED lag) | FRED DEXUSEU |
| USD Index | 120.50 (as of 2026-07-10 — FRED lag) | FRED DTWEXBGS |
| USD/JPY | 162.52 | web search |
| GBP/USD | ~1.3445 | web search |
| USD/CHF | 0.8084 | web search |
Commodities (all from yfinance front-month futures):
| Commodity | Price | Day Chg % | Ticker | Source |
|---|---|---|---|---|
| Brent Crude | $88.98 | +1.00% | BZ=F | yfinance |
| WTI Crude | $82.12 | +0.42% | CL=F | yfinance |
| Gold ($/oz) | $4,013.20 | -0.14% | GC=F | yfinance |
| Silver ($/oz) | $57.05 | +1.29% | SI=F | yfinance |
| Copper ($/lb) | $6.359 | +1.50% | HG=F | yfinance |
| Nat Gas ($/MMBtu) | $2.849 | -2.13% | NG=F | yfinance |
Gold is trading 28.2% below its all-time high of $5,586.20/oz (hit within the past 52 weeks) — a meaningful pullback, not "near highs" language. Silver is 53.0% below its all-time high of $121.30/oz. WTI and Brent remain far off their historical peaks (44.2% and 39.6% below their respective all-time highs of $147.27 and $147.43), even after this week's Middle East-driven rally. Copper is only slightly below its all-time high of $6.6525/lb (-4.4%), reflecting continued strength in industrial-metal demand. Natural gas is 81.9% below its all-time high of $15.78/MMBtu — a figure set in 2005 during a very different market structure (pre-shale), so it is a much less meaningful reference point than the commodity's own 52-week range ($2.483-$7.827).
Crypto: no notable (>3%) moves were surfaced in today's searches; omitted for brevity.
Sector & Theme Highlights
The dominant cross-market theme remains the tension between AI/semiconductor infrastructure capex optimism (AMD +4.5% premarket on a new Microsoft data-center partnership) and elevated sensitivity to any AI-related earnings disappointment, which drove Friday's broad tech selloff. Energy is the second major theme, with Middle East conflict escalation driving oil higher and raising inflation-risk premia across the UK, Japan, and euro-area rate curves. Financial markets continue to treat higher energy prices as an inflation-transmission risk rather than a growth shock for now, per search commentary, with analysts flagging potential US-Iran negotiations in coming weeks as a possible de-escalation catalyst.
Top Stories (Global)
- US conducts fresh airstrikes on Iran; a third American service member is reported killed in northern Iraq, keeping geopolitical risk elevated into the new week (TheStreet, CNBC).
- Oil jumped as US-Iran attacks escalated last week, with Brent briefly topping $91/bbl — its highest level since June — before easing; WTI and Brent are up modestly again today (yfinance, Bloomberg).
- US equities recover Monday after Friday's chip-led selloff (S&P 500 -1.0%, Nasdaq Composite -1.4% Friday), with the VIX up 12.2% to 18.77 (TheStreet, FRED VIXCLS).
- AMD shares rose ~4.5% premarket after Microsoft announced it will use AMD's Helios system in its data centers, reinforcing the AI-infrastructure capex theme (CNBC).
- A heavy earnings week is underway: roughly 80 S&P 500 companies report this week, including Tesla, Alphabet, IBM, ServiceNow, and Intel; the S&P 500 finished last week below its 50-day moving average (CNBC).
- The Bank of Japan's June 16 hike to 1.00% — the highest policy rate since 1995 — continues to reverberate through JGB yields (10Y at 2.73%) and a weak yen (USD/JPY ~162.5); board member Naoki Tamura has flagged a longer-run path toward a ~2% neutral rate (Bloomberg, CNBC).
- UK Gilt yields are near a two-month high (10Y ~4.95%) as escalating Middle East tensions push oil to one-month highs, reinforcing expectations the Bank of England will continue tightening.
Looking Ahead
- Central banks: BOJ has signalled further gradual hikes toward a ~2% neutral rate after its June move to 1.00%; no specific date for the next policy decision was available.
- Earnings: a heavy week ahead, with ~80 S&P 500 companies reporting, including Tesla, Alphabet, IBM, ServiceNow, and Intel.
- Geopolitical: the US-Iran conflict remains the dominant near-term risk, with oil-supply disruption risk (including reports of a US naval blockade on Iran) the key transmission channel to watch; some analysts see potential for negotiations in coming weeks.
- Market closures (next 5 calendar days from 2026-07-20): none — no holidays are scheduled across the tracked markets (US, GB, DE, FR, JP, AU, CH, CA, KR, BR, IN) in this window per the holiday calendar. The next upcoming closure is Swiss National Day on 2026-08-01, followed by Japan's Mountain Day (2026-08-11), France's Assumption Day (2026-08-15), and South Korea's Liberation Day (2026-08-17).