2026 07 31
Global Financial Briefing — Friday, 31 July 2026
Americas index levels, commodities and day changes reflect the 31 July closing print. Fixed income, FX and macro figures are dated inline.
Market Overview
Global markets were firmly risk-on Friday, driven by an unrelenting AI/semiconductor rally that started on Wall Street and swept through Asia overnight. US Treasury yields climbed alongside equities — an unusual combination that signals growth optimism rather than a defensive bid — with the 10-year yield reportedly touching its highest level since January 2025 as Big Tech (Microsoft, Amazon, Meta) reaffirmed aggressive AI capex plans. The S&P 500 (+0.70%), Nasdaq 100 (+0.60%) and Dow (+0.54%) all closed higher, with Amazon shares jumping roughly 10% on earnings while Apple lagged.
The standout story was South Korea: the Kospi staged its largest single-day gain on record, surging 17.9% to 6,595.45, as Samsung Electronics (+28%) and SK Hynix (+30%) exploded higher on chip/AI optimism following a brutal three-day, ~21% sell-off into Thursday's close. The move was violent enough that the Korea Exchange briefly suspended program trading to cool volatility. Japan's Nikkei 225 rode the same regional chip tailwind, closing up 4.03%. Europe was more subdued and mixed — continental bourses edged higher while the FTSE 100 and Swiss SMI slipped modestly — and emerging markets broadly outperformed (MSCI EM ETF +0.79%), reflecting the tech-led bid. Oil rose on a fresh geopolitical flashpoint: Iran reportedly blocked two vessels from exiting the Strait of Hormuz, while gold and silver fell as risk appetite reduced safe-haven demand.
Valuations remain a live debate: the S&P 500's live trailing P/E (26.8x) sits roughly 58% above its historical average, and the resulting equity risk premium versus the 10-year Treasury is now negative — a setup that has historically preceded softer forward equity returns even as near-term momentum stays strong. The CBOE VIX sits at 17.09 (FRED VIXCLS, 2026-07-30) — a moderate reading (15-20 band), down from 20.66 earlier this week, consistent with today's broad risk-on tone rather than complacency or stress.
Global Indices Snapshot
Americas
Americas data reflects the 31 Jul close.
| Index | Level | Day Chg | Day Chg % | Source |
|---|---|---|---|---|
| S&P 500 | 7,489.72 | +52.09 | +0.70% | yfinance ^GSPC |
| Nasdaq 100 | 28,274.20 | +167.85 | +0.60% | yfinance ^NDX |
| Dow Jones | 52,491.20 | +283.14 | +0.54% | yfinance ^DJI |
| Brazil IBOV | 177,999.00 | +840.14 | +0.47% | yfinance ^BVSP |
FRED SP500 cross-check: 7,489.72 for 2026-07-31 matches the yfinance ^GSPC close to the cent. The Dow Jones close differed from its intraday print by only 0.01%.
Europe
European data reflects today's close (31 Jul).
| Index | Level | Day Chg | Day Chg % | Source |
|---|---|---|---|---|
| Euro STOXX 600 | 649.19 | −0.76 | −0.12% | yfinance ^STOXX |
| Euro STOXX 50 | 6,358.01 | +13.61 | +0.21% | yfinance ^STOXX50E |
| CAC 40 | 8,509.64 | +24.00 | +0.28% | yfinance ^FCHI |
| DAX | 25,629.24 | +17.21 | +0.07% | yfinance ^GDAXI |
| FTSE 100 | 10,868.05 | −29.22 | −0.27% | yfinance ^FTSE |
| SMI (Swiss) | 14,346.14 | −46.35 | −0.32% | yfinance ^SSMI |
Asia-Pacific
Asia-Pacific data reflects today's close (31 Jul).
| Index | Level | Day Chg | Day Chg % | Source |
|---|---|---|---|---|
| Nikkei 225 | 64,362.02 | +2,494.59 | +4.03% | yfinance ^N225 |
| Hang Seng | 25,884.43 | +25.55 | +0.10% | yfinance ^HSI |
| Shanghai Comp | 3,832.26 | +27.57 | +0.72% | yfinance 000001.SS |
| ASX 200 | 8,976.80 | +9.10 | +0.10% | yfinance ^AXJO |
| Kospi (Korea) | 6,595.45 | +1,001.89 | +17.91% | yfinance ^KS11 |
Kospi note: this is a genuine, well-corroborated move, not a data error — see Market Overview and Top Stories. It follows a ~21% decline over the prior three sessions; even after today's record rally the index remains ~30% below its 52-week/all-time high of 9,385.59.
Emerging Markets
| Index | Level | Day Chg % | Source |
|---|---|---|---|
| MSCI EM (EEM) | 64.09 | +0.79% | yfinance EEM |
| India Nifty 50 | 24,383.60 | +0.27% | yfinance ^NSEI |
| South Africa (EZA) | 63.62 | −0.76% | yfinance EZA |
Index Valuations & Investment Risk
Valuation Table
| Index | Trailing P/E (live) | Hist avg trailing P/E (†) | Premium/discount |
|---|---|---|---|
| S&P 500 | 26.82x | ~16-18x | +57.8% |
| Nasdaq 100 | 30.56x | ~25-30x | +11.1% |
| Euro STOXX 600 | 18.77x | ~15-17x | +17.3% |
| CAC 40 | 17.91x | ~14-16x | +19.4% |
| DAX | 18.74x | ~15-17x | +17.1% |
| FTSE 100 | 18.16x | ~13-15x | +29.7% |
| Nikkei 225 | 20.88x | ~20-22x | −0.6% |
| MSCI EM | 16.56x | ~13-15x | +18.3% |
(†) Hist avg trailing P/E: static long-run reference constants.
Trailing P/E (live): sourced from yfinance trailingPE on ETF proxies (SPY, QQQ, EXSA.DE, CAC.PA, EXS1.DE, ISF.L, 1321.T, EEM). Premium/discount computed as (live P/E ÷ historical-average midpoint − 1). Bold = >20% above historical average.
Investment Risk Assessment for ETF Investors
United States (S&P 500 / Nasdaq ETFs) SPY's live trailing P/E of 26.82x is roughly 58% above the S&P 500's long-run historical average (~16-18x) — historically stretched territory. Earnings yield is (1÷26.82) = 3.73%, versus the 10-year Treasury yield of 4.67% (FRED DGS10, 2026-07-29): the resulting equity risk premium is −0.94pp — negative, meaning Treasuries currently yield more than S&P 500 earnings. That's a historically weak setup for forward equity returns, even though momentum remains strong: the index closed up 0.70% and near its 52-week high of 7,620.90, ending the session ~1.7% below it. QQQ's 30.56x trailing P/E is closer to its own historical band (~25-30x), suggesting the stretch is concentrated in mega-cap AI names rather than broad-based. The 10Y TIPS real yield (FRED DFII10) sits at 2.41%, a meaningfully positive real discount rate that raises the bar for growth-stock valuations. Concentration risk (AI capex-driven earnings) and rate sensitivity remain the key watch items.
Europe (STOXX 600 / CAC 40 / DAX ETFs) EXSA.DE's trailing P/E of 18.77x is about 17% above the STOXX 600's historical average (~15-17x) — moderately elevated but far less stretched than the US. Using the ECB AAA euro-area 10-year yield (3.20%, ECB YC API, 2026-07-30) as a Bund proxy, the earnings yield of (1÷18.77) = 5.33% produces an ERP of +2.13pp — solidly positive, a much more attractive equity-vs-bond trade-off than in the US. CAC 40 (17.91x) and DAX (18.74x) show similar modest premiums (+19% and +17%). Currency risk for non-EUR investors and ongoing European fiscal/political headline risk remain relevant considerations.
Japan (Nikkei / TOPIX ETFs) 1321.T's trailing P/E of 20.88x is essentially in line with Nikkei's historical average (~20-22x) — fair value, not stretched. The BOJ held its policy rate at 1.00% at the July 2026 meeting (after a 25bp hike on 16 June 2026 to the highest level since September 1995), with most economists expecting a further hike in Q4 2026. Rate-hike risk is the primary headwind; JPY currency-hedge considerations matter for USD/EUR-based investors given ongoing BOJ normalization.
Emerging Markets (MSCI EM ETFs) EEM's trailing P/E of 16.56x is about 18% above its historical average (~13-15x), still a meaningful discount to US valuations. Today's Kospi/chip-driven rally is a reminder of EM's higher volatility and its heavy tilt toward semiconductor/tech names (Samsung, SK Hynix). China weight (Shanghai Composite still ~37% below its all-time high) and currency/political risk remain structural considerations.
Overall Risk Score (qualitative, not financial advice): - US large-cap: High valuation risk / low margin of safety — negative ERP is a genuine warning signal - Europe: Moderate — fair-to-slightly-rich valuation, but a meaningfully positive ERP - Japan: Moderate — fair value on P/E, but policy-rate risk is rising - Emerging Markets: Moderate — valuation discount to DM intact, but single-sector/single-country volatility (Korea today) is a live risk
Disclaimer: This is financial information, not personalised investment advice. Past valuations do not guarantee future returns. Consult a financial advisor before investing.
US Economic Indicators (FRED - authoritative)
| Indicator | Current | Prior | Delta | Reference Date | FRED Series |
|---|---|---|---|---|---|
| CPI YoY % | 3.46% | 4.17% | −0.71pp | 2026-06 | CPIAUCSL |
| Core CPI YoY % | 2.57% | 2.82% | −0.26pp | 2026-06 | CPILFESL |
| Unemployment Rate | 4.2% | 4.3% | −0.1pp | 2026-06 | UNRATE |
| Nonfarm Payrolls | 158,984k | 158,927k | +57k | 2026-06 | PAYEMS |
| 10Y TIPS Real Yield | 2.41% | — | — | 2026-07-29 | DFII10 |
Note: FRED macro data is monthly and lags roughly 4-6 weeks. CPI and Core CPI cooled versus the prior month's print; unemployment ticked down slightly and payroll growth remains positive but modest.
Other economic releases, 31 Jul (from web search, resolved post-close): The Q2 Employment Cost Index rose 0.9% quarter-over-quarter, above the 0.8% forecast, with annual compensation growth at 3.4% — a print that raises concern for the Fed given real private-sector wages fell year-over-year for the first time since 2022. Final University of Michigan Consumer Sentiment for July came in at 55.2, a five-month high (+12% versus June) driven by falling gasoline prices and cooling inflation readings, though still 11% below a year ago.
Fixed Income & Bond Analysis
Policy Rates
| Central Bank | Rate | Source |
|---|---|---|
| Fed Funds (upper) | 3.75% | FRED DFEDTARU |
| Fed Funds (lower) | 3.50% | FRED DFEDTARL |
| Effective FFR | 3.63% | FRED DFF |
| ECB Deposit Rate | 2.25% | FRED ECBDFR |
| BOJ Policy Rate | 1.00% | web search (held Jul 2026; +25bp hike 16 Jun 2026; highest since Sep 1995) |
| BOE Bank Rate | ~3.73% (SONIA/FRED) | FRED IUDSOIA |
Government Bond Yields
| Country | 2Y Yield | 10Y Yield | 30Y Yield | Source |
|---|---|---|---|---|
| USA | 4.22% | 4.67% | 5.20% | FRED (2026-07-29) |
| Germany (AAA proxy) | 2.71% | 3.20% | 3.64% | ECB YC API (2026-07-30) |
| France | (not retrieved — ECB API succeeded, France-specific search skipped) | |||
| UK | (not found - omitted) | 5.06% | — | web search |
| Japan | — | 2.80% | — | web search |
| Italy | (not retrieved — ECB API succeeded, Italy-specific search skipped) |
Note: the "Germany" row above uses the ECB's AAA-rated euro-area yield curve as a Bund proxy — reliable for the general euro-area risk-free curve, but France- and Italy-specific spreads (OAT-Bund, BTP-Bund) are not covered here. US 10-year yield reflects FRED's 2026-07-29 observation; contemporaneous news reports the 10-year touching its highest level since January 2025 intraday today (31 Jul), which FRED's one-to-two-day publication lag does not yet capture.
Yield Curve Spreads (FRED pre-computed): - 10Y-2Y spread: +45 bps (T10Y2Y, 2026-07-30) — modestly positive/normal-sloped; not inverted, but well short of a "steep" curve (historically >~75bps) - 10Y-3M spread: +86 bps (T10Y3M, 2026-07-30) — positive, no recession signal from this measure currently
OAT-Bund Spread: not retrieved (see note above).
Yield Curve Charts
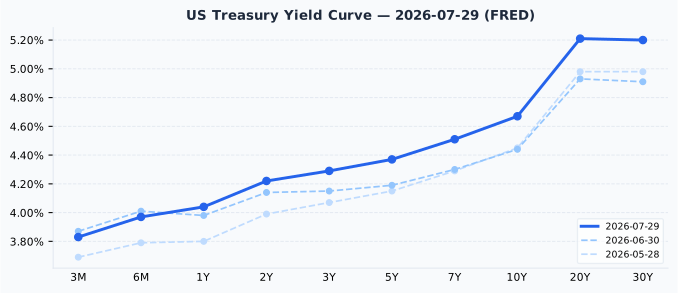
The US curve is positively sloped from the front end out to 30Y with no inversion, consistent with the +45bp 10Y-2Y spread above. Versus one month ago (30 Jun 2026), the entire curve has shifted up by roughly 20-30bps across most maturities (10Y: 4.44% → 4.67%; 30Y: 4.91% → 5.20%), reflecting the recent back-up in long-end yields tied to strong growth/AI-capex data rather than inflation fears re-emerging (real yields via DFII10 have been comparatively stable).
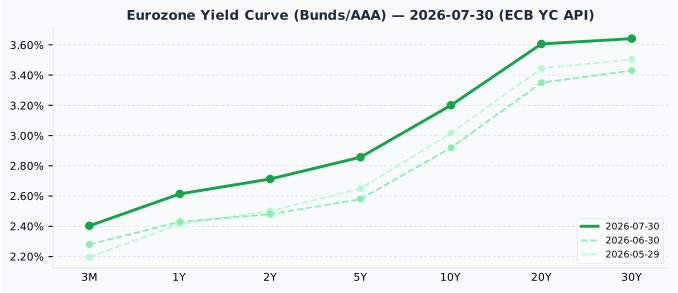
The euro-area AAA curve is also positively sloped and has steepened meaningfully over the past month: the 10Y leg rose from 2.92% (30 Jun) to 3.20% today, a ~28bp move, broadly tracking the global back-up in long-end yields.
Credit Markets (from FRED — authoritative)
| Market | OAS Spread | Series ID |
|---|---|---|
| US Investment Grade | 80 bps | BAMLC0A0CM |
| US High Yield | 284 bps | BAMLH0A0HYM2 |
| Euro High Yield | 265 bps | BAMLHE00EHYIOAS |
Both US IG (80bps, at the low end of/below the typical 80-150bps range) and US HY (284bps, below the 300-500bps "normal" band) are historically tight — a signal of market complacency and strong risk appetite rather than credit stress, consistent with today's broad risk-on tone. Euro HY (265bps) is similarly tight.
Bond Portfolio Implications
With the S&P 500's equity risk premium negative (−0.94pp) versus a strongly positive euro-area ERP (+2.13pp), the relative attractiveness of bonds vs. equities currently favors caution on US large-cap valuations specifically, not fixed income broadly. Duration risk remains real: a 100bp rise in yields would imply roughly an 8-9% price loss on a 10-year bond, and the last month has already seen the 10Y move up ~23bps. In a market where growth optimism (not inflation fear) is pushing yields higher, shorter-duration positioning reduces sensitivity to further AI-capex-driven yield backups while still capturing a 3.5-4.7% yield across the US curve.
Currencies & Commodities
Currencies:
| Pair | Rate | Source |
|---|---|---|
| EUR/USD | 1.1385 | FRED DEXUSEU (2026-07-24) |
| USD Index | 120.71 | FRED DTWEXBGS (2026-07-24) |
| USD/JPY | 159.72 | web search |
| GBP/USD | 1.3437 | web search (derived from USD/GBP 0.74423) |
| USD/CHF | 0.8061 | web search |
Note: FRED's EUR/USD and Broad USD Index observations lag to 2026-07-24 (a week old) — more than the typical one-business-day lag. Treat as directional context rather than a live spot rate.
Commodities (all from yfinance MCP front-month futures):
| Commodity | Price | Day Chg % | Ticker | Source |
|---|---|---|---|---|
| Brent Crude | $90.12 | +1.22% | BZ=F | yfinance |
| WTI Crude | $84.67 | +1.29% | CL=F | yfinance |
| Gold ($/oz) | $4,107.00 | −1.29% | GC=F | yfinance |
| Silver ($/oz) | $57.79 | −2.09% | SI=F | yfinance |
| Copper ($/lb) | $6.4655 | −0.14% | HG=F | yfinance |
| Nat Gas ($/MMBtu) | $2.747 | −0.40% | NG=F | yfinance |
Oil closed higher on fresh Strait of Hormuz tensions (Iran reportedly blocking two vessels from transit), with WTI and Brent both gaining on the day. Gold closed at $4,107.00/oz, 26.5% below its all-time high of $5,586.20 (also its 52-week high) — a meaningful pullback, not "near highs," as the session's risk-on rotation reduced safe-haven demand. Silver closed at $57.79/oz, 52.4% below its all-time high of $121.30 — well off its peak, and fell further into the close. Copper closed at $6.4655/lb, 2.8% below its all-time high of $6.6525/lb — slightly below record levels; note copper's day change flipped from positive (+0.19%) intraday to negative (−0.14%) at the close, a genuine reversal rather than a data error. Natural gas closed at $2.747/MMBtu, far (−82.6%) below its 2022 all-time high of $15.78, reflecting the structurally different supply backdrop since then.
Crypto: no notable moves above 3% today.
Sector & Theme Highlights
The dominant global theme today is AI/semiconductor capex momentum: strong Big Tech earnings (Microsoft, Amazon, Meta) reignited the AI trade in the US overnight, which then powered an extraordinary rebound in Korean and Japanese chip stocks (Samsung +28%, SK Hynix +30%, Kospi +17.9%, Nikkei +4.0%). Best-performing regions today: South Korea (by a wide margin), followed by Japan and mainland China. Laggards: UK and Switzerland, both modestly negative, and gold/silver as safe-haven flows reversed. A secondary theme is energy/geopolitical risk, with oil higher on Strait of Hormuz tensions. In corporate news, exchange/fintech consolidation continues (ICE's $6bn acquisition of MarketAxess), and dividend-cut risk remains a live issue for income investors (TELUS −12.3% on a 55% dividend reduction).
Top Stories (Global)
- South Korea's Kospi posts its largest-ever single-day gain (+17.9%), rebounding from a brutal three-day, ~21% sell-off, as Samsung Electronics (+28%) and SK Hynix (+30%) surged on AI/chip optimism; the Korea Exchange briefly suspended program trading to manage volatility. (CNBC, ABC News)
- US 10-year Treasury yield reportedly hit its highest level since January 2025 intraday, even as US equities also rose — a growth-driven, not inflation-driven, move tied to continued Big Tech AI capex commitments. (TheStreet, Bloomberg)
- Oil prices rose after Iran reportedly blocked two vessels from exiting the Strait of Hormuz, a fresh geopolitical flashpoint for global energy markets.
- Intercontinental Exchange (parent of NYSE) agreed to acquire MarketAxess for $6 billion, expanding its footprint in electronic fixed-income trading.
- Amazon shares jumped roughly 10% on earnings while Apple slid, underscoring divergent Big Tech reactions within the same AI-capex narrative.
- TELUS Corporation shares fell 12.3% after the company cut its dividend by 55%.
- Japan's Nikkei 225 rallied 4.0%, riding the same regional semiconductor tailwind as Korea, even as the BOJ holds its policy rate at a 30-year high of 1.00%.
Looking Ahead
Key events in the next 1-5 trading days: - US July jobs report (Nonfarm Payrolls) is due the first Friday of August (7 Aug 2026) — the next major test of the labor-market cooling trend seen in the June data above. - BOJ: no meeting imminent; consensus (per web search) points to a further hike in Q4 2026 (October or December). - Big Tech earnings season continues; watch for any follow-through (or reversal) in the AI-capex trade after this week's Microsoft/Amazon/Meta reports. - Monitor Strait of Hormuz developments for further oil-price impact. - Korea: watch for any regulatory follow-up given the KRX's program-trading suspension during today's extreme volatility.
Market closures (Nager.Date holiday calendar), next 5 across tracked countries: - Switzerland — Swiss National Day — 1 Aug 2026 - Japan — Mountain Day — 11 Aug 2026 - France — Assumption Day — 15 Aug 2026 - South Korea — Liberation Day — 17 Aug 2026 - United Kingdom — Summer Bank Holiday — 31 Aug 2026
(India's 2026 holiday calendar remains unavailable.)