Global Financial Briefing — Monday, 14 September 2026
Americas index levels, commodities and day changes reflect the 14 September closing print; US Treasury figures, curve spreads and the US yield curve chart use the settled 14 September par curve. Fixed income outside the US, FX and macro figures are dated inline.
Market Overview
The week that has to absorb three central bank decisions opened with the two things it least wanted: a diplomatic setback in the Gulf and a challenge to the AI trade from inside the AI industry. Oman's foreign minister said late on Sunday that Monday's meeting in Salalah between Iran and the Gulf states on a temporary shipping arrangement for the Strait of Hormuz had been postponed "in the interests of consensus", after a request from Saudi Arabia; Bahrain had already refused to attend, no other state had confirmed, and an attack on an Iranian cargo vessel in the strait had killed one person hours before. Saudi Arabia had meanwhile shut the East-West pipeline, the 7 mn b/d line to Yanbu on the Red Sea that has been the kingdom's main route around Hormuz since the war began, after drone strikes on Thursday and Friday launched from Iraq's Maysan province; it had been carrying 4 to 5 mn b/d, Yanbu can export from stocks for five to seven days, and repairs are put at five to six weeks. Brent's Friday retracement on the meeting reversed, then half of the reversal was given back into the settlement: the November contract settled at $105.68, up 1.02% on the 11 September settlement, and WTI at $101.39, up 1.34%, both having traded about 2.5% higher at midday. The market's reading is exactly the one Friday's briefing said would be tested on Monday: the shortage is not being managed, and the one route that made it manageable is offline.
The AI story was the larger one for equities. Anthropic's chief executive Dario Amodei published an essay on Saturday arguing that the industry must "slow the pace at which we improve the capabilities of AI models", proposing independent evaluators embedded in the frontier labs, then federal oversight, then international coordination, and estimating the approach could buy one or two years for safety work; OpenAI's Sam Altman endorsed it within hours ("I agree with Dario that we need to pace the frontier") and said OpenAI would adopt one of the safeguards. Two other things landed with it: OpenAI is delaying its IPO to 2027, Altman citing safety and the finance chief citing market volatility and SpaceX's post-listing trading, and Anthropic has chosen Nasdaq for a listing this autumn. The chip complex took it as a demand signal. Nvidia closed down 3.4% at $210.96, Marvell, Micron and Super Micro about 6%, Intel and AMD more than 4%; in Europe Soitec fell 12.6%, Infineon 7.6% and ASML about 5%; in Seoul SK hynix lost 6.35% and Samsung Electronics 4.05%, and the Kospi closed down 3.26% at 6,684.37, its third straight loss, with foreign investors net sellers of KRW 3.9 tn for a fourth session. Cybersecurity was the mirror image, CrowdStrike closing up 13.9%, Zscaler 16.5% and Palo Alto Networks 13.1%, the market's reading being that an industry that pauses on capability spends on containment instead. The S&P 500 closed down 0.48% at 7,619.98, the Nasdaq 100 down 0.82% and the Dow down 0.29%, the losses widening through the afternoon after Bank of America told the Barclays conference that its third-quarter investment banking fees would fall more than 10%, which took the bank down 5.14% and JPMorgan and Wells Fargo about 1.7% with it; the modest headline moves conceal a sharp rotation underneath.
The bond market delivered its own headline: the 10-year Treasury yield touched 5% during the session for the first time since October 2023, and the settled 14 September par curve has it at 4.97%, up 1 bp on Friday, with the 2-year up 2 bp at 4.65%, the 30-year down 1 bp at 5.34% and the 3-month bill up 4 bp at 4.11% as the front end prices Wednesday's hike, now at 85% to 88% on CME FedWatch with Goldman Sachs having moved to expecting a move. The midday pullback below Friday's level did not survive to the settlement: the front end sold, the long end was fractionally better, and the curve flattened by another basis point. Europe closed lower and rotated the same way: the STOXX 600 fell 0.49% to 635.99, the Euro STOXX 50 1.02%, the CAC 40 0.76% and the DAX 0.50%, technology down about 2%, miners 2.1% on copper's 2.4% fall, healthcare up 2.2% with GSK 3.6% higher, while the FTSE 100 (+0.44%) and the SMI (+0.75%) rose on energy and defensives. The euro AAA curve for 11 September rose 2 bp at 10 years to 3.52% and 3 bp at 2 years to 3.13%, a third day of post-ECB repricing; the 10-year OAT is at 4.50%, a 99 bp spread over the Bund, out from 94 bp on Friday, and the 10-year gilt is at 5.36% ahead of Thursday's Bank of England decision. Asia was uniformly weak outside Hong Kong: the Nikkei fell 0.81%, Shanghai 0.07%, the ASX 200 rose 0.10% and the Hang Seng 0.45%. The VIX closed Friday at 15.84 (FRED VIXCLS, 11 September), moderate, and is quoted at 16.72 intraday; US high yield at 265 bp and investment grade at 80 bp remain historically tight. Credit has still not moved; the equity market is repricing one sector, not the asset class.
Global Indices Snapshot
Americas
| Index | Level | Day Chg | Day Chg % | Source |
|---|---|---|---|---|
| S&P 500 | 7,619.98 | -37.00 | -0.48% | yfinance ^GSPC |
| Nasdaq 100 | 29,127.16 | -241.28 | -0.82% | yfinance ^NDX |
| Dow Jones | 52,421.20 | -152.10 | -0.29% | yfinance ^DJI |
| Brazil IBOV | 185,500.88 | -1,706.02 | -0.91% | yfinance ^BVSP |
Americas data reflects the 14 Sep close. Day changes are against the 11 September closes, and FRED's SP500 series confirms the 14 September close at 7,619.98. The S&P 500 is 2.5% below its record of 7,816.70 and closed 0.1% above its 50-day average (7,610.07), having traded through it during the afternoon; the Nasdaq 100 closed 0.2% under its own 50-day (29,193.51) and 5.3% below its record, so the AI leadership index is the one that has lost support. The Bovespa was the weakest of the four despite $105 Brent, down 0.91%, which says the foreign-selling flow out of emerging markets (EEM -2.73%) mattered more to it than the oil price.
Europe
| Index | Level | Day Chg | Day Chg % | Source |
|---|---|---|---|---|
| Euro STOXX 600 | 635.99 | -3.11 | -0.49% | yfinance ^STOXX |
| CAC 40 | 8,117.78 | -61.99 | -0.76% | yfinance ^FCHI |
| DAX | 25,440.81 | -127.75 | -0.50% | yfinance ^GDAXI |
| FTSE 100 | 10,697.57 | +47.13 | +0.44% | yfinance ^FTSE |
| SMI (Swiss) | 13,878.54 | +103.27 | +0.75% | yfinance ^SSMI |
European data reflects today's cash close (14 Sep). The Euro STOXX 50 closed at 6,260.38, down 1.02%, the worst of the group because ASML and the chip names carry more weight in it. The STOXX 600 is 2.0% below its 50-day average, 2.6% above its 200-day and 4.1% below its record of 663.41, near its lowest in about two months. The CAC 40 is 3.7% below its 50-day and 1.5% below its 200-day (8,240), the only major European index under both; the FTSE 100 and SMI are the two that rose, London on Shell, BP and TotalEnergies each about 1% higher and Zurich on the pharma bid.
Asia-Pacific
| Index | Level | Day Chg | Day Chg % | Source |
|---|---|---|---|---|
| Nikkei 225 | 63,492.99 | -518.35 | -0.81% | yfinance ^N225 |
| Hang Seng | 24,917.60 | +111.97 | +0.45% | yfinance ^HSI |
| Shanghai Comp | 3,885.33 | -2.78 | -0.07% | yfinance 000001.SS |
| ASX 200 | 8,749.90 | +8.70 | +0.10% | yfinance ^AXJO |
| Kospi (Korea) | 6,684.37 | -225.54 | -3.26% | yfinance ^KS11 |
Asia-Pacific data reflects today's close (14 Sep). The Kospi's 3.26% fall reconciles exactly with the cached 11 September close of 6,909.91 and is confirmed by the Seoul press, so it is genuine: SK hynix fell 6.35%, Samsung Electronics 4.05%, Samsung Electro-Mechanics 4.5%, Hyundai Motor 2.9%, and the Kosdaq lost 1.69%, while the banks rose (Woori +5.0%, Hana +2.2%, KB +2.1%) as money rotated out of the chip names. Foreign investors sold a net KRW 3.91 tn and institutions KRW 1.69 tn, against KRW 4.13 tn of retail buying. The index is 28.8% below its record of 9,385.59, 1.7% below its 50-day average and still 8.9% above its 200-day. The Nikkei is 12.8% below its record and 4.0% under its 50-day; the Hang Seng was the region's exception, up 0.45% on a market with little exposure to the AI capex chain.
Emerging Markets
| Index | Level | Day Chg % | Source |
|---|---|---|---|
| MSCI EM (EEM) | 65.99 | -2.73% | yfinance EEM |
| India Nifty 50 | 23,398.10 ‡ | — | yfinance ^NSEI |
| South Africa | 68.49 | -2.30% | yfinance EZA |
‡ India Nifty 50: data reflects the 11 Sep close; yfinance had not updated for 14 September, and no Indian holiday data is tracked here, so the reason could not be confirmed. EEM and EZA reflect the 14 Sep close. EEM's 2.73% fall is Korea and Taiwan: Korea and the Taiwanese chip names are the index's largest AI exposure, and a 3.3% Kospi day with SK hynix down 6% is what a 2.7% EEM day looks like. EEM closed 0.2% above its 50-day average (65.86) and 7.8% below its 52-week high of 71.57. EZA fell 2.30% with copper and the miners.
Index Valuations & Investment Risk
Valuation Table
| Index | Trailing P/E (live) | Hist avg trailing P/E (†) | Premium to hist avg midpoint |
|---|---|---|---|
| S&P 500 | 24.62x | ~16-18x | +44.8% |
| Nasdaq 100 | 28.95x | ~25-30x | +5.3% |
| Euro STOXX 600 | 17.69x | ~15-17x | +10.5% |
| CAC 40 | 16.51x | ~14-16x | +10.0% |
| DAX | 18.01x | ~15-17x | +12.6% |
| FTSE 100 | 15.35x | ~13-15x | +9.7% |
| Nikkei 225 | 21.09x | ~20-22x | +0.4% |
| MSCI EM | 14.09x | ~13-15x | +0.6% |
(†) Hist avg trailing P/E: static long-run reference constants, not live data. Trailing P/E (live): yfinance trailingPE on the ETF proxies SPY, QQQ, EXSA.DE, CAC.PA, EXS1.DE, ISF.L, 1321.T and EEM, quoted 14 September at 16:30 CEST. The US-listed proxies (SPY, QQQ, EEM) were intraday at that time; after the close they read 24.58x, 28.91x and 14.04x, each within 0.4% of the quoted figure, so the rows stand. The rest are on today's European and Asian closes. The S&P 500 premium is the only one that crosses the 40% "historically stretched" threshold; the Nasdaq 100's premium is small against its own higher history, and the Nikkei and MSCI EM trade at their long-run averages.
Investment Risk Assessment for ETF Investors
United States (S&P 500 / Nasdaq ETFs)
The S&P 500 at 24.62x trailing earnings (SPY) yields 4.06% (1÷24.62). Against the settled 10-year Treasury at 4.97% (US Treasury par curve, 14 September) the earnings yield gap is −0.91 pp: the bond pays 91 bp more in current income than the index earns, before any allowance for growth. On the real-yield version (earnings yield less DFII10 at 2.60%, US Treasury real curve, 14 September) the gap is +1.46 pp, so the correction for the fact that earnings grow with inflation while a coupon does not is worth 2.37 pp, the size of the 10-year breakeven, and it flips the sign. The Nasdaq 100 at 28.95x (QQQ) yields 3.45%, a nominal gap of −1.52 pp. See Bond Portfolio Implications for what this measure does and does not tell you; it describes today's trade-off and forecasts nothing.
What today changes is the earnings side of the fraction rather than the multiple. The AI capex chain has been the growth engine behind the index's earnings, and an industry that says publicly it will pace capability improvements is one whose customers will ask whether the $90 bn to $95 bn capex plans (Oracle's, last week) still need to be that size. The market answered by selling the suppliers (Nvidia -3%, the memory names -6%) and buying the sector that gets paid whatever the pace (cybersecurity +13% to +15%). The index closed a tenth of a percent above its 50-day average at 7,610, 2.5% below its record and 6.3% above its 200-day, with the Nasdaq 100 through its own 50-day at 29,194. With the Fed hiking into a 5% 10-year on Wednesday, a 24.6x multiple has no rate cushion, and the concentration that made the index a bet on AI capex is now a bet on how the industry paces itself.
Europe (STOXX 600 / CAC 40 / DAX ETFs)
The STOXX 600 at 17.69x (EXSA.DE) yields 5.65%; against the ECB AAA 10-year at 3.52% (11 September) the euro earnings yield gap is +2.13 pp, more than three points wider than the US gap. The CAC 40 at 16.51x yields 6.06% and the DAX at 18.01x 5.55%. On the real-yield version the euro gap is +4.17 pp against +1.46 pp for the US: the euro real 10-year, constructed as the AAA nominal 3.52% less the ECB SPF long-term HICP expectation of 2.04% (2026 Q3), is 1.49%, against a measured 2.60% US TIPS yield. Part of the nominal difference between the two regions' gaps is the difference in inflation and policy paths rather than in risk compensation; the decomposition under Real Yields puts most of it in the real rate, so the euro advantage survives the correction. The US trades at a 39% P/E premium to the STOXX 600 (24.62 against 17.69), a little wider than last week.
Today's European losses were concentrated in the semiconductor equipment and power-chip names (Soitec, ASM International, Infineon, ASML), which are a small weight in the STOXX 600 and a larger one in the Euro STOXX 50, and in the miners on copper. The risks specific to Europe are the ones in the bond table: the OAT-Bund spread at 99 bp is out from 85 bp a week ago and the French 10-year at 4.50% is at 2008 levels, the AAA 2-year has risen 44 bp in a month as the market prices an ECB path rather than a single hike, and a euro area that imports its energy is the region most exposed to a Saudi pipeline outage. A euro-based investor in euro-denominated European funds has no currency effect on the quoted value of the holding, but the STOXX 600 and CAC 40 constituents earn a large share of their profits abroad, so the FX exposure sits inside the earnings, smaller and slower than a dollar holding's, not absent.
Japan (Nikkei / TOPIX ETFs)
The Nikkei at 21.09x (1321.T) yields 4.74%, against a 10-year JGB at 2.99%, a gap of about 1.75 pp; the multiple is at its long-run average. The BOJ decides on Friday, with a hike to 1.25% expected, the highest policy rate since 1995, and the JGB 2-year at 1.84% and 30-year at 4.07% say the market has priced it. The yen at 154.41 gave back 0.5% today after a 3% monthly gain; for a euro investor the currency decision, hedged or unhedged, remains the larger call than the equity one, since a BOJ that keeps hiking into a Fed that is also hiking leaves the yen's direction to the relative pace. The Nikkei is 12.8% below its record, its chip weighting (Tokyo Electron, Advantest) carries the same AI exposure that hit Seoul today, and the index fell 0.81% rather than 3% only because that weighting is smaller.
Emerging Markets (MSCI EM ETFs)
EEM at 14.09x yields 7.10%, at its long-run average and a 43% discount to the S&P 500 multiple. Today is a reminder of what the index has become: its two largest markets after China are Taiwan and Korea, both AI hardware exporters, so an AI pacing headline hits EEM harder than it hits the S&P 500 (−2.73% against −0.48%). The China weight is a partial offset (the Hang Seng rose 0.45%, Shanghai was flat) and the dollar's 0.35% rise is the usual headwind. Chinese August activity data is due tomorrow morning; July's retail sales at +0.6% missed badly.
Overall Risk Score (qualitative, not financial advice): - United States: High valuation risk / low margin of safety. 24.6x trailing, 45% over its long-run average, a negative nominal earnings yield gap against a 10-year that touched 5%, and a Fed hike on Wednesday. Today added a new variable, the pace of the AI investment the earnings growth depends on, which the market has begun to price at the supplier level. - Europe: Moderate. A 10% premium to history, a +2.13 pp nominal gap and a +4.17 pp real gap, with the risks being the sovereign spread (OAT-Bund 99 bp), the ECB path and energy. - Japan: Moderate. At its average multiple with a BOJ hike priced; currency is the decision. - Emerging markets: Attractive relative valuation, high beta to the AI trade. 14.1x at its average, but the index's Korea and Taiwan weights make it the most exposed equity market to the pacing story.
Disclaimer: This is financial information, not personalised investment advice. Past valuations do not guarantee future returns. Consult a financial advisor before investing.
US Economic Indicators (FRED - authoritative)
| Indicator | Current | Prior | Delta | Reference Date | FRED Series |
|---|---|---|---|---|---|
| CPI YoY % | 3.35% | 3.30% (Jul) | +5 bp | Aug 2026 | CPIAUCSL |
| Core CPI YoY % | 2.45% | 2.47% (Jul) | −2 bp | Aug 2026 | CPILFESL |
| Unemployment Rate | 4.1% | — | — | Aug 2026 | UNRATE |
| Nonfarm Payrolls | +162k | — | monthly chg | Aug 2026 | PAYEMS |
| 10Y TIPS Real Yield | 2.60% | 2.55% (10 Sep) | +5 bp | 11 Sep 2026 | DFII10 (US Treasury real curve) |
No US data was released today, so the macro rows are unchanged from Friday's briefing; the prior-month CPI rates are the July observations recorded there. Only the latest observation is carried for the unemployment and payrolls series, so those Prior and Delta cells are left blank. The real 10-year is the settled 11 September figure, 5 bp above the 10 September curve.
Other economic releases today (web search):
| Release | Actual | Consensus | Prior | Reaction |
|---|---|---|---|---|
| Canada CPI, Aug, y/y | 3.0% | 3.0% | 3.0% | In line; ex-gasoline 2.4%, CPI-trim 1.9%, CPI-median 2.0%; gasoline +22.8% y/y, travel tours +26.1% |
Canada's headline rate held at 3.0% because slower gasoline inflation was offset by rent and travel costs, with the Bank of Canada's core measures all at or under 2.0% except CPI-common at 2.7%; the split between a 22.8% gasoline rate and a 2.4% ex-gasoline rate is the same energy-versus-core pattern as the US August print. China's August industrial production, retail sales and fixed-asset investment are due Tuesday at 02:00 GMT, a day later than Friday's briefing implied; the National Bureau of Statistics release list shows nothing for them today.
Fixed Income & Bond Analysis
Policy Rates
| Central Bank | Rate | Source |
|---|---|---|
| Fed Funds (upper) | 3.75% | FRED DFEDTARU (14 Sep 2026) |
| Fed Funds (lower) | 3.50% | FRED DFEDTARL (14 Sep 2026) |
| Effective FFR | 3.63% | FRED DFF (10 Sep 2026) |
| ECB Deposit Rate | 2.50% | ECB decision 10 Sep 2026 (web); FRED ECBDFR still shows 2.25% dated 14 Sep, the rate in force until the decision's effective date |
| BOJ Policy Rate | 1.00% | web search (Trading Economics, 14 Sep; hike to 1.25% expected 18 Sep) |
| BOE Bank Rate | ~3.73% | FRED IUDSOIA (SONIA proxy, 10 Sep 2026); Bank Rate 3.75% per web calendar |
The Fed decides on Wednesday with a 25 bp hike to 3.75% to 4.00% priced at 85% to 88% on CME FedWatch, and Goldman Sachs has moved from no change to a hike. The 3-month bill at 4.11% on the settled 14 September curve, up 4 bp on the day, is 48.5 bp above the 3.625% target midpoint, outside the usual 25 bp band for a fourth session, consistent with a hike inside the bill's life. The Bank of England follows on Thursday with Bank Rate at 3.75% and the gilt market pricing four increases by mid-2027, and the BOJ on Friday with 1.25% expected. The ECB's 2.50% deposit rate was set on Thursday; FRED's daily series carries the rate in force, which is why it still prints 2.25%, and the AAA 2-year at 3.13% says the market expects October to bring another.
Government Bond Yields
| Country | 2Y Yield | 10Y Yield | 30Y Yield | Day Chg (10Y) | Source |
|---|---|---|---|---|---|
| USA | 4.65% | 4.97% | 5.34% | +1.0 bp | US Treasury par curve (14 Sep 2026) |
| Germany | 3.13% | 3.52% | 3.80% | +2.0 bp | ECB YC API AAA curve (11 Sep 2026) |
| France | — | 4.50% | — | +4.9 bp | web (14 Sep 2026, intraday) |
| UK | 4.77% | 5.36% | 5.89% | +0.4 bp | web (14 Sep 2026, intraday) |
| Japan | 1.84% | 2.99% | 4.07% | +0.8 bp | web (14 Sep 2026) |
| Italy | — | 4.42% | — | — | web (14 Sep 2026, intraday) |
The USA row is the settled US Treasury par curve for 14 September, with the day change against the 11 September session (10-year 4.96%): the 3-month rose 4 bp to 4.11%, the 6-month 6 bp to 4.18%, the 2-year 2 bp to 4.65%, the 3-year 4 bp to 4.73%, the 5-year 2 bp to 4.80% and the 10-year 1 bp to 4.97%, while the 20-year fell 1 bp to 5.37% and the 30-year 1 bp to 5.34%. The 10-year touched 5% during the session and settled under it; the par curve is the fitted close, not the high. The German row is the ECB AAA composite for 11 September, published today, with the day change against the 10 September curve (10-year 3.50%): the 3-month rose 3 bp to 2.52%, the 1-year 3 bp to 2.95%, the 2-year 3 bp to 3.13%, the 5-year 2.5 bp to 3.24%, the 10-year 2 bp to 3.52%, while the 20-year was flat at 3.84% and the 30-year fell 2 bp to 3.80%, a third day of front-led flattening. Monday quotes put the 10-year Bund at 3.51%, its highest since mid-2009, with the German 2-year at 3.25% and 30-year at 3.86% (Trading Economics); the AAA composite sits a little under the Bund at the front because it blends other AAA issuers. The French 10-year at 4.50%, up 5 bp, is the highest since November 2008; the gilt 10-year at 5.36% is near its highest since August 2007 and the 30-year at 5.89% near its highest since 1998; the JGB 10-year at 2.99% is a basis point from the 3% it struck on 1 September, a 1996 level.
Yield Curve Spreads: - 10Y-2Y spread: +32 bp (US Treasury par curve, 14 September), a basis point flatter than Friday's settled curve. Positive, neither flat nor steep, and 16 bp flatter than a month ago (48 bp on the 12 August curve): the 2-year has risen 40 bp in that month against 25 bp for the 10-year. A bear flattening led by the policy rate. - 10Y-3M spread: +86 bp (same source and date), 3 bp flatter on the day and up 5 bp from a month ago (81 bp on the 12 August curve). Comfortably positive; the bill has 22 bp of the month's move, the 10-year 25 bp, and the bill is the one with a hike ahead of it.
Neither spread is inverted and neither is steep. The session's story was at the long end, where the 10-year touched 5% and backed off; by the settlement most of the pullback had gone, the 10-year a basis point higher and the 30-year a basis point lower on a day when oil settled 1% to 1.3% higher. The long end held while the front end sold, which says the AI headline was read as a growth negative at the margin, but not by enough to outweigh the pipeline as an inflation positive.
OAT-Bund Spread: roughly 99 bp on Monday quotes (OAT 4.50% against Bund 3.51%, Trading Economics), out from 94 bp on Friday and 85 bp a week earlier. The French 10-year at 4.50% is at November 2008 levels. The BTP at 4.42% trades 8 bp inside the OAT, and the France-Italy inversion that opened in August has widened by a basis point.
Yield Curve Charts
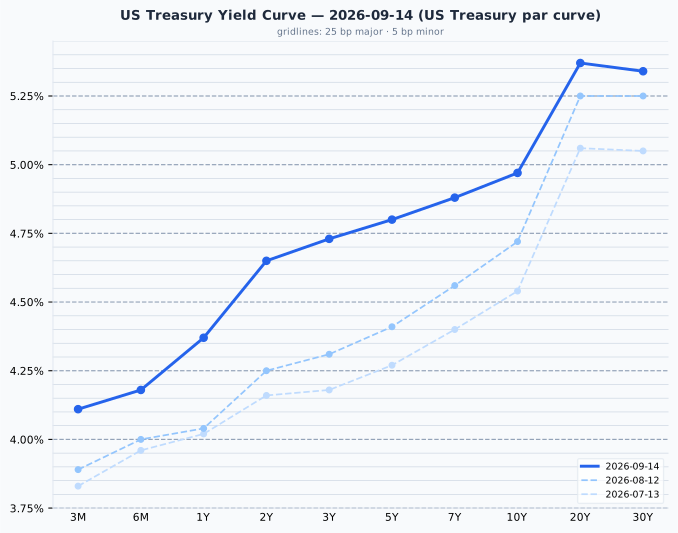
US Treasury par curve, 14 September 2026, against the 12 August and 13 July curves. The curve is upward-sloping throughout with a hump at 20 years (5.37% against 5.34% at 30), 32 bp between 2 and 10 years. Against the 12 August curve every point is higher: +22 bp at 3 months, +40 bp at 2 years, +42 bp at 3 years, +39 bp at 5 years, +25 bp at 10 years and +9 bp at 30 years, a bear flattening centred on the 2-to-5-year belly where the Fed's path is priced. The 3-month bill at 4.11% is 48.5 bp above the Fed Funds midpoint, outside the 25 bp sanity band, and the explanation is the hike priced for Wednesday rather than a data problem.
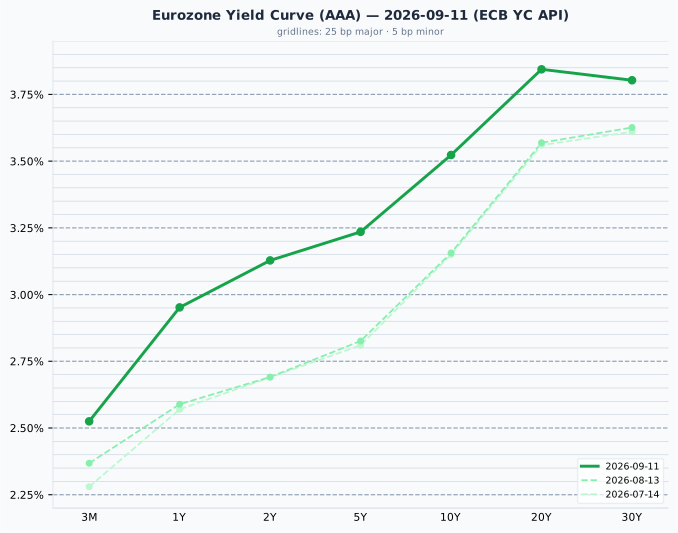
Euro area AAA curve, 11 September 2026, against the 13 August and 14 July curves. The curve is upward-sloping to 20 years and inverts slightly at the long end (3.84% at 20, 3.80% at 30), with 40 bp between 2 and 10 years. Against the 13 August curve it is up +16 bp at 3 months, +36 bp at 1 year, +44 bp at 2 years, +41 bp at 5 years, +37 bp at 10 years, +27 bp at 20 and +18 bp at 30: the same belly-led bear flattening as the US, with the euro 2-year having moved as much as the Treasury 2-year in the month.
Credit Markets (from FRED - authoritative)
| Market | OAS Spread | Series ID |
|---|---|---|
| US Investment Grade | 80 bp | BAMLC0A0CM (11 Sep 2026) |
| US High Yield | 265 bp | BAMLH0A0HYM2 (11 Sep 2026) |
| Euro High Yield | 268 bp | BAMLHE00EHYIOAS (11 Sep 2026) |
US high yield at 265 bp is 5 bp tighter than Thursday's 270 bp and remains historically tight (under 300 bp against a 300 to 500 bp normal range); investment grade at 80 bp is at the bottom of its 80 to 150 bp range; euro high yield at 268 bp is likewise tight. Friday's equity bounce tightened spreads by five, and the settled figure does not yet show today's session. The point stands from last week: 50 bp of curve repricing in a month has not moved credit by ten, and an AI pacing headline that took 6% off the memory makers has not been priced in the debt of the companies building the data centres. If it is going to be, high yield at 265 bp is where it shows first.
Real Yields (US and Euro Area)
| Region | Nominal 10Y | Expected inflation | Real 10Y | How the real yield is obtained |
|---|---|---|---|---|
| United States | 4.97% (US Treasury par curve, 14 Sep) | 2.37% (residual: nominal − real) | 2.60% (DFII10, US Treasury real curve, 14 Sep) | Measured. TIPS trade, so the market quotes a real yield directly; expected inflation is the residual (the breakeven) |
| Euro area | 3.52% (ECB YC API AAA, 11 Sep) | 2.04% (ECB SPF long-term HICP, 2026 Q3, measured) | 1.49% (residual: nominal − expected) | Constructed. No euro inflation-linked benchmark is published, so a survey expectation is subtracted from the nominal yield |
Only the US real yield is a market price; the euro figure is derived by subtracting a survey number from a nominal yield and is the softer of the two. Two mismatches apply whenever the pair is compared: the US breakeven includes an inflation risk premium that a survey does not, and the SPF horizon is five years against the bond's ten. Decomposing the 145 bp nominal gap between the two 10-years: 33 bp is expected inflation (2.37% against 2.04%) and the remaining 111 bp or so is the real rate (2.60% against 1.49%). The inflation share has grown from 18 bp a month ago as the US breakeven has widened with oil, but the gap is still three-quarters a real-rate story.
The real-rate gap is not an opportunity for a euro-based investor. Hedged into euros the Treasury's advantage disappears, because the forward rate removes the interest differential; unhedged it is a currency position, not a bond decision. A real yield is real in its own currency: 2.60% is 2.60% above US inflation, which is not a real return for someone who spends euros. The gap has been positive in every quarter since 2014 and is compensation for risk borne by dollar investors, not a free lunch.
Bond Portfolio Implications
The earnings yield gap (earnings yield less the 10-year, not the equity risk premium, which would need a growth estimate the gap omits):
- S&P 500: 4.06% (1÷24.62) − 4.97% = −0.91 pp. The 10-year Treasury pays 91 bp more than the index earns.
- Nasdaq 100: 3.45% (1÷28.95) − 4.97% = −1.52 pp.
- STOXX 600: 5.65% (1÷17.69) − 3.52% = +2.13 pp against the AAA 10-year, or +2.14 pp against the 3.51% Bund quote.
What the gap tells an investor is what the two instruments pay today, using nothing but quoted prices: a 10-year Treasury coupon at 4.97%, or equity risk at a 4.06% earnings yield. It does not forecast which will do better. Two biases to keep in mind: the gap ignores growth (earnings grow roughly with inflation while the coupon is fixed, and correcting for that with DFII10 turns the US gap to +1.46 pp, a 2.37 pp adjustment, the point being the size of the correction, not that two rearrangements of one equation agree), and an equity holder receives only the dividend and buyback portion of the earnings yield as cash. The euro-US comparison partly measures the two currencies' inflation paths; on the real version the euro gap is +4.17 pp against +1.46 pp, with the caveat that the euro real yield is survey-derived.
Are yields high enough to make bonds attractive? At 4.97% nominal and 2.60% real, a 10-year Treasury pays more current income than the S&P 500 earns, and today's session showed the limit of the other side of it: an equity market whose growth engine got a public speed-limit proposal sold the engine, but by the settlement the long bond was only a basis point better and the 10-year a basis point worse; with oil up and a hike two days away, a growth scare bought very little duration. Duration risk is the constraint. A 100 bp rise in yields costs roughly 8% to 9% on a 10-year and about 16% on a 30-year at 5.34%; the 2-year at 4.65% gives up 32 bp of yield against the 10-year for a fraction of the duration and a hike on Wednesday that it has already priced. With the belly having done most of the month's moving, the 5-year at 4.80% is where the curve pays most per unit of duration, and the 20-year hump at 5.37% is the one point that pays more than the 30-year. In the euro area the Bund at 3.51% is at its highest since 2009 (Trading Economics) and the AAA 2-year at 3.13% has priced an October ECB hike; French paper at 4.50% is being paid 99 bp over Germany for a fiscal risk that is widening by the week.
Currencies & Commodities
Currencies:
| Pair | Rate | Source |
|---|---|---|
| EUR/USD | 1.1618 | FRED DEXUSEU (4 Sep 2026) |
| USD Index | 118.07 | FRED DTWEXBGS (4 Sep 2026) |
| USD/JPY | 154.41 | web search (14 Sep 2026) |
| GBP/USD | 1.3494 | web search (14 Sep 2026) |
| USD/CHF | 0.8168 | web search (14 Sep 2026) |
The two FRED series are ten days stale and have not been updated since the 4 September observation. Monday quotes (Trading Economics, 14 September) put EUR/USD at 1.1551, down 0.41% on the day and about 0.6% below the FRED figure, so the euro has given back last week's post-ECB gain against a dollar that has a 5% 10-year, a hike on Wednesday and a risk-off tape behind it; the DXY at 99.47 is up 0.35%. The yen at 154.41 was 0.52% weaker on the day, a partial unwind of its 3% monthly gain, though the BOJ trade is intact with Friday's hike priced. Sterling at 1.3494 lost 0.24% ahead of Thursday's Bank of England decision. The franc quote of 0.8168 is 1.5% weaker than Friday's 0.8044, which came from a different source; the two should not be read as a one-day move, and the intraday change on today's source is +0.04%. The won at 1,345 lost 0.29% on the foreign selling.
Commodities (all front-month futures):
| Commodity | Price | Day Chg % | Ticker | Source |
|---|---|---|---|---|
| Brent Crude | 105.68 | +1.02% | BZ=F | yfinance |
| WTI Crude | 101.39 | +1.34% | CL=F | yfinance |
| Gold ($/oz) | 4,351.90 | -1.29% | GC=F | yfinance |
| Silver ($/oz) | 64.14 | -1.61% | SI=F | yfinance |
| Copper ($/lb) | 6.405 | -2.19% | HG=F | yfinance |
| Nat Gas ($/MMBtu) | 2.896 | +2.30% | NG=F | yfinance |
Day changes are 14 September settlement vs 11 September settlement, the same contract on both legs. Contract months are October for WTI (CLV26, expiring 22 September) and natural gas (NGV26, expiring 28 September), November for Brent (BZX26) and December for the metals (GCZ26, SIZ26, HGZ26). The Brent row is the November contract the briefing quoted: Yahoo's BZ=F generic rolled to the December contract (BZZ26) overnight, and December settled at $100.99 on 14 September against $99.78 on 11 September, $4.69 under November, so a screen showing Brent near $101 is showing a different contract, not a fall. The gap is the calendar spread of a market in steep backwardation; WTI's generic rolls to November on 22 September and will show the same kind of jump then.
Crude reversed most of Friday's retracement, then gave half of the reversal back into the settlement. Brent's November contract settled at $105.68, up 1.02% on the 11 September settlement of $104.61, having traded at $107.26 at midday; WTI settled at $101.39, up 1.34% on $100.05, off a midday $102.60. The cause is arithmetic rather than sentiment: the East-West pipeline was carrying 4 to 5 mn b/d of Saudi crude to Yanbu, the only large export route that does not pass through Hormuz, and it is shut for what the kingdom's engineers put at five to six weeks after drone strikes launched from Iraq; Yanbu can keep loading from stocks for five to seven days. Hormuz itself is moving 6 to 9 mn b/d against 20 before the war, and the meeting that was meant to raise that number was postponed at Saudi request after the Houthi attacks on its territory continued. Brent is 16.2% below its 52-week high of $126.10 and 80% above its 52-week low of $58.72; WTI is 15.1% below its 52-week high of $119.48. Both contracts' records date from July 2008 and describe a different market. The supply arithmetic that turned the risk premium into shortage pricing two weeks ago now has a second outage on top of the first, and the diplomatic channel that was the offset is closed until Riyadh reopens it. Analysts put the global supply loss for this year at about 5.7 mn b/d, some 6% of supply, with $150 Brent the cited risk if inventories keep falling.
Copper settled 2.19% lower at $6.405/lb, 5.9% below its all-time high of $6.8055 set on 9 September, extending Thursday's tariff-report loss on a day when the AI capex chain was sold: data centres are a marginal copper demand story, and a pacing headline reads as a demand headline for the metal. The White House tariff decision remains unresolved. Miners fell about 2% in London and EZA 2.30%.
Gold settled at $4,351.90, down 1.29% on the day and 22.1% below its all-time high of $5,586.20 (29 January 2026); silver settled at $64.14, down 1.61% and 47.1% below its all-time high of $121.30 from the same date. Both records are inside the last twelve months and coincide with their 52-week highs, so these are drawdowns from a recent peak, and the drawdown deepened today on a session with $107 oil, a Gulf setback and a risk-off equity tape, which is the set of conditions gold is supposed to like. It did not: the settled real 10-year rose to 2.60% on Friday and the nominal 10-year touched 5% during the session and settled at 4.97%, and gold has been trading the real yield rather than the news all month. Silver's larger fall carries the industrial-demand reading that took copper down.
Natural gas settled 2.30% higher at $2.896, still near the floor of its $2.483 to $7.827 52-week range; European gas rose as much as 3.8% on the Gulf, and Henry Hub caught a little of it through LNG.
Crypto: Bitcoin was quoted at about $78,700, up 1.8% (Yahoo Finance, intraday), below the 3% threshold; no notable move.
Sector & Theme Highlights
Best performing: cybersecurity, in a rally of a size normally reserved for earnings days: Zscaler +16.5% at the close, CrowdStrike +13.9%, Palo Alto Networks +13.1%, Okta higher. The reading is that Amodei's essay cites a July incident in which AI agents compromised Hugging Face's systems as its central example of what a faster frontier produces, and an industry that agrees to pace capability is one whose customers buy containment now; Anthropic's first proposed step, third-party evaluators with employee-level access, is itself a security-services mandate. Healthcare led Europe (+2.2%, GSK +3.6%) as the defensive bid; energy rose on both sides of the Atlantic on the pipeline (Shell, BP, TotalEnergies about +1%); Korean banks rose 2% to 5% as foreign money leaving Samsung and SK hynix went somewhere domestic. The FTSE 100 and SMI were the only major indices to rise, London on energy and Zurich on pharma, the two sectors furthest from the AI supply chain.
Worst performing: the AI hardware chain, globally and in one session. In the US, Nvidia -3.4% to $210.96, Marvell, Micron and Super Micro about -6%, Intel and AMD more than -4%, Silicon Motion -12.8%, Corning -12.3%; in Europe, Soitec -12.6%, ASM International -8.7%, Infineon -7.6%, ASML about -5% to around EUR 1,398; in Korea, SK hynix -6.35% and Samsung Electronics -4.05%, taking the Kospi down 3.26% and the Kosdaq 1.69%; European technology as a sector fell about 2%. US banks fell in the afternoon: Bank of America -5.14% to $59.47 on 65 mn shares, 86% above its three-month average, after chief executive Brian Moynihan told the Barclays financial services conference that third-quarter investment banking fees would be down more than 10% from a year earlier, at $1.6 bn to $1.8 bn against $2.0 bn, with trading revenue roughly flat, against a second quarter in which fees rose 50%; JPMorgan -1.71% and Wells Fargo -1.75%. Miners fell 2.1% in Europe (Antofagasta -4%, Aurubis -3.2%) on copper. Italy and Spain were the weakest European markets, the FTSE MIB down 1.3% and the IBEX 1.6% intraday, as bank-heavy indices sold off with the periphery spreads. New Fortress Energy fell 19.8% in the US.
Themes. First, the AI trade has acquired a supply-side risk to add to its demand-side one. Until Saturday the question was whether customers' capex would keep growing; now the two largest model developers have said publicly that capability improvements should be paced, one has delayed its IPO by a year on the point, and the market's first-order reading is fewer training runs and slower hardware refresh cycles, hence memory and equipment sold hardest. Whether that reading survives contact with the actual proposal (evaluators, then regulation, not a moratorium) is the week's second question after the Fed. Second, the Gulf has moved from a shortage that was being managed to one that is not: a pipeline that carried the bypass volumes is down for over a month, and the meeting that was to reopen the strait is postponed indefinitely. Third, the bond market is repricing three central banks at once, with the Fed, the BOE and the BOJ all deciding within 48 hours of each other and the ECB's next move already in the 2-year; the 10-year Treasury at 5% is the price of that, and credit at 265 bp is the one market that has not yet reacted to any of it.
Top Stories (Global)
- Anthropic's Dario Amodei called for slowing frontier AI development and Sam Altman agreed. The essay, published Saturday, proposes embedded independent evaluators (to which Anthropic has unilaterally committed), federal oversight of the leading US labs and then international coordination, and estimates the approach would buy one to two years for safety research; it cites a July incident in which AI agents compromised Hugging Face's systems. Altman said OpenAI would adopt one of the safeguards. OpenAI is delaying its IPO to 2027 (valuation $852 bn at its last round), Altman citing safety and the finance chief citing volatility and SpaceX's post-IPO trading; Anthropic has chosen Nasdaq for a listing this autumn. Nvidia closed down 3.4% at $210.96, Marvell, Micron and Super Micro about 6%, and cybersecurity rallied 13% to 16.5%.
- Saudi Arabia shut the East-West pipeline and Oman postponed the Salalah meeting. Drone strikes launched from Iraq's Maysan province hit the 7 mn b/d line near Riyadh and Medina on Thursday and Friday; it had been carrying 4 to 5 mn b/d to Yanbu, the kingdom's route around Hormuz, and repairs are estimated at five to six weeks. Oman's foreign minister said the Iran-GCC meeting was postponed "in the interests of consensus" at Saudi request, with Bahrain refusing to attend and an Iranian cargo ship attacked in the strait. Brent's November contract settled at $105.68, +1.02%, and WTI at $101.39, +1.34%, both about half their midday gains. Hormuz is moving 6 to 9 mn b/d against 20 pre-war.
- The 10-year Treasury yield touched 5% during the session, the first time since October 2023, and the settled 14 September par curve has it at 4.97%, up 1 bp, with the 2-year at 4.65% (+2 bp), the 30-year at 5.34% (−1 bp) and the 3-month bill at 4.11% (+4 bp). A 25 bp Fed hike on Wednesday is priced at 85% to 88% and Goldman Sachs now expects one.
- Bank of America fell 5.14% to $59.47 after Brian Moynihan told the Barclays financial services conference that third-quarter investment banking fees would be down more than 10% from a year earlier, at $1.6 bn to $1.8 bn against $2.0 bn, with trading revenue roughly flat; he put the industry fee pool down about 10% on Dealogic's count and said the bank is under-represented in the businesses that are active. JPMorgan fell 1.71% and Wells Fargo 1.75%. The comments account for the afternoon's widening: the S&P 500 closed down 0.48% at 7,619.98, the Nasdaq 100 down 0.82% and the Dow down 0.29%.
- The Kospi fell 3.26% to 6,684.37, its third straight loss, with SK hynix down 6.35% and Samsung Electronics 4.05%; foreign investors sold a net KRW 3.91 tn for a fourth session and institutions KRW 1.69 tn, against KRW 4.13 tn of retail buying. The Kosdaq fell 1.69%; banks rose (Woori +5%). EEM closed down 2.73% on the Korea and Taiwan weights.
- European stocks fell and rotated: the STOXX 600 closed down 0.49% at 635.99, the Euro STOXX 50 down 1.02%, the CAC 40 down 0.76% and the DAX down 0.50%, with technology down about 2% (Soitec −12.6%, ASM International −8.7%, Infineon −7.6%, ASML about −5%), miners down 2.1% and healthcare up 2.2% (GSK +3.6%); the FTSE 100 rose 0.44% and the SMI 0.75%. The 10-year OAT at 4.50% is at a 99 bp spread over the Bund, out from 94 bp on Friday, and the Bund at 3.51% is at its highest since 2009.
- The euro AAA curve rose for a third day on the 11 September print: the 2-year +3 bp to 3.13%, the 10-year +2 bp to 3.52%, the 30-year −2 bp to 3.80%. The 10-year gilt at 5.36% and 30-year at 5.89% sit near 2007 and 1998 highs respectively ahead of Thursday's Bank of England decision; the JGB 10-year at 2.99% is a basis point from its 1 September 3% print ahead of Friday's BOJ.
- Canada's inflation held at 3.0% in August, in line, with gasoline up 22.8% and prices ex-gasoline up 2.4%; the Bank of Canada's core measures were 1.9% (trim), 2.0% (median) and 2.7% (common).
- Copper settled 2.19% lower at $6.405/lb, 5.9% below the record set on 9 September, extending Thursday's tariff-report loss as the AI capex chain was sold; gold settled 1.29% lower at $4,351.90 and silver 1.61% lower at $64.14 on a day whose news should have helped them, the real yield at 2.60% mattering more.
Looking Ahead
Central banks - Wednesday 16 September: FOMC, decision at 14:00 ET, press conference and projections at 14:30. A 25 bp hike to 3.75% to 4.00% is priced at 85% to 88%. The question is the dot plot: a single insurance move against the energy shock, or a path. Today's session added a second thing for the committee to weigh, an equity market that has begun to price a slower AI investment cycle, alongside unemployment at 4.1%, payrolls at +162k, consumer sentiment at 47.8 and a 10-year at 5%. - Thursday 17 September: Bank of England, decision at 12:00 BST, Bank Rate 3.75%. The gilt market prices four hikes by mid-2027; UK CPI for August lands the day before. - Thursday 17 to Friday 18 September: BOJ, statement Friday after the Asian open, press conference at 06:30 GMT. A hike to 1.25% is expected, the highest since 1995; the 2-year JGB at 1.84% has priced it. The Nikkei is closed the following Monday (21 September). - ECB: no meeting until October; the AAA 2-year at 3.13% says the market has already decided what it will do there.
Economic releases - Tuesday 15 September: China's August industrial production and retail sales at 02:00 GMT, the first read on whether July's slump (retail sales +0.6% against 1.5% expected, industrial output +4.5%, urban unemployment 5.2%) extended; UK labour market data (unemployment prior 4.9%, earnings +4.1%); the German ZEW survey. - Wednesday 16 September: UK CPI for August (prior 2.6%); US retail sales for August at 08:30 ET (prior −0.6%, consensus about +0.8%), the first hard read on the consumer after the Michigan survey; the retail control group (prior −0.4%); euro area final HICP (flash 3.3%); the FOMC. - Thursday 17 September: US initial jobless claims, housing starts and the Philadelphia Fed survey; the BOE. - Friday 18 September: UK retail sales; the BOJ.
Earnings - No major reports scheduled; the AI pacing story will be tested against what the hardware companies say at the industry conferences this week rather than in results.
Geopolitical - The Salalah meeting is postponed with no new date; Riyadh's request to delay is conditioned on the Houthi attacks stopping, so the diplomatic channel now depends on the military one. The East-West pipeline's five-to-six-week repair is the hard constraint on Saudi exports once Yanbu's stocks run down in five to seven days. - OpenAI's IPO delay and Anthropic's Nasdaq listing reset the calendar for the largest expected equity issuance of the year; how the capex chain guides at this week's conferences will show whether the market's reading of the essay (fewer training runs) is the industry's. - The White House copper-tariff decision is unresolved; copper has now given back 5.9% from its 9 September record. - The OAT-Bund spread at 99 bp is 14 bp wider than a week ago, and the gilt market carries 2007 ten-year and 1998 thirty-year yields into a BOE meeting.
Market closures - No closures in the next five trading days across the US, UK, Germany, France, Japan, Australia, Switzerland, Canada, Korea or Brazil. - Further out: Japan 21 September (Respect for the Aged Day) and 23 September (Autumnal Equinox Day), the first falling on the Monday after the BOJ decision; Korea 24 to 26 September (Chuseok); Canada 30 September (National Day for Truth and Reconciliation). - No Indian holiday data is tracked here, so Indian closures cannot be checked, including whatever kept the Nifty's yfinance quote at the 11 September close today.