2026 08 05
Global Financial Briefing — Wednesday, 5 August 2026
Americas index levels, commodities and day changes reflect the 5 August closing print. Fixed income, FX and macro figures are dated inline.
Market Overview
The risk-on impulse that produced record US closes on Tuesday rolled around the globe overnight and landed hardest in Asia. Japan's Nikkei 225 jumped 3.66% to 66,300.44 and Korea's Kospi rose 3.76% to 6,598.26, both driven by semiconductor and AI-adjacent names — SoftBank (+13.2%), Yamaha Motor (+19.4%) and Mitsui Kinzoku (+10.9%) led Tokyo, while SK Hynix and Kioxia powered Seoul. These were the largest single-day moves in either market in some time, and they came off depressed bases: despite today's surge, the Nikkei remains 9.0% below its all-time high and the Kospi a striking 29.7% below its own, with the Kospi still trading well beneath its 50-day moving average (6,598 vs 7,734). Today's rally is a rebound within a drawdown, not a breakout.
The dominant cross-asset driver remains the reported imminent interim US–Iran agreement to reopen the Strait of Hormuz. Crude's decline, however, largely faded into the settlement: WTI ended −0.73% at $75.22 and Brent actually closed higher, +0.11% at $79.45, snapping its two-day slide. The energy complex found a floor once the Hormuz headline was fully priced, which tempers — without overturning — the disinflationary impulse that had been pulling inflation expectations and long yields lower. Counterintuitively for what began as a risk-on tape, precious metals surged for a second day and held those gains into the close: gold +3.67% to $4,305.20/oz and silver +3.39% to $62.288/oz, a move better explained by falling real yields and dollar softness than by any flight to safety. Copper settled at record levels at $6.7275/lb — the cleanest growth-positive signal in the commodity complex.
Developed-market equity leadership rotated in a way worth noting, and the rotation widened through the US afternoon. The Dow closed up 0.49% at a record 54,349.12 while the Nasdaq 100 fell 0.83% — its first decline in five sessions, with SpaceX and AMD weighing after their results — and the S&P 500 slipped 0.17%, giving up a small intraday gain. That is a sharp rotation out of megacap tech and into cyclicals and value, and it left the broad index lower on a day the blue-chip index set a record. Europe closed mixed and essentially flat at record levels: the CAC 40 finished at 8,669.30, within a rounding error of its all-time high, and the STOXX 600 within 0.1% of its own, but the DAX (−0.29%) and STOXX 50 (−0.15%) gave back ground. Underneath, the valuation picture in the US is the standing concern: the S&P 500's trailing P/E of 27.7x is 63% above its long-run average, and the equity risk premium against the 10-year Treasury is −1.10% — Treasuries out-yield S&P 500 earnings, and by a widening margin as long yields have pushed higher. Europe, Japan and EM all still carry positive, meaningful equity risk premia.
Global Indices Snapshot
Americas
Americas data reflects the 5 Aug close.
| Index | Level | Day Chg | Day Chg % | Source |
|---|---|---|---|---|
| S&P 500 | 7,723.55 | −12.97 | −0.17% | yfinance ^GSPC |
| Nasdaq 100 | 29,487.79 | −245.37 | −0.83% | yfinance ^NDX |
| Dow Jones | 54,349.12 | +263.24 | +0.49% | yfinance ^DJI |
| Brazil IBOV | 177,726.17 | −168.80 | −0.09% | yfinance ^BVSP |
Cross-check: FRED series SP500 reports the 5 Aug S&P 500 close at 7,723.55, matching the yfinance ^GSPC close exactly.
The last two hours of the session took the tape lower across the board. The Dow held on to close at 54,349.12, up 0.49% and above its previous all-time high of 54,272.60 — a record close, though a materially smaller gain than the 0.89% it showed mid-afternoon. The S&P 500 reversed outright: up 0.03% intraday, it closed down 0.17% at 7,723.55, leaving it 0.45% below its 7,758.21 all-time high. The Nasdaq 100's decline more than doubled into the close, ending 0.83% lower at 29,487.79 and 4.1% below its 30,762.20 peak — the day's rotation away from megacap tech accelerated into the close. Brazil's Ibovespa also gave up its gain, closing 0.09% lower and 10.9% below its 199,355 all-time high.
Europe
European data reflects today's close (5 Aug).
| Index | Level | Day Chg | Day Chg % | Source |
|---|---|---|---|---|
| Euro STOXX 600 | 657.14 | +0.28 | +0.04% | yfinance ^STOXX |
| Euro STOXX 50 | 6,476.98 | −9.72 | −0.15% | yfinance ^STOXX50E |
| CAC 40 | 8,669.30 | +2.67 | +0.03% | yfinance ^FCHI |
| DAX | 26,126.30 | −76.05 | −0.29% | yfinance ^GDAXI |
| FTSE 100 | 10,888.30 | +8.92 | +0.08% | yfinance ^FTSE |
| SMI (Swiss) | 14,551.56 | +88.33 | +0.61% | yfinance ^SSMI |
Europe consolidated at record levels rather than extending. The CAC 40 closed at 8,669.30 against an all-time high of 8,669.69 — effectively at its record to the decimal — and the STOXX 600 finished 0.1% below its own 657.91 peak. The STOXX 50 (0.2% below) and DAX (0.5% below) both eased back from Tuesday's records, with the DAX the day's weakest major European index. The SMI was the standout, up 0.61%, though it remains 0.7% off its 14,656.05 high. The FTSE 100, up marginally, is 0.9% below its 10,989.50 record. Every major European index is trading above both its 50-day and 200-day moving averages.
Asia-Pacific
Asia-Pacific data reflects today's close (5 Aug) in each local timezone.
| Index | Level | Day Chg | Day Chg % | Source |
|---|---|---|---|---|
| Nikkei 225 | 66,300.44 | +2,342.91 | +3.66% | yfinance ^N225 |
| Hang Seng | 25,915.82 | +62.90 | +0.24% | yfinance ^HSI |
| Shanghai Comp | 3,878.43 | +56.15 | +1.47% | yfinance 000001.SS |
| ASX 200 | 9,227.80 | +82.00 | +0.90% | yfinance ^AXJO |
| Kospi (Korea) | 6,598.26 | +239.31 | +3.76% | yfinance ^KS11 |
Japan and Korea dominated, but the context matters: the Nikkei's 3.66% surge still leaves it 9.0% below its 72,831.73 all-time high and below its own 50-day moving average of 67,130.89 — a strong day inside a correction, not a resumption of trend. The Kospi's 3.76% gain leaves it 29.7% below its 9,385.59 record and far under its 50-day average of 7,734.30, a deep drawdown that today barely dented. Australia's ASX 200 at 9,227.80 is 0.27% above its prior 9,202.90 all-time high — a fresh record, and the only Asia-Pacific index at one. The Shanghai Composite gained 1.47% but sits 36.7% below its 6,124.04 peak and below both moving averages; the Hang Seng was near-flat and remains 22.6% below its own record.
Note: yfinance reports a 52-week low of 0.00 for ^KS11 — a data error (no index trades at zero) — so the Kospi 52-week range is omitted from this briefing. Its 52-week high of 9,385.59 is used above.
Emerging Markets
All rows reflect the 5 Aug close: EEM and EZA at the NYSE close, ^NSEI at the Indian close.
| Index | Level | Day Chg % | Source |
|---|---|---|---|
| MSCI EM (EEM) | $65.72 | −0.42% | yfinance EEM |
| India Nifty 50 | 24,624.65 | +0.04% | yfinance ^NSEI |
| South Africa | $66.85 | +1.35% | yfinance EZA |
Emerging markets did not participate in the Asian equity surge in dollar terms — EEM closed down 0.42%, twice its mid-afternoon decline, and sits 8.2% below its $71.57 high and 1.2% under its 50-day average, reflecting EM's heavy China weighting rather than its Korean one. India's Nifty 50 was flat and remains 6.6% below its record and, notably, below its 200-day moving average (24,625 vs 24,776) — one of the weaker large-market charts globally. South Africa's EZA closed up 1.35%, helped by the precious-metals rally, but is still 18.2% below its $81.76 high.
Index Valuations & Investment Risk
Valuation Table
| Index | Trailing P/E (live) | Hist avg trailing P/E (†) | Premium to hist avg |
|---|---|---|---|
| S&P 500 | 27.75x | ~16-18x | +63.2% |
| Nasdaq 100 | 31.97x | ~25-30x | +16.2% |
| Euro STOXX 600 | 19.01x | ~15-17x | +18.8% |
| CAC 40 | 18.23x | ~14-16x | +21.6% |
| DAX | 19.10x | ~15-17x | +19.4% |
| FTSE 100 | 18.19x | ~13-15x | +29.9% |
| Nikkei 225 | 21.50x | ~20-22x | +2.4% |
| MSCI EM | 16.97x | ~13-15x | +21.2% |
(†) Hist avg trailing P/E: static long-run reference constants, not live data.
Trailing P/E (live): yfinance trailingPE on ETF proxies — SPY, QQQ, EXSA.DE, CAC.PA, EXS1.DE, ISF.L, 1321.T, EEM. Premium computed against the midpoint of each historical range. Bold = more than 20% above historical average.
The striking feature is that no major market is cheap against its own history. The S&P 500's 63% premium is in a category of its own, but the FTSE 100 (+29.9%), CAC 40 (+21.6%) and MSCI EM (+21.2%) have all crossed the 20% "elevated" threshold, and even the Nasdaq 100's premium is modest only because its historical benchmark is already high. The Nikkei is the sole index trading essentially in line with its long-run average — a direct consequence of the 9% drawdown that today's rally only partially reversed.
Investment Risk Assessment for ETF Investors
United States (S&P 500 / Nasdaq ETFs) The S&P 500 trades at 27.75x trailing earnings, an earnings yield of 3.60% (1÷27.75). Against the 10-year Treasury at 4.70% (FRED DGS10, 2026-08-03), the equity risk premium is −1.10%. For the Nasdaq 100 it is worse: a 3.13% earnings yield against the same 4.70% gives −1.57%. A negative ERP means a risk-free Treasury pays more than the earnings the index generates — historically an uncommon configuration and a poor starting point for forward equity returns. It has also deteriorated: the 10-year at 4.70% is 22 bps higher than a month ago (4.48% on 2026-07-06) and 23 bps above two months ago, so the discount rate is rising while multiples have not compressed. The 10-year TIPS real yield at 2.43% (FRED DFII10, 2026-08-03) is genuinely restrictive by post-2008 standards and argues against further multiple expansion. On the close the S&P 500 sits 3.3% above its 50-day and 9.9% above its 200-day moving average — extended against the longer trend in particular. Concentration risk remains the structural issue: the day's rotation, with the Dow closing up 0.49% at a record while the Nasdaq 100 fell 0.83% and the S&P 500 itself finished lower, is a reminder of how much index performance depends on a handful of AI-levered names. The Nasdaq 100 closed only 0.37% above its own 50-day moving average, having spent the session giving back the cushion that four hyperscaler-led sessions had built.
Europe (STOXX 600 / CAC 40 / DAX ETFs) Europe is expensive against its own history but decisively cheaper than the US. The STOXX 600's 19.01x gives a 5.26% earnings yield; against the ECB AAA euro-area 10-year at 3.15% (ECB YC API, 2026-08-04) the euro ERP is +2.11% — a positive and meaningful cushion the US simply does not have. The DAX is comparable at +2.09%. The CAC 40, benchmarked against the French OAT 10-year at 3.90% rather than the AAA curve, gives a thinner +1.58%, which is the market's way of pricing French fiscal risk into the domestic equity story. The US trades at a 46% trailing-P/E premium to the STOXX 600 (27.75x vs 19.01x), historically wide. For a euro-based investor the relative case for European equity exposure is the strongest it has looked in this cycle — with the caveats that every major European index is at or within 1% of a record high, and that the OAT-Bund spread (roughly 75 bps, derived below) remains the key French risk indicator to watch.
United Kingdom (FTSE 100 ETFs) The FTSE's 18.19x trailing P/E is 29.9% above its long-run average — the second-largest premium in the table — and it is measured against the highest developed-market long yield here. A 5.50% earnings yield against the UK 10-year gilt at 4.99% leaves an ERP of just +0.51%, below the 1% warning threshold. The FTSE's traditional role as the cheap developed market no longer holds on these numbers.
Japan (Nikkei / TOPIX ETFs) Japan is the one market where valuation and price action point the same way. At 21.50x the Nikkei is only 2.4% above its historical average, and against the 10-year JGB at 2.85% the ERP is +1.80% — positive and respectable. But the risks are concentrated in policy and currency. The BOJ held at 1.00% on 31 July in an 8-1 vote, with board member Takata dissenting for 1.25%, and has said core inflation should run clearly above 2% from the second half of FY2026 — a further hike is live. USD/JPY at 157.74 is weak enough that unhedged foreign investors have been earning equity returns and giving them back in currency; a hawkish BOJ surprise would reverse that, helping hedged and unhedged investors in opposite directions. Today's 3.66% surge was led by high-beta names off a low base rather than by any change in fundamentals.
Emerging Markets (MSCI EM ETFs) MSCI EM at 16.97x is 21.2% above its own historical average, so the familiar "EM trades at a deep discount to developed markets" framing is only half true today — EM is cheaper than the US in absolute terms (16.97x vs 27.75x) but expensive against its own record. Its 5.89% earnings yield is the highest in the table. The China weighting is the dominant risk and the dominant explanation for today's divergence: the Shanghai Composite is 36.7% below its all-time high and the Hang Seng 22.6% below, so the Japanese and Korean strength that drove the Asian tape simply does not flow through to EEM in proportion.
Overall Risk Score (qualitative, not financial advice): - United States — high valuation risk / low margin of safety. Negative ERP, 63% P/E premium, restrictive real yields, indices extended above moving averages. - United Kingdom — high valuation risk. 30% P/E premium with an ERP of just 0.51%. - Europe ex-UK — moderate. Expensive against history, but a positive 2%+ ERP and a wide discount to the US; record index levels are the near-term caution. - Emerging Markets — moderate. Highest earnings yield, but a 21% premium to its own history and heavy China exposure. - Japan — moderate, with the most attractive relative valuation of the group: near historical-average multiples, a positive ERP, and a 9% drawdown providing entry-level support — offset by real BOJ policy and yen risk.
Disclaimer: This is financial information, not personalised investment advice. Past valuations do not guarantee future returns. Consult a financial advisor before investing.
US Economic Indicators (FRED - authoritative)
| Indicator | Current | Reference Date | FRED Series |
|---|---|---|---|
| CPI YoY % | 3.46% | 2026-06 (June) | CPIAUCSL |
| Core CPI YoY % | 2.57% | 2026-06 (June) | CPILFESL |
| Unemployment Rate | 4.2% | 2026-06 (June) | UNRATE |
| Nonfarm Payrolls | +57k m/m (158,984k total) | 2026-06 (June) | PAYEMS |
| 10Y TIPS Real Yield | 2.43% | 2026-08-03 | DFII10 |
FRED macro data is monthly and lags 4-6 weeks; June remains the most recently published month for CPI, unemployment and payrolls. Headline CPI at 3.46% YoY is running well above the Fed's 2% target and materially hotter than core at 2.57%, a gap that oil's recent decline should help close in coming prints. Payroll growth of +57k per month is soft but not recessionary against a 4.2% unemployment rate. The combination — sticky headline inflation, cooling but positive job growth — is consistent with the Fed Funds range holding at 3.50-3.75% and explains why market commentary this week has framed the Hormuz de-escalation as reducing the odds of further tightening rather than accelerating cuts. The 10-year TIPS real yield at 2.43% has fallen 4 bps from 2.47% at the end of July, which is part of why gold has rallied so hard over the last two sessions.
Other economic releases on 5 August: the US ISM Services PMI for July printed at 54.1, just below the 54.5 consensus but up 0.1 point from June's 54.0 and a 25th consecutive month of expansion. The composition was less comfortable than the headline: Business Activity 59.1 and New Orders 57.2 were strong, but the Employment index fell to 47.4, back into contraction and now below 50 in 12 of the last 18 months, while the Prices index pushed back above 70 for the fourth time in five months — its 12-month average is the highest since April 2023. The ADP employment change for July came in at +44k, well short of the +68k consensus cited above. Together they sharpen the picture in the paragraph above rather than change it: a services sector still expanding on output but no longer adding workers, with input prices re-accelerating — the stagflationary corner of the data, and an awkward one for a Fed holding at 3.50-3.75%. The final Eurozone HCOB Services PMI for July was expected at 51.6; the confirmed final reading was not retrieved — (not retrieved). For context from recent releases: Eurozone Q2 2026 GDP grew 0.4% QoQ, and July Eurozone headline HICP edged up to 2.9% YoY with core also accelerating — an uncomfortable combination for an ECB already holding its deposit rate at 2.25%.
Fixed Income & Bond Analysis
Policy Rates
| Central Bank | Rate | Source |
|---|---|---|
| Fed Funds (upper) | 3.75% | FRED DFEDTARU (2026-08-05) |
| Fed Funds (lower) | 3.50% | FRED DFEDTARL (2026-08-05) |
| Effective FFR | 3.63% | FRED DFF (2026-08-03) |
| ECB Deposit Rate | 2.25% | FRED ECBDFR (2026-08-05) |
| BOJ Policy Rate | 1.00% | web search (held 31 Jul 2026, 8-1 vote) |
| BOE Bank Rate | ~3.73% (SONIA/FRED) | FRED IUDSOIA (2026-08-03) |
The BOJ's 1.00% is its highest since 1995, reached via a hike from 0.75% on 16 June. The 8-1 vote on 31 July, with Takata pushing for 1.25%, plus the BOJ's guidance that core inflation will run clearly above 2% from H2 FY2026, keeps another hike firmly on the table.
Government Bond Yields
| Country | 2Y Yield | 10Y Yield | 30Y Yield | Source |
|---|---|---|---|---|
| USA | 4.25% | 4.70% | 5.23% | FRED (2026-08-03) |
| Euro AAA | 2.66% | 3.15% | 3.59% | ECB YC API (2026-08-04) |
| France | (not retrieved) | 3.90% | (not retrieved) | web (2026-08-05) |
| UK | (not retrieved) | 4.99% | (not retrieved) | web (2026-08-04) |
| Japan | (not retrieved) | 2.85% | (not retrieved) | web (2026-08-04) |
| Italy | (not retrieved) | 3.96% | (not retrieved) | web (2026-08-03) |
The "Euro AAA" row is the ECB's AAA-rated euro area government bond curve, which tracks German Bunds closely and is used here in place of a separate Bund series. UK 2-year and 30-year gilt yields, and the 2Y/30Y points for France, Japan and Italy, could not be retrieved from web search and are marked accordingly rather than estimated.
Yield Curve Spreads (FRED pre-computed): - 10Y-2Y spread: +43 bps (FRED T10Y2Y, 2026-08-04) — positively sloped, but modestly so. This is not a steep curve (historically >75 bps) and it is well clear of inversion. It has been steepening: the 10Y is up 22 bps over the past month while the 2Y is up only 8 bps, a bear steepening driven by the long end. - 10Y-3M spread: +74 bps (FRED T10Y3M, 2026-08-04) — comfortably positive, giving no recession signal. The 3M-anchored spread being wider than the 2Y-anchored one is normal in a curve that is repricing term premium rather than policy.
Both spreads point the same way: the market is not pricing a near-term recession, and it is not pricing imminent Fed easing either. What it is pricing is term premium. The 3-month bill at 3.91% sits about 28 bps above the Fed Funds target midpoint of 3.625%, a modest but real premium consistent with a market that assigns some probability to tightening rather than cutting at the front end.
OAT-Bund Spread: approximately 75 bps, derived as the French 10Y OAT at 3.90% (2026-08-05) less the ECB AAA 10-year at 3.15% (2026-08-04). This is a derived figure across two dates using the AAA curve as a Bund proxy, not a directly quoted spread — treat it as indicative. It is wide enough to keep French fiscal risk a live theme, and it is the reason the CAC 40's equity risk premium (+1.58%) is meaningfully thinner than the DAX's (+2.09%) despite similar multiples. Italy's 10-year BTP at 3.96% (2026-08-03) sits just 6 bps above the French OAT — the France-Italy spread has effectively closed, a notable convergence given the two countries' historical ordering.
Yield Curve Charts
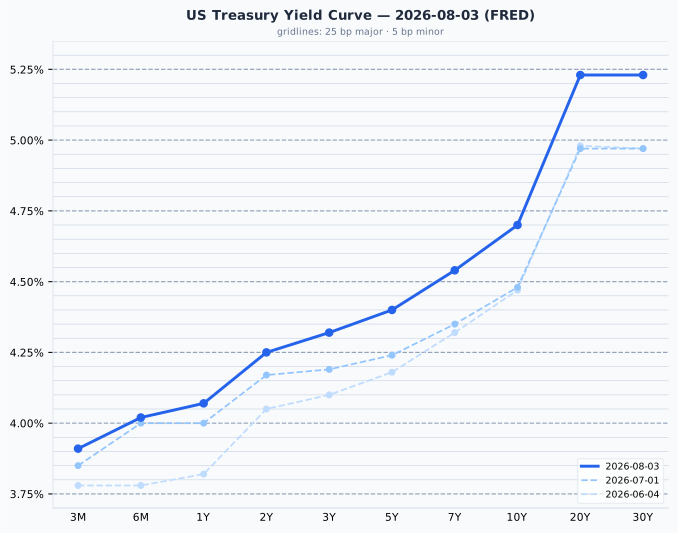
The US curve is positively sloped across its full length, rising steadily from 3.91% at 3 months to 5.23% at 20 and 30 years, with the 20Y and 30Y flat against each other at the very long end. Since a month ago the entire curve has shifted upward, but unevenly: the front end is up only 2-8 bps while the 10Y is up 22 bps and the 20Y/30Y up 26 bps — a clear bear steepening in which long-dated yields, not policy expectations, are doing the work.
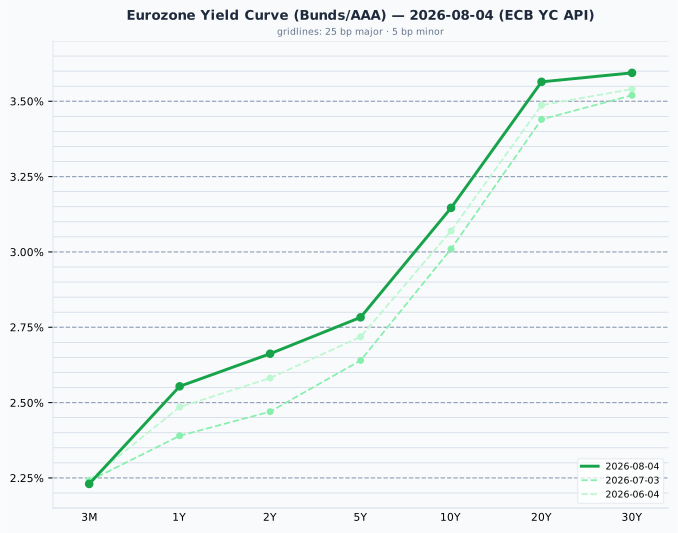
The euro AAA curve is also upward-sloping throughout, from 2.23% at 3 months to 3.59% at 30 years, but with a distinctly steeper belly-to-long-end transition than the US — the 5Y-to-10Y segment alone accounts for 36 bps of slope. Versus a month ago (2026-07-03) the curve has risen materially in the belly and long end (2Y +19 bps, 5Y +14 bps, 10Y +14 bps, 20Y +12 bps) while the 3-month point is essentially unchanged at 2.23%, with the ECB deposit rate anchored at 2.25%: the same bear-steepening pattern as the US, driven by term premium rather than policy repricing.
Credit Markets (from FRED — authoritative)
| Market | OAS Spread | Series ID | Observation |
|---|---|---|---|
| US Investment Grade | 78 bps | BAMLC0A0CM | 2026-08-04 |
| US High Yield | 273 bps | BAMLH0A0HYM2 | 2026-08-04 |
| Euro High Yield | 267 bps | BAMLHE00EHYIOAS | 2026-08-04 |
Credit is signalling no stress whatsoever — and arguably complacency. US high yield at 273 bps is below the 300-500 bps historically normal range, i.e. historically tight rather than merely comfortable; nothing close to the >500 bps that marks stress. US investment grade at 78 bps is also just below its 80-150 bps normal band. Euro high yield at 267 bps is tighter still than its US equivalent, an unusual ordering that reflects both the euro market's higher average credit quality and strong demand for euro carry. The message is consistent across all three: credit investors are being paid very little to bear default risk. Combined with a VIX at 16.50 (FRED VIXCLS, 2026-08-04) — the moderate 15-20 band, not low/complacent territory below 15, but in its lower half — there is little defensive positioning priced into either credit or equity volatility markets. That is a fragile configuration when equity multiples are simultaneously at 63% premiums.
Bond Portfolio Implications
On the raw numbers, bonds are the better-compensated asset in the US today. A 10-year Treasury yields 4.70% nominal and 2.43% real; the S&P 500 offers a 3.60% earnings yield with equity risk attached. The S&P 500 ERP is −1.10% ((1÷27.75) − 4.70) and the Nasdaq 100 ERP is −1.57% — both negative, which historically has been a warning signal for forward equity returns relative to bonds. In Europe the calculus inverts: the euro ERP is +2.11% ((1÷19.01) − 3.15), so European equities still earn their risk premium and European bonds do not dominate them. The UK sits awkwardly between the two at +0.51%, below the 1% threshold worth flagging.
Duration is the trade-off. With the 10-year at 4.70%, a 100 bp rise in yields implies roughly an 8-9% price loss on a 10-year bond, and the past month's bear steepening (10Y +22 bps, 30Y +26 bps) shows that risk is not hypothetical — long duration has been losing money even as the front end has barely moved. The 20Y and 30Y at 5.23% offer the highest nominal yields on the curve but only 53 bps of pickup over the 10Y for a great deal more duration, which is thin compensation. The more efficient position in this curve shape is the 5-7 year segment (4.40-4.54%), which captures most of the yield at a fraction of the duration risk, with the 3-month bill at 3.91% — above the Fed Funds midpoint — a genuinely attractive place to hold cash while the long end continues to reprice.
Currencies & Commodities
Currencies:
| Pair | Rate | Source |
|---|---|---|
| EUR/USD | 1.1519 | FRED DEXUSEU (2026-07-31) |
| USD Index | 119.70 | FRED DTWEXBGS (2026-07-31) |
| USD/JPY | 157.74 | web search (2026-08-05) |
| GBP/USD | 1.3450 | web search (2026-08-04) |
| USD/CHF | 0.8085 | web search (2026-08-05) |
The FRED FX series lag by three business days, so EUR/USD and the broad dollar index are as of 31 July — note the date gap before drawing conclusions about today's dollar move. USD/JPY at 157.74 is the number that matters most for the equity story above: a weak yen flatters Japanese exporter earnings and was part of the Nikkei's fuel today, but it also means unhedged foreign holders of Japanese equities are surrendering a meaningful share of their local-currency gains. USD/CHF at 0.8085 keeps the franc historically strong, a headwind the SMI has been climbing despite, and one worth noting for anyone holding Swiss equities in euros.
Commodities (all from yfinance front-month futures — 5 Aug settlements):
| Commodity | Price | Day Chg % | Ticker | Source |
|---|---|---|---|---|
| Brent Crude | $79.45/bbl | +0.11% | BZ=F | yfinance |
| WTI Crude | $75.22/bbl | −0.73% | CL=F | yfinance |
| Gold ($/oz) | $4,305.20 | +3.67% | GC=F | yfinance |
| Silver ($/oz) | $62.288 | +3.39% | SI=F | yfinance |
| Copper ($/lb) | $6.7275 | +1.26% | HG=F | yfinance |
| Nat Gas ($/MMBtu) | $2.688 | +0.22% | NG=F | yfinance |
Crude recovered substantially into the settlement, and only half of the third-consecutive-session decline survived. WTI settled at $75.22, down 0.73% rather than the 1.68% it showed mid-afternoon, while Brent broke the streak outright, settling 0.11% higher at $79.45 after trading down 0.84% intraday. Both finished roughly 1% above their mid-afternoon levels. This strengthens the reading above: with Tuesday's 5-6% collapse having already unwound the bulk of the geopolitical premium, the market found a floor once the Hormuz headline was fully priced. WTI is 48.9% below its all-time high of $147.27/bbl and Brent 46.1% below its $147.43/bbl peak; both sit in the lower half of their 52-week ranges ($54.98-$119.48 and $58.72-$126.10) and neither is anywhere near record territory.
Gold remains the day's standout, settling up 3.67% at $4,305.20/oz — essentially holding its intraday gain. At that price it is 22.9% below its all-time high of $5,586.20/oz, a peak set within the past 52 weeks. Two strong sessions have recovered only a fraction of a large correction; this is a bounce, not a return to highs, and the driver is visible in the rates data (the 10Y TIPS real yield has fallen from 2.47% to 2.43%). Silver shows the same pattern more violently: settling up 3.39% at $62.288/oz, it is still 48.6% below its own $121.30 all-time high, with a 52-week range of $37.21-$121.30 that spans a factor of more than three. Neither metal is near its highs.
Copper is the exception and the most economically informative print of the day: it settled at $6.7275/lb, 1.13% above its all-time high on a closing basis ($6.6525) and 0.12% below its $6.7355 52-week intraday high — at record levels on a settlement basis, with the gap between the two reference points reflecting that the ATH is measured on daily closes while the 52-week high includes intraday prints. Copper at records alongside soft oil and a rotation into cyclicals is a coherent growth-positive signal, and it is the single strongest piece of evidence that the day's move was about real economic activity rather than pure liquidity. Natural gas settled unchanged from its capture level at $2.688/MMBtu, up 0.22%, and remains 83.0% below its $15.78 all-time high — a spike-driven historical outlier that says little about current conditions; the more relevant frame is that it is close to the bottom of its $2.483-$7.827 52-week range.
Crypto: (not retrieved).
Sector & Theme Highlights
Best performing: Japanese and Korean technology and semiconductors were the day's clear leaders. SoftBank (+13.2%), Yamaha Motor (+19.4%) and Mitsui Kinzoku (+10.9%) drove Tokyo, while SK Hynix and Kioxia powered Seoul's 3.76% gain — a memory and AI-supply-chain trade rather than a broad Japanese or Korean re-rating. Precious metals and mining benefited from the gold and silver surge, visible in South Africa's EZA (+1.35%). US cyclicals and industrials outperformed, evidenced by the Dow's 0.49% record close against the Nasdaq 100's 0.83% decline.
Worst performing: US megacap technology, which gave back ground after four strong sessions and finished as the day's clearest loser — the Nasdaq 100's 0.83% fall was its first decline in five sessions, with SpaceX and AMD dropping after their quarterly results. Energy was the day's other soft spot but less so by the settlement: WTI settled down only 0.73% and Brent actually closed higher, so the third-session energy decline is really a WTI-only story by the settlement. German equities lagged Europe.
Cross-market themes: - Geopolitical de-escalation as the master variable — but with diminishing returns. The reported interim US-Iran agreement on the Strait of Hormuz has driven oil, inflation expectations and real yields lower all week. By Wednesday's settlement its power was visibly fading: crude stabilised (Brent even closed higher) and US equities finished mixed-to-lower rather than extending, with only the Dow holding a gain. It is a single-headline market, and single-headline markets reverse on single headlines. - The AI trade rotating rather than fading. Money moved out of US hyperscalers and into Asian semiconductor and memory suppliers today — the theme is intact, the expression changed. - A rate-cut narrative that is not actually a rate-cut narrative. Commentary framed lower oil as reducing pressure for further Fed tightening, not as accelerating cuts. With headline CPI at 3.46% and the 3-month bill 28 bps above the Fed Funds midpoint, the front end agrees. - Precious metals decoupled from risk sentiment. Gold and silver rallying hard during a risk-on equity session points to real yields and the dollar as the driver, not haven demand. - Divergence between developed-market records and Asian drawdowns. The US, France, Germany, the UK, Switzerland and Australia are at or within 1% of all-time highs; Japan is 9% below, Korea 30% below, Hong Kong 23% below and Shanghai 37% below. This is not a globally synchronised bull market.
Top Stories (Global)
- Nikkei 225 surges 3.66% to 66,300.44, with the Topix up 2.13% to 4,046, as Japanese equities followed Tuesday's record Wall Street closes. SoftBank (+13.2%), Yamaha Motor (+19.4%) and Mitsui Kinzoku (+10.9%) led. The move leaves the index still 9.0% below its all-time high and below its 50-day moving average.
- Korea's Kospi rises 3.76% to 6,598.26, trading up over 4% intraday, on semiconductor strength led by SK Hynix and Kioxia — the second consecutive strong Seoul session, though the index remains 29.7% below its record.
- Reports of an imminent interim US-Iran agreement to reopen the Strait of Hormuz continued to weigh on crude, though the move stalled at the settlement: WTI ended down 0.73% at $75.22 while Brent closed 0.11% higher at $79.45, ending its slide. The market reading is that this eases inflation pressure and reduces the case for further Fed tightening.
- The Dow closed at a record 54,349.12 on 5 August (+0.49%, +263 points), extending the record close of 54,085.88 it set on 4 August. It was the only major US index to finish higher: the S&P 500 slipped 0.17% to 7,723.55 and the Nasdaq 100 fell 0.83% to 29,487.79, its first down session in five, as SpaceX and AMD declined following their quarterly results.
- Gold settled up 3.67% at $4,305.20/oz as Treasury yields and oil fell, with silver up 3.39% at $62.288/oz. Both remain deep in drawdowns from all-time highs set within the past year (gold −22.9%, silver −48.6%).
- Copper settled at record levels at $6.7275/lb, 1.13% above its $6.6525 closing-basis all-time high and 0.12% below its $6.7355 52-week intraday high — a growth-positive signal that stands in contrast to the precious-metals rebound and the softness in energy.
- The BOJ held at 1.00% on 31 July in an 8-1 vote, with Takata dissenting for 1.25%. The bank expects core inflation clearly above 2% from the second half of FY2026, keeping a further hike live — the key policy risk for the Japanese equity rally.
- US ISM Services PMI came in at 54.1 for July (consensus 54.5), a 25th month of expansion, but with the Employment sub-index at 47.4 in contraction and Prices back above 70. ADP employment rose just +44k against a +68k consensus — a soft labour print alongside re-accelerating services input costs.
Looking Ahead
Next 1-5 trading days:
- US data: with ISM Services at 54.1 and ADP at just +44k now in hand, the July employment report is the week's pivotal release. ADP's undershoot and the ISM Employment index at 47.4 both point to further labour-market cooling; watch whether the +57k monthly payroll pace from June is confirmed or revised, and whether the ISM Prices index above 70 starts showing up in the CPI print.
- Eurozone: July final Services PMI (flash 51.6). With Q2 GDP at 0.4% QoQ and July HICP at 2.9% YoY with core accelerating, the ECB's hold at a 2.25% deposit rate faces a genuine test if inflation continues to firm.
- Middle East / oil: the single largest swing factor. Confirmation or collapse of the reported US-Iran interim agreement on the Strait of Hormuz would move crude, inflation expectations, real yields and equities together, in either direction.
- Japan: no BOJ meeting imminent after the 31 July hold, but with an 8-1 vote and inflation guidance above 2%, every wage and CPI datapoint feeds the next-hike debate. USD/JPY at 157.74 keeps intervention chatter alive.
- Earnings: AI-hyperscaler results have been the sustaining force behind the US rally, so the 5 August rotation — Dow to a record, Nasdaq 100 down 0.83% on SpaceX and AMD results — is the signal to watch. Whether it persists into the back half of the reporting season determines if this is a healthy broadening or the start of a de-rating in the AI complex.
- France: the OAT-Bund spread near 75 bps and the France-Italy spread now essentially closed at 6 bps make French fiscal headlines a live risk for the CAC 40 and euro-area credit.
Market closures (from the Nager.Date holiday calendar): - Tuesday 11 August — Japan: Mountain Day. Tokyo markets closed. - Saturday 15 August — France: Assumption Day (falls on a weekend; no trading-day impact). - No closures in the US, UK, Germany, Australia, Switzerland, Canada, Korea or Brazil in the next five trading days. - India holiday data is absent from the 2026 calendar, so Indian closures cannot be confirmed and are not asserted here.
Data sources: FRED (US Treasuries, Fed Funds, VIX, credit spreads, EUR/USD, US macro, ECB deposit rate, SONIA); ECB Yield Curve API (euro AAA curve); yfinance (all equity index levels, P/E proxies, commodity futures); targeted web search (non-euro-area bond yields, JPY/GBP/CHF, BOJ policy, economic calendar, market news).