2026 06 25
Global Financial Briefing — Thursday, 25 June 2026
Market Overview
Global risk appetite is firmly in risk-on territory today, with a powerful rally in Japan and Korea dominating the Asian session while European indices closed at or near 52-week highs. The Nikkei 225 surged +4.61% to 72,366 — a powerful single-session advance — following the BOJ's historic rate hike to 1.00% on June 16, the first time Japan's policy rate has reached that level since 1995. Markets appear to be interpreting the BOJ's normalisation as a sign of economic confidence rather than a headwind. The KOSPI advanced +5.42% in what appears to be a continuation of the broader Asia bull run, while the Euro STOXX 600 reached 640.21, effectively touching its 52-week high. The SMI (Swiss Market Index) similarly closed within 0.3% of its 52-week high.
US markets are muted by comparison — trading essentially flat mid-session (+0.01% for the S&P 500) following the release of hotter-than-expected PCE inflation data. May PCE came in at 4.1% YoY, the highest since April 2023, while Core PCE printed 3.4% YoY — well above the Fed's 2% target and a significant re-acceleration from early 2026 levels. This data materially reduces the probability of near-term Fed rate cuts and weighed on sentiment in early US trading, even as strong personal income (+0.7% vs 0.4% expected) showed the consumer remains resilient. The 10-year Treasury closed at 4.50% (FRED, June 23), with VIX at 18.63 — elevated moderate territory suggesting investors are hedging against the Fed staying higher for longer.
The dominant cross-market theme is a broadening global divergence: Japanese and European equities are at or near historic highs on continuing easing cycles (BOJ normalising gradually; ECB at 2.25%), while US equities face a genuine valuation challenge with negative Equity Risk Premium (-0.69%) and re-accelerating inflation. Credit spreads remain at historically tight levels globally — US HY at 271 bps is well below the 300–500 bps normal range — which either signals exceptional economic health or concerning complacency ahead of a potential US monetary tightening. Oil is recovering (+1.56–1.69%) after yesterday's sharp decline on news of Strait of Hormuz progress, while gold holds at $4,046, well off its all-time high of $5,586 reached in the past 52 weeks.
Global Indices Snapshot
Americas
Data reflects intraday session (25 Jun) — US markets open (REGULAR).
| Index | Level | Day Chg | Day Chg % | Source |
|---|---|---|---|---|
| S&P 500 | 7,358.99 | +0.77 | +0.01% | yfinance ^GSPC (intraday); FRED SP500 close 7,365.46 (2026-06-23) |
| Nasdaq 100 | 29,469.25 | +249.19 | +0.85% | yfinance ^NDX |
| Dow Jones | 52,004.93 | +156.03 | +0.30% | yfinance ^DJI |
| Brazil IBOV | 172,525.9 | +2,019.25 | +1.18% | yfinance ^BVSP |
S&P 500 authoritative prior close: 7,365.46 (FRED SP500, 2026-06-23). Intraday data from yfinance shows the index flat vs Wednesday's close of 7,358.22 following the PCE inflation release.
Europe
European data reflects today's close (25 Jun).
| Index | Level | Day Chg | Day Chg % | Source |
|---|---|---|---|---|
| Euro STOXX 600 | 640.21 | +5.05 | +0.80% | yfinance ^STOXX |
| Euro STOXX 50 | 6,267.53 | +52.83 | +0.85% | yfinance ^STOXX50E |
| CAC 40 | 8,431.61 | +46.12 | +0.55% | yfinance ^FCHI |
| DAX | 24,994.83 | +254.47 | +1.03% | yfinance ^GDAXI |
| FTSE 100 | 10,529.89 | +68.26 | +0.65% | yfinance ^FTSE |
| SMI (Swiss) | 14,231.96 | +114.21 | +0.81% | yfinance ^SSMI |
Euro STOXX 600 (640.21) is within 0.3% of its 52-week high of 642.09. SMI (14,232) is within 0.3% of its 52-week high of 14,268.
Asia-Pacific
Asia-Pacific data reflects today's close (25 Jun).
| Index | Level | Day Chg | Day Chg % | Source |
|---|---|---|---|---|
| Nikkei 225 | 72,366.34 | +3,191.38 | +4.61% | yfinance ^N225 |
| Hang Seng | 23,076.91 | −335.27 | −1.43% | yfinance ^HSI |
| Shanghai Comp | 4,120.28 | +9.47 | +0.23% | yfinance 000001.SS |
| ASX 200 | 8,748.70 | −59.70 | −0.68% | yfinance ^AXJO |
| Kospi (Korea) | 8,930.30 | +459.28 | +5.42% | yfinance ^KS11 |
| India Nifty 50 | 24,056.00 | +34.35 | +0.14% | yfinance ^NSEI |
Nikkei +4.61% is today's standout move; at 72,366 it sits 0.6% below its 52-week high of 72,832. Note: KOSPI 52-week low shows 0.00 in source data — a known yfinance data artefact; disregard for range analysis.
Emerging Markets
Data reflects today's close (25 Jun).
| Index | Level | Day Chg % | Source |
|---|---|---|---|
| MSCI EM (EEM) | 68.09 | +1.24% | yfinance EEM |
| India Nifty 50 | 24,056 | +0.14% | yfinance ^NSEI |
| South Africa | (not retrieved) | — | yfinance ^J203 (ticker error) |
Index Valuations & Investment Risk
Valuation Table
| Index | Trailing P/E (live) | Hist avg trailing P/E (†) | Premium to hist avg | Shiller CAPE |
|---|---|---|---|---|
| S&P 500 | 26.26x (SPY) | ~16–18x | +54.5% ⚠️ | (not retrieved) |
| Nasdaq 100 | 32.92x (QQQ) | ~25–30x | +19.7% | n/a |
| Euro STOXX 600 | 18.26x (EXSA.DE) | ~15–17x | +14.1% | n/a |
| CAC 40 | 17.63x (CAC.PA) | ~14–16x | +17.5% | n/a |
| DAX | 18.27x (EXS1.DE) | ~15–17x | +14.2% | n/a |
| FTSE 100 | 17.77x (ISF.L) | ~13–15x | +26.9% ⚠️ | n/a |
| Nikkei 225 | 24.59x (1321.T) | ~20–22x | +17.1% | n/a |
| MSCI EM | 18.03x (EEM) | ~13–15x | +28.8% ⚠️ | n/a |
(†) Hist avg trailing P/E: static long-run reference constants. Live trailing P/E sourced from yfinance trailingPE on ETF proxies.
Premium = (live P/E ÷ hist avg midpoint − 1) × 100. ⚠️ = >20% premium to historical average.
Investment Risk Assessment for ETF Investors
United States (S&P 500 / Nasdaq ETFs)
The S&P 500's trailing P/E of 26.26x is 54.5% above its long-run historical average of ~17x — a level that has historically been associated with below-average forward 10-year returns. More strikingly, the Equity Risk Premium is now negative: S&P 500 earnings yield = (1÷26.26) = 3.81%, versus the 10-year Treasury yield of 4.50% (FRED DGS10, 2026-06-23). This implies a US ERP of −0.69% — meaning US Treasuries currently yield more than the S&P 500 on an earnings basis. Negative ERP is a historically infrequent condition and a well-documented warning signal for forward equity returns.
The 10-year TIPS real yield stands at 2.29% (FRED DFII10, 2026-06-23), indicating genuine tightness in real rates — a meaningful headwind for equity valuations, as higher real discount rates compress the present value of future earnings. The S&P 500 is currently 3.4% below its 52-week high of 7,620.90, trading above both its 50-day MA (7,349) and 200-day MA (6,916), but today's hot PCE data (4.1% YoY) materially reduces the probability of near-term Fed rate cuts.
Risk assessment: High valuation risk / low margin of safety (US equities)
Europe (STOXX 600 / CAC 40 / DAX ETFs)
European valuations are elevated relative to historical averages but far less extreme than the US. Euro STOXX 600 trailing P/E of 18.26x represents a 14.1% premium to its ~16x historical average. European equities offer a positive Equity Risk Premium: Euro STOXX 600 earnings yield = (1÷18.26) = 5.48%, versus the German 10-year Bund yield of 2.87% (web search, 2026-06-24) — implying a Euro ERP of +2.61%. This is a meaningful positive premium, particularly attractive for non-EUR investors on a hedged basis.
The Euro STOXX 600 is essentially at its 52-week high (640.21 vs 642.09), and the ECB deposit rate at 2.25% (FRED ECBDFR) is still meaningfully below inflation — the ECB easing cycle continues to support risk assets. The OAT-Bund spread of 65 bps (web search) reflects residual French fiscal risk premium. The France-Italy 10Y spread has narrowed to approximately 7 bps (OAT 3.52% vs BTP 3.59%), representing near-convergence.
Currency risk for non-EUR investors: EUR/USD at 1.147 (FRED DEXUSEU, 2026-06-18) with Broad USD Index at 120.40 — the USD has strengthened against the euro in recent months, which may affect EUR-denominated ETF returns when converted back to USD or GBP.
Risk assessment: Moderate — fair value, with positive ERP but valuation premium vs history
Japan (Nikkei / TOPIX ETFs)
Japan is today's standout: Nikkei +4.61% to 72,366, within 0.6% of its 52-week high of 72,832. The Nikkei trailing P/E (via 1321.T) of 24.59x is 17% above its historical average of ~21x. Earnings yield = (1÷24.59) = 4.07%, versus Japan 10Y JGB of 2.67% (web search, June 24) — implying a Japan ERP of +1.40%, a positive buffer.
The key risk for non-JPY investors is currency: the BOJ raised rates to 1.00% on June 16, but USD/JPY remains at 161.8 — still a highly depressed yen. Any further BOJ hawkishness or US data softening could trigger rapid JPY appreciation, creating currency losses for unhedged Nikkei investors even as yen-denominated prices rise. Ongoing corporate governance reforms and strong domestic earnings underpin the bull case.
Risk assessment: Moderate — positive ERP, structural reforms support, but watch USD/JPY
Emerging Markets (MSCI EM ETFs)
MSCI EM (EEM) at 68.09 (+1.24%), 52-week range: $47.90–$71.57, trailing P/E 18.03x. The 18.03x level is 28.8% above the historical average of ~14x — a notable premium that is partially explained by China's weight and improved earnings. ERP vs US 10Y: (1÷18.03) − 4.50% = 5.55% − 4.50% = +1.05% — marginally positive. Hang Seng is a concern: at 23,077, it is near its 52-week low of 22,979 and trades 17.8% below its 52-week high of 28,056 — diverging sharply from other EM markets.
Risk assessment: Moderate — mixed signals; attractive valuation vs US but China/HK weakness is a drag
Overall Valuation Summary: - US equities: historically stretched (negative ERP, 55% P/E premium vs history) - European equities: elevated but with positive ERP; ECB tailwind - Japan: fair-to-elevated valuation; strong momentum; JPY hedge crucial - EM: above historical average valuation; mixed regional picture
Disclaimer: This is financial information, not personalised investment advice. Past valuations do not guarantee future returns. Consult a financial advisor before investing.
US Economic Indicators (FRED — authoritative)
| Indicator | Current | Prior | Delta | Reference Date | FRED Series |
|---|---|---|---|---|---|
| CPI YoY % | 4.17% | 3.78% | +0.39pp | May 2026 | CPIAUCSL |
| Core CPI YoY % | 2.82% | 2.74% | +0.08pp | May 2026 | CPILFESL |
| Unemployment Rate | 4.3% | 4.3% | flat | May 2026 | UNRATE |
| Nonfarm Payrolls | +172K | +179K | −7K | May 2026 (MoM) | PAYEMS |
| 10Y TIPS Real Yield | 2.29% | — | — | 2026-06-23 | DFII10 |
FRED macro data is monthly, typically lagging 4–6 weeks. CPI at 4.17% YoY (May) is the highest since 2023, a significant re-acceleration. Core CPI at 2.82% remains well above the Fed's 2% target. Unemployment stable at 4.3%; NFP +172K shows solid but decelerating job growth.
Other economic releases today (June 25, 2026 — web search):
- US PCE Price Index (May): +4.1% YoY (highest since April 2023); Core PCE +3.4% YoY (highest since October 2023). Monthly: PCE +0.4%, Core PCE +0.3%. Released today by the BEA. Hot print reinforces the message from CPI data — US inflation re-accelerating, driven by tariff pass-through and services persistence. Market reaction: US 10Y yields edged slightly higher; equities initially dipped on the open before recovering to flat.
- US Personal Income (May): +0.7% MoM vs 0.4% expected — significant beat, suggesting resilient consumer spending capacity.
- US Q1 2026 GDP Final Estimate: Released today; preliminary details not yet available in search results.
- Germany/Bund data: ECB YC API unavailable today (503 error); Bund yields sourced from web search (10Y only).
Fixed Income & Bond Analysis
Policy Rates
| Central Bank | Rate | Source |
|---|---|---|
| Fed Funds (upper) | 3.75% | FRED DFEDTARU (2026-06-25) |
| Fed Funds (lower) | 3.50% | FRED DFEDTARL (2026-06-25) |
| Effective FFR | 3.63% | FRED DFF (2026-06-23) |
| ECB Deposit Rate | 2.25% | FRED ECBDFR (2026-06-25) |
| BOJ Policy Rate | 1.00% | web search (raised 2026-06-16) |
| BOE Bank Rate | ~3.73% (SONIA) | FRED IUDSOIA (2026-06-23) |
Government Bond Yields
| Country | 2Y Yield | 10Y Yield | 30Y Yield | Day Chg (10Y) | Source |
|---|---|---|---|---|---|
| USA | 4.16% | 4.50% | 4.94% | — | FRED (2026-06-23) |
| Germany | (not retrieved) | 2.87% | (not retrieved) | — | web search (2026-06-24) |
| France | (not retrieved) | 3.52% | (not retrieved) | — | web search |
| UK | 4.17% | 4.78% | (not retrieved) | — | web search (2026-06-24) |
| Japan | (not retrieved) | 2.67% | (not retrieved) | — | web search (2026-06-24) |
| Italy | (not retrieved) | 3.59% | (not retrieved) | — | web search (2026-06-24) |
ECB YC API returned HTTP 503 today; full Bund curve unavailable. Only 10Y Bund retrieved via web search.
Yield Curve Spreads (FRED pre-computed):
- 10Y–2Y spread: +30 bps (FRED T10Y2Y, 2026-06-24) — modestly positive; the curve has been flattening over the past month (from ~49 bps on May 25). Not inverted, but increasingly flat at the front end as short rates rise on hot inflation data.
- 10Y–3M spread: +56 bps (FRED T10Y3M, 2026-06-24) — positive; the recession signal from the deep inversion of 2023–2024 has fully cleared.
The bear flattening dynamic is key: the 2-year yield (+8 bps over the past month) has risen faster than the 10-year (−7 bps), reflecting the market repricing Fed rate cut expectations out. With PCE printing 4.1% today, another leg of short-end repricing is likely.
OAT-Bund Spread (France–Germany 10Y): approximately 65 bps (3.52% − 2.87%), down sharply from the ~150 bps+ levels seen during French political turmoil in 2024–2025. The France–Italy spread has narrowed to approximately 7 bps (OAT 3.52% vs BTP 3.59%), reflecting convergence in French and Italian perceived fiscal risk.
Yield Curve Charts
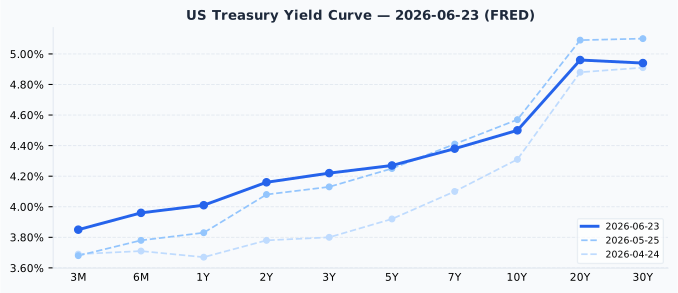
The US curve (as of 2026-06-23, FRED) is modestly positively sloped, with 3M at 3.85% and 30Y at 4.94% — a 109 bps total spread. Compared to one month ago (May 25), the curve has bear-flattened: short-end yields (2Y) have risen ~8 bps while long-end (10Y) has fallen ~7 bps. The long-end hump at 20Y (4.96%) slightly exceeds 30Y (4.94%), a minor technical anomaly typical when long-term supply/demand pressures diverge at the 20Y maturity.
(ECB YC API unavailable today — using last retrieved Eurozone curve from 2026-06-23)
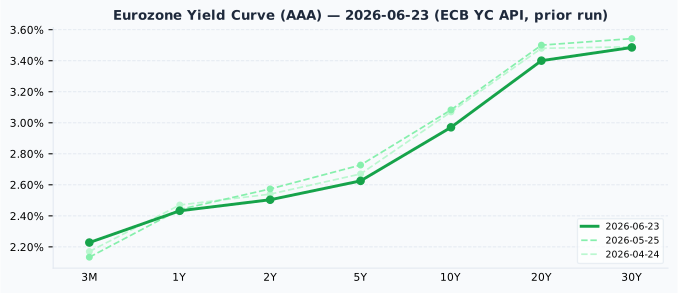
The ECB AAA Euro Area curve (2026-06-23) is upward-sloping throughout, with 3M at 2.23% and 30Y at 3.49%. Compared to one month ago (May 25), the entire Eurozone curve has shifted down modestly at mid-to-long maturities (10Y down ~11 bps from 3.08% to 2.97%), consistent with the ECB rate cut cycle continuing. The positive slope (unlike the flatter US curve) suggests European markets see continued monetary easing ahead.
Credit Markets (FRED — authoritative)
FRED OAS spreads reported in percentage points; multiplied by 100 to convert to basis points.
| Market | OAS Spread | Level vs Benchmarks | FRED Series |
|---|---|---|---|
| US Investment Grade | 74 bps | Below normal (80–150) | BAMLC0A0CM |
| US High Yield | 271 bps | Below normal (300–500) | BAMLH0A0HYM2 |
| Euro High Yield | 262 bps | Below normal (300–500) | BAMLHE00EHYIOAS |
All three spreads are at historically tight levels, well below long-run averages. US HY at 271 bps is the tightest since the pre-COVID era and signals either exceptional corporate health or elevated complacency. Historically, spreads this tight (below 300 bps for HY) have preceded periods of spread widening when macro conditions deteriorate. This is particularly relevant given today's hot PCE print and the risk of Fed rate hikes re-entering the conversation.
Bond Portfolio Implications
With the 10-year Treasury at 4.50% and US IG spreads at 74 bps, IG corporate bonds yield approximately 5.24% — a genuinely attractive absolute yield for fixed income investors, albeit at historically tight credit spreads. The risk is spread widening rather than duration.
US Equity Risk Premium: S&P 500 earnings yield (1÷26.26) = 3.81% vs 10Y Treasury 4.50% → ERP = −0.69%. Bonds are more attractively valued than equities on this metric for the first time in years.
Euro Equity Risk Premium: STOXX 600 earnings yield (1÷18.26) = 5.48% vs Bund 10Y 2.87% → Euro ERP = +2.61%. European equities remain attractive relative to bonds.
Duration risk note: If yields rise 100 bps from current levels, a 10-year bond would lose approximately 8–9% in price. Given persistent US inflation above 4%, investors in long-duration US Treasuries face meaningful mark-to-market risk if the Fed resumes hiking.
Currencies & Commodities
Currencies:
| Pair | Rate | Source |
|---|---|---|
| EUR/USD | 1.1470 | FRED DEXUSEU (2026-06-18) |
| USD Index | 120.40 | FRED DTWEXBGS (2026-06-18) |
| USD/JPY | 161.8 | web search (2026-06-22) |
| GBP/USD | 1.3200 | web search (2026-06-21) |
| USD/CHF | 0.8124 | web search (most recent) |
EUR/USD and Broad USD Index from FRED lag ~1 week (last observation 2026-06-18). USD/JPY at 161.8 remains near multi-decade highs against the yen despite the BOJ's June 16 rate hike to 1.00%, illustrating the persistent carry trade interest in USD vs JPY.
Commodities (all from yfinance MCP, front-month futures, intraday June 25):
| Commodity | Price | Day Chg % | Ticker | 52wk Range | vs ATH |
|---|---|---|---|---|---|
| Brent Crude | $75.02/bbl | +1.56% | BZ=F | $58.72–$126.10 | 49.1% below $147.43 |
| WTI Crude | $71.53/bbl | +1.69% | CL=F | $54.98–$119.48 | 51.4% below $147.27 |
| Gold | $4,046/oz | +0.93% | GC=F | $3,253.80–$5,586.20 | 27.6% below $5,586.20 |
| Silver | $58.12/oz | +0.06% | SI=F | $35.27–$121.30 | 52.1% below $121.30 |
| Copper | $6.14/lb | +2.08% | HG=F | $4.32–$6.65 | 7.8% below $6.65 |
| Nat Gas | $3.29/MMBtu | +0.89% | NG=F | $2.48–$7.83 | 79.2% below $15.78 |
Oil: Brent ($75.02) and WTI ($71.53) are rebounding today after yesterday's sharp decline (-4.3% and -3.9% respectively) triggered by progress on reopening the Strait of Hormuz. Both remain well within their established 2026 ranges and are 49–51% below their all-time highs of ~$147/bbl reached in 2022. Geopolitical risk premia remain elevated but have partially normalised.
Gold: At $4,046/oz, gold is 27.6% below its all-time high of $5,586.20, which was also the 52-week high — meaning gold reached that historic peak within the last year before pulling back significantly. The 10-year TIPS real yield at 2.29% (a headwind for gold as a non-yielding asset) is one explanation for the correction. Gold remains well above its 52-week low of $3,253.80.
Silver: At $58.12/oz, silver is 52.1% below its all-time high of $121.30 (which was also the 52-week high, indicating the peak was recent). Silver's sharp divergence from gold highlights the industrial demand uncertainty outweighing safe-haven buying; the silver/gold ratio at 14.3x (silver is significantly underperforming gold) is notable for precious metals investors.
Copper: At $6.14/lb, copper is 7.8% below its all-time high of $6.65 (also the 52-week high). The +2.08% gain today reflects strong risk-on sentiment and continued industrial demand signals from the global manufacturing outlook.
Natural Gas: At $3.29/MMBtu, nat gas is 79.2% below its all-time high of $15.78 but trading comfortably within its 52-week range ($2.48–$7.83). Recovery from the 2024 trough continues.
Crypto: No notable moves exceeding the 3% threshold identified in today's searches.
Sector & Theme Highlights
Top themes driving markets today:
-
BOJ normalisation and Japanese equity bull run: The BOJ's rate hike to 1.00% on June 16 — the highest since 1995 — has paradoxically boosted Japanese equity sentiment, with the Nikkei +4.61% today to 72,366 and within striking distance of its 52-week high of 72,832. Markets are interpreting the hike as validation of Japan's reflationary success after three decades of deflation, supported by strong corporate earnings and governance reforms.
-
US inflation re-acceleration — Fed policy pivot in question: CPI at 4.17% and Core PCE at 3.4% (today's release) both point to a significant re-acceleration of US inflation from early-2026 lows around 2.4%. The tariff pass-through to consumer prices appears to be more persistent than expected. The Fed Funds target at 3.50–3.75% with effective rate at 3.63% may need to move higher, or at minimum stay higher for longer. This is bullish for Treasuries if the economy softens, but the current data does not support an imminent pivot.
-
European equities at cycle highs: Euro STOXX 600 at its 52-week high and the DAX within 2% of its 52-week high. ECB deposit rate at 2.25% remains accommodative; European earnings are beating expectations. The OAT-Bund spread has compressed dramatically from 2024–2025 crisis levels to 65 bps, reflecting reduced French political risk premium.
-
Credit spread compression: All three credit spread measures (US IG 74 bps, US HY 271 bps, Euro HY 262 bps) are at historically tight levels — tighter than long-run averages — signalling either exceptional macroeconomic resilience or elevated complacency. A mean-reversion in spreads would represent significant losses for credit investors.
-
Geopolitics and energy: Strait of Hormuz progress reduced the oil risk premium sharply yesterday; partial recovery today. The situation remains fluid and any reversal could spike oil sharply. The KOSPI's +5.42% move today may partly reflect Korean equity repricing as regional geopolitical risk settles.
-
Semiconductors in focus: Micron Technology reports earnings after the US close today. The result is a major data point for AI memory demand and the broader semiconductor capex cycle — a key driver of the Nasdaq 100 (+0.85% today).
Top Stories (Global)
- BOJ raises rates to 1.00% (June 16) — Bank of Japan voted 7–1 to hike its policy rate to 1.00%, the highest since 1995, as inflation and yen weakness force a historic policy normalisation. BOJ board member Tamura signalled the rate should eventually reach ~2% neutral. The Nikkei's +4.61% reaction today suggests equity markets are pricing in a healthy economic backdrop rather than a tightening headwind (CNBC).
- US PCE inflation re-accelerates to 4.1% (May 2026) — Released today, the PCE price index hit its highest level since April 2023, while Core PCE at 3.4% marks the highest since October 2023. Personal income surged +0.7% vs 0.4% expected. The data eliminates near-term Fed rate cut prospects and re-opens the question of whether further hikes may be needed (BEA/CNBC).
- FedEx drops ~7% premarket after Q4 earnings — Despite beating on revenue ($25B vs $24B expected) and EPS ($6.31 vs $5.96 expected), markets focused on guidance concerns. As a bellwether for global trade and logistics, FedEx's stock reaction underscores investor caution about future demand visibility (TheStreet).
- Micron Technology earnings after the bell today — The chipmaker is expected to provide key insights into AI-driven memory demand (HBM, DRAM). Results will be closely watched for implications on Nvidia, TSMC, and the broader AI capex cycle.
- Strait of Hormuz tensions ease — Progress on reopening the strait contributed to a 4%+ decline in oil prices on June 24. WTI and Brent are recovering today (+1.6–1.7%) but remain well off recent highs. Geopolitical risk premium in energy markets has partially normalised.
- OAT-BTP spread at ~7 bps — French and Italian 10-year bond yields have effectively converged (OAT 3.52% vs BTP 3.59%), a remarkable development given the 100–150 bps+ French risk premium seen during 2024–2025 political turbulence. This signals a significant normalisation of European sovereign risk.
- Nikkei 225 near all-time high — At 72,366 (+4.61% today), the Nikkei is within 0.6% of its 52-week high of 72,832. Strong corporate governance reforms, robust earnings, and BOJ policy confidence are driving continued institutional inflows into Japanese equities.
Looking Ahead
Key events in the next 5 trading days (June 26 – July 2):
Central bank & policy: - Fed speakers likely to address PCE data; watch for commentary on whether the re-acceleration in PCE/CPI justifies pausing or reversing the easing path - BOJ — no scheduled meeting, but Governor Ueda expected to speak; yen sensitivity high - BOE MPC next meeting: July 6 (not in this window, but UK 10Y at 4.78% vs SONIA 3.73% suggests market pricing in further tightening)
Economic releases: - US NFP (June jobs report): Due approximately early July — will confirm whether labour market remains resilient alongside re-accelerating inflation - US ISM Manufacturing/Services PMI (early July) - Eurozone CPI — watch for confirmation of the ECB's disinflation path - Japan CPI — critical with BOJ at 1.00% and market watching for further hikes
Earnings: - Micron Technology (tonight, June 25 after US close) — AI memory bellwether; critical for semiconductor sector direction - Darden Restaurants (DRI) — today; US consumer health indicator - Nike (NKE) — coming up this week; global consumer demand read
Market closures (from the Nager.Date holiday calendar): - Wednesday, 1 July 2026: Canada Day — TSX closed - Friday, 3 July 2026: US Independence Day (observed) — US markets (NYSE, NASDAQ) closed; short trading week ahead for US investors
Briefing produced: Thursday, 25 June 2026 Data sources: FRED (Federal Reserve Bank of St. Louis), yfinance MCP, ECB YC API (unavailable today — 503), web search (bond yields, FX, BOJ rate, PCE, news). All FRED data cited with series ID and observation date. ECB YC API data from prior run (2026-06-23) used for chart only.