2026 09 02
Global Financial Briefing — Wednesday, 2 September 2026
Market Overview
The day belonged to oil and to bonds. Renewed US-Iran fighting pushed crude above $95 a barrel on the Brent contract, and the energy shock fed straight into an already-tender global rates market. Asia took the brunt of it: the Kospi fell 3.99% and the Nikkei 225 lost 2.85%, described in press coverage as one of the region's steepest single-session losses, with the selling concentrated in technology and semiconductor names. Japanese equity value destruction ran to roughly ¥31.8 trillion (about $202 billion) on press estimates. The dollar was bid throughout, with USD/JPY at 160.27 and the yen sitting at a level that has become a live policy problem for the Bank of Japan.
Europe closed lower but nothing like Asia. The STOXX 600 gave up 0.24%, the DAX 0.50% and the CAC 40 0.26%, while the Swiss SMI actually gained 0.20%. The real European story was in the bond market, where the selloff that took euro-area yields to 15-year highs on 1 September continued to bite: the AAA-rated 10-year sits at 3.36% and the German 10-year Bund traded above 3.3% for the first time since May 2011, on web-sourced figures. France remains the pressure point, with the 10-year OAT above 4.21%, its highest since November 2008, and an OAT-Bund spread near 85 bp. This is a duration and fiscal-supply repricing, not a periphery credit event: Italy's 10-year at 4.17% is actually trading through France.
The United States is the outlier, and the divergence is worth dwelling on. US equities rose while Asia fell: the S&P 500 closed up 0.46% at 7,666.60, the Dow 0.56% and the Nasdaq 100 a more muted 0.23%. Energy strength plausibly explains part of that, since the US index carries the producers that a $95 crude print rewards. But the US bond market is not comfortable either. The settled par curve for 1 September shows the 10-year at 4.79%, up 4 bp on the session, the 2-year at 4.39%, up 5 bp, and the 30-year at 5.27%. The last available quotes on 2 September put the 10-year note at 4.796% and the 30-year at 5.267% (^TNX and ^TYX, last quote 14:59 ET), essentially unchanged against their own prior reference, so the long end held its ground rather than extending. Brazil was the day's standout gainer, the IBOV closing up 3.05%.
One caveat on the volatility picture: the VIX last settled at 16.34 (FRED VIXCLS, 2026-09-01), which is moderate on the conventional 15 to 20 band and hardly the reading of a market in distress. That observation predates today's session, though, so it describes the calm going into the shock rather than the response to it. Tomorrow's print is the one that will say whether this was a one-day energy scare or the start of something with more staying power.
Global Indices Snapshot
Americas
| Index | Level | Day Chg | Day Chg % | Source |
|---|---|---|---|---|
| S&P 500 | 7,666.60 | +35.13 | +0.46% | yfinance ^GSPC |
| Nasdaq 100 | 29,143.33 | +66.11 | +0.23% | yfinance ^NDX |
| Dow Jones | 53,061.95 | +295.07 | +0.56% | yfinance ^DJI |
| Brazil IBOV | 185,205.10 | +5,482.61 | +3.05% | yfinance ^BVSP |
Americas data reflects today's close (2 Sep).
Europe
| Index | Level | Day Chg | Day Chg % | Source |
|---|---|---|---|---|
| Euro STOXX 600 | 645.91 | -1.55 | -0.24% | yfinance ^STOXX |
| Euro STOXX 50 | 6,362.15 | -6.83 | -0.11% | yfinance ^STOXX50E |
| CAC 40 | 8,280.63 | -21.22 | -0.26% | yfinance ^FCHI |
| DAX | 25,839.33 | -130.78 | -0.50% | yfinance ^GDAXI |
| FTSE 100 | 10,756.45 | -32.83 | -0.30% | yfinance ^FTSE |
| SMI (Swiss) | 14,362.97 | +28.18 | +0.20% | yfinance ^SSMI |
European data reflects today's close (2 Sep).
Asia-Pacific
| Index | Level | Day Chg | Day Chg % | Source |
|---|---|---|---|---|
| Nikkei 225 | 64,325.64 | -1,889.70 | -2.85% | yfinance ^N225 |
| Hang Seng | 25,311.21 | -18.52 | -0.07% | yfinance ^HSI |
| Shanghai Comp | 3,941.39 | -38.50 | -0.97% | yfinance 000001.SS |
| ASX 200 | 8,978.40 | -88.30 | -0.97% | yfinance ^AXJO |
| Kospi (Korea) | 6,562.72 | -273.08 | -3.99% | yfinance ^KS11 |
Asia-Pacific data reflects today's close (2 Sep).
Emerging Markets
| Index | Level | Day Chg % | Source |
|---|---|---|---|
| MSCI EM (EEM) | 67.15 | +0.57% | yfinance EEM |
| India Nifty 50 | 23,914.45 | -0.59% | yfinance ^NSEI |
| South Africa | 69.99 | +0.65% | yfinance EZA |
EEM and EZA are US-listed ETFs and reflect today's US close. The Nifty reflects today's Indian close.
Positioning against trend is mixed and informative. The S&P 500, Dow, DAX, FTSE 100 and SMI all sit above both their 50-day and 200-day moving averages. The Nasdaq 100 has slipped below its 50-day, and the Nikkei is now 2,664 points below its own 50-day after today's fall, though still comfortably above its 200-day. The Kospi has broken well below its 50-day (7,070) while holding above its 200-day (6,024), which is the signature of a sharp correction inside an intact uptrend rather than a trend break. Nothing in the table is at record highs: the S&P 500 is the closest at 1.92% below its all-time high, and the Nasdaq 100 is 5.26% below.
Note: yfinance reports a 52-week low of exactly 0.0 for the Kospi, which no index trades at. That field is a data error and the Kospi's 52-week low is omitted here rather than reported.
Index Valuations & Investment Risk
Valuation Table
| Index | Trailing P/E (live) | Hist avg trailing P/E (†) | Premium to hist avg |
|---|---|---|---|
| S&P 500 | 25.78x | ~16-18x | +52% |
| Nasdaq 100 | 30.33x | ~25-30x | +10% |
| Euro STOXX 600 | 17.80x | ~15-17x | +11% |
| CAC 40 | 16.97x | ~14-16x | +13% |
| DAX | 18.70x | ~15-17x | +17% |
| FTSE 100 | 18.09x | ~13-15x | +29% |
| Nikkei 225 | 21.64x | ~20-22x | +3% |
| MSCI EM | 17.42x | ~13-15x | +24% |
(†) Hist avg trailing P/E: static long-run reference constants, not live data. Live trailing P/E from yfinance trailingPE on ETF proxies (SPY, QQQ, EXSA.DE, CAC.PA, EXS1.DE, ISF.L, 1321.T, EEM). Premium computed against the midpoint of the historical range. Bold marks a premium above 20%.
The S&P 500 at 52% above its long-run average trailing P/E is in historically stretched territory by the >40% threshold. Note the ordering oddity: the Nasdaq 100 carries a lower premium than the S&P 500, because the historical reference for a growth index is already high. That does not make the Nasdaq cheap in absolute terms at 30.33x; it means the S&P has moved a long way toward growth-index valuations without a growth-index reference to justify it.
Investment Risk Assessment for ETF Investors
United States (S&P 500 / Nasdaq ETFs)
SPY's trailing P/E of 25.78x gives an earnings yield of (1÷25.78) = 3.88%. Against the 10-year Treasury at 4.79% (US Treasury par curve, 2026-09-01), the earnings yield gap is -0.91 pp: on today's quoted prices, the Treasury pays more current income than the index earns. Against the 10-year TIPS real yield of 2.44% (US Treasury real curve, 2026-09-01), the same comparison is +1.44 pp in equities' favour, and that 2.35 pp swing is exactly the inflation correction discussed below. This is a statement about today's trade-off, not a forecast. The Nasdaq 100's earnings yield of 3.30% leaves a gap of -1.49 pp.
The macro backdrop is the harder part. A real 10-year yield of 2.44% is a high discount rate to apply to long-duration earnings, and it has been rising, not falling. The S&P is 1.92% below its all-time high and above both moving averages, so nothing is breaking, but the combination of a 52% valuation premium and a negative nominal earnings yield gap leaves thin margin for error. Concentration risk in the US mega-cap AI complex remains the specific vulnerability, and today's Asian semiconductor selloff is a reminder that the same trade is held globally: the Kospi fell 4% on it while the Nasdaq closed the gap only partly.
Europe (STOXX 600 / CAC 40 / DAX ETFs)
EXSA.DE's 17.80x gives an earnings yield of (1÷17.80) = 5.62%. Against the German 10-year Bund at 3.39% (web search), the euro earnings yield gap is +2.23 pp; against the ECB AAA 10-year at 3.36%, it is +2.26 pp. Both are comfortably positive, in contrast to the negative US figure, and European valuation premiums are far more modest at 11% to 17% above long-run averages.
Part of that difference is not risk compensation at all: it is the gap between the two currencies' inflation and policy paths. The real-yield version is the check. The euro real 10-year is 1.32% against the US 2.44%, so on a real basis the euro earnings yield gap is 5.62 − 1.32 = +4.30 pp against the US +1.44 pp. Europe still looks better after the correction, and by more, not less, which tells you the advantage here is genuinely a real-rate and valuation story rather than an inflation illusion. The decomposition below makes the point precisely.
The risks are the familiar ones and they have got louder. French fiscal politics is being priced directly in the OAT, at 4.21% and an 85 bp spread to Bunds, and a euro-area long end at 15-year highs raises the discount rate on European equities just as it does on American ones. On currency: a euro-based investor holding EUR-quoted European funds has no FX effect on the quoted value of the holding, but the earnings underneath are substantially foreign. CAC 40 and STOXX 600 constituents are multinationals, so the exposure is smaller, slower and partly offset by foreign cost bases, not absent.
Japan (Nikkei / TOPIX ETFs)
The Nikkei at 21.64x is the one index in the table trading essentially in line with its own history, a 3% premium. Today's 2.85% fall takes it 11.68% below its all-time high and below its 50-day average. The dominant variable now is policy: the BOJ held at 1% on 31 July, Governor Ueda has signalled a September move, and the board meets on 17 and 18 September with the yen near 160. For a euro or dollar investor the hedge decision may matter more than the equity call. An unhedged position has been carried by yen weakness; a BOJ hike that finally puts a floor under the currency would reverse that contribution while simultaneously raising the domestic discount rate.
Emerging Markets (MSCI EM ETFs)
EEM at 17.42x is 24% above its long-run average, which erodes the traditional EM valuation discount to developed markets considerably; against the S&P's 25.78x the discount is real but no longer wide. EEM held up today, closing up 0.57%, even as its largest Asian constituents fell, which reflects the dollar-denominated ETF wrapper and index composition rather than resilience in the underlying markets. China remains the largest single weight and the Shanghai Composite fell 0.97% and sits below its 200-day average. A firm dollar, which is what a risk-off oil shock produces, is historically the least helpful backdrop for the asset class.
Overall Risk Score (qualitative, not financial advice): - United States: high valuation risk, low margin of safety. A 52% premium to historical average P/E combined with a negative nominal earnings yield gap and a rising real yield. - Europe: moderate. Fair-to-slightly-rich valuations with a genuinely positive earnings yield gap, offset by a fiscal-driven bond selloff and French political risk. - Japan: moderate. Valuation is the least stretched in the table; policy and currency risk are concentrated into a two-week window. - Emerging markets: moderate. The valuation discount has narrowed while the dollar and oil are both moving the wrong way.
Disclaimer: This is financial information, not personalised investment advice. Past valuations do not guarantee future returns. Consult a financial advisor before investing.
US Economic Indicators (FRED - authoritative)
| Indicator | Current | Prior | Delta | Reference Date | FRED Series |
|---|---|---|---|---|---|
| CPI YoY % | 3.30% | — | — | Jul 2026 | CPIAUCSL |
| Core CPI YoY % | 2.47% | — | — | Jul 2026 | CPILFESL |
| Unemployment Rate | 4.1% | — | — | Jul 2026 | UNRATE |
| Nonfarm Payrolls | 158,858k | 158,881k | -23k | Jul 2026 | PAYEMS |
| 10Y TIPS Real Yield | 2.44% | — | — | 2026-09-01 | DFII10 (US Treasury real curve) |
Note: FRED macro data is monthly and lags four to six weeks; the reference month is shown above. The July payrolls print is a net loss of 23,000 jobs month over month, which alongside headline CPI running at 3.30% against core at 2.47% describes a labour market that is cooling while the inflation gap between headline and core is being widened by exactly the energy prices that moved again today.
Other economic releases today (from web search): the US calendar carried the ADP employment report for August at 08:15 ET, factory orders and final durable goods orders for July at 10:00 ET, and the Fed's Beige Book at 14:00 ET. The Bank of Canada announced a rate decision at 09:45 ET. Actual prints against consensus are not covered here, so no surprise assessment is offered.
Fixed Income & Bond Analysis
Policy Rates
| Central Bank | Rate | Source |
|---|---|---|
| Fed Funds (upper) | 3.75% | FRED DFEDTARU (2026-09-02) |
| Fed Funds (lower) | 3.50% | FRED DFEDTARL (2026-09-02) |
| Effective FFR | 3.63% | FRED DFF (2026-08-31) |
| ECB Deposit Rate | 2.25% | FRED ECBDFR (2026-09-02) |
| BOJ Policy Rate | 1.00% | web search (held 31 Jul 2026) |
| BOE Bank Rate | ~3.73% | FRED IUDSOIA (SONIA proxy, 2026-08-28) |
Government Bond Yields
| Country | 2Y Yield | 10Y Yield | 30Y Yield | Day Chg (10Y) | Source |
|---|---|---|---|---|---|
| USA | 4.39% | 4.79% | 5.27% | +4 bp | US Treasury par curve (2026-09-01) |
| Germany | 3.01% | 3.39% | 3.84% | — | web |
| France | — | 4.21% | — | — | web |
| UK | — | 5.21% | — | — | web (1 Sep) |
| Japan | — | 3.02% | — | +2 bp | web |
| Italy | — | 4.17% | — | — | web |
The US row is one date throughout: all three maturities and the day change come from the Treasury par curve for 1 September, with the change measured against the 31 August curve. This is settled data and will not match the intraday move the press describes today. The 2-year rose 5 bp and the 30-year 2 bp on the same session, so the move was a bear flattening at the very long end and a bear steepening in the belly.
The UK is the table's outlier and it is not close: a 10-year gilt at 5.21% is 42 bp above the equivalent Treasury and 182 bp above the Bund. Japan's 10-year at 3.02% would have been unthinkable for most of the past two decades and is the quiet structural story underneath the BOJ's September decision.
Yield Curve Spreads:
- 10Y-2Y spread: +40 bps (US Treasury par curve, 2026-09-01). Positive and upward-sloping, but shallow. This is not an inverted curve and it is not a steep one either; it sits between the conventional flat band of ±25 bp and the ~75 bp that would count as genuinely steep.
- 10Y-3M spread: +87 bps (US Treasury par curve, 2026-09-01). Comfortably positive, so the classic recession signal is not firing.
What the pair says together is that the market has stopped pricing aggressive near-term easing. The 3-month bill at 3.92% sits about 30 bp above the Fed funds target midpoint of 3.625%, which is the front end declining to price cuts on the horizon the funds rate implies. The steepening this summer has come from the long end selling off rather than from the front end rallying, which is a term-premium and supply story rather than a growth story.
OAT-Bund Spread: approximately 85 bp on web-sourced figures (10-year France minus Germany). This remains the cleanest live gauge of French fiscal risk, and with the OAT at its highest yield since November 2008 it is being paid attention to. For context, Italy's 10-year at 4.17% is below France's 4.21%, an inversion of the traditional ordering that says a good deal about where the market currently locates euro-area fiscal risk.
Yield Curve Charts
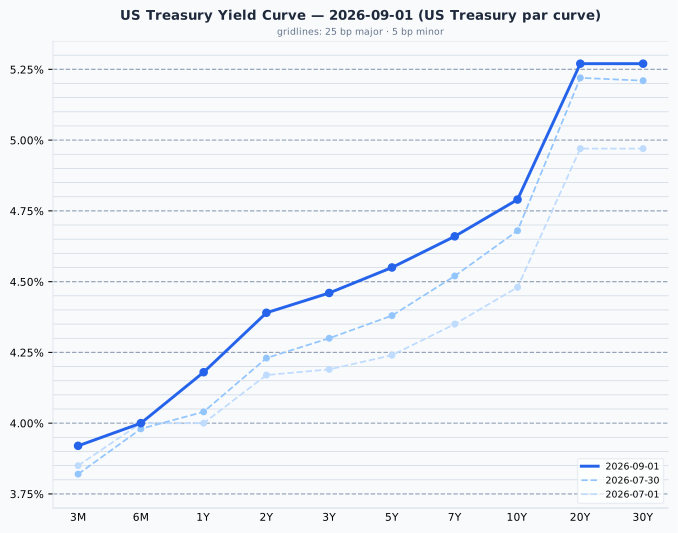
The US curve is upward-sloping throughout with a pronounced steepening beyond ten years, the 30-year sitting 48 bp above the 10-year. Against a month ago the whole curve has shifted up, and unevenly: the 2-year is 16 bp higher, the 10-year 11 bp, but the 30-year only 6 bp, so the belly and front have done most of the repricing while the long end was already elevated.
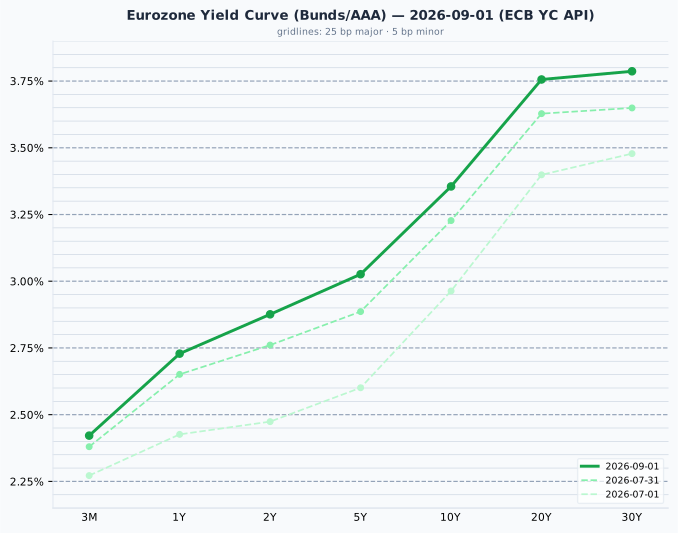
The euro AAA curve is also upward-sloping and shallower than the US one at the front, with a 10Y-2Y spread of 48 bp and a further 43 bp from 10 to 30 years. The shift here has been more forceful at the long end than in the US: the AAA 10-year is 13 bp above its level a month ago and 39 bp above its level two months ago, and the 30-year is up 14 bp on the month. That is the 15-year-high selloff showing up in the curve's shape rather than just its level.
Credit Markets (from FRED - authoritative)
| Market | OAS Spread | Series ID |
|---|---|---|
| US Investment Grade | 81 bps | BAMLC0A0CM (2026-09-01) |
| US High Yield | 265 bps | BAMLH0A0HYM2 (2026-09-01) |
| Euro High Yield | 260 bps | BAMLHE00EHYIOAS (2026-09-01) |
All three are historically tight. US high yield at 265 bp is below the 300 to 500 bp range that counts as normal, and investment grade at 81 bp is at the very bottom edge of its 80 to 150 bp normal band. Euro high yield at 260 bp is tighter still relative to its own history.
The interpretation matters on a day like this one. Credit is showing no stress whatsoever while equities in Asia fell 3% to 4% and government bond yields hit multi-year highs. That divergence says the market is treating today as a rates and energy shock rather than a solvency or growth scare. It also means credit offers very little cushion: at 265 bp, high yield is compensating investors thinly for default risk, and spreads this tight have historically had far more room to widen than to compress.
Real Yields (US and Euro Area)
| Region | Nominal 10Y | Expected inflation | Real 10Y | How the real yield is obtained |
|---|---|---|---|---|
| United States | 4.79% | 2.35% (residual) | 2.44% | Measured. TIPS trade, so the market quotes a real yield directly; expected inflation is the residual, the breakeven |
| Euro area | 3.36% | 2.04% (measured) | 1.32% (residual) | Constructed. No euro inflation-linked benchmark is published, so a survey expectation is subtracted from the nominal yield |
The two rows are built in opposite directions and only the US real yield is a price anyone actually trades. The euro figure is the softer of the two: it takes the ECB Survey of Professional Forecasters' long-term HICP expectation of 2.04% (2026 Q3) and subtracts it from the AAA nominal 10-year. Two mismatches follow whenever the pair is compared. The US breakeven contains an inflation risk premium that a survey response does not, and the SPF horizon is five years ahead against the bond's ten.
Decomposing the 143 bp nominal gap between the two regions: only 31 bp of it is a difference in expected inflation (2.35% versus 2.04%), and 112 bp is a difference in real rates (2.44% versus 1.32%). This is overwhelmingly a real-rate story, not an inflation story. The split moves with the cycle and is recomputed each session rather than assumed.
⚠️ The US-euro real rate gap is not an investment opportunity
The US real yield has exceeded the euro one in every quarter since 2014. It is a structural feature of higher US trend growth, euro-area excess savings, Bund scarcity and US fiscal supply, and it is not a trade a euro-based reader can capture. Hedging the currency cancels it precisely, because the forward rate is set to remove the interest differential; unhedged, holding Treasuries for the higher real yield is a bet on the dollar rather than a bond decision. A gap of this size persisting for twelve years is the evidence that it is compensation for risk borne by dollar investors, not free return. A real yield is real in its own currency: 2.44% means 2.44% above US inflation, which is not a real return for someone who spends euros.
Bond Portfolio Implications
The headline answer today is yes, on current income. A 10-year Treasury at 4.79% pays more than the S&P 500's 3.88% earnings yield, a gap of -0.91 pp, and a 30-year at 5.27% pays a good deal more than that. In Europe the answer inverts: the STOXX 600's 5.62% earnings yield stands 2.23 pp above the Bund, so European equities still offer more current income than European bonds do.
Two caveats belong with those numbers whenever they carry weight. First, the comparison ignores growth. A bond coupon is fixed for a decade while the earnings behind the equity yield grow roughly with inflation, so the nominal gap understates equities by approximately expected inflation. Stating it against the real yield is the cleaner form, and the size of that correction is the interesting part: for the US it is 2.35 pp, enough to flip the gap from -0.91 pp to +1.44 pp and reverse the conclusion entirely. Second, an equity holder does not receive the full earnings yield in cash. Only the dividend and buyback portion arrives; the remainder is retained and its value depends on what management does with it. The bond coupon has no such conditionality.
The measure describes today's trade-off between two quoted prices and nothing more. It is not a forecast of whether equities will beat bonds, and the forward-looking valuation argument should lean on earnings yield or P/E against its own history, which does carry predictive content, rather than on the gap.
On duration: at current levels a 100 bp rise in yields implies roughly an 8% to 9% price loss on a 10-year bond and materially more on a 30-year. With the long end at 15-year highs in Europe and the US 30-year at 5.27%, that cuts both ways. The yield cushion is the largest it has been in a decade and a half, which means a given yield rise now takes longer to overwhelm the coupon, but the long end has also been the source of every adverse surprise this summer. The front end, where the 2-year yields 4.39% and the 3-month bill 3.92%, offers most of the income with a fraction of the duration risk, which is why the shallow 40 bp of term premium between 2 and 10 years is currently a hard thing to get paid for.
Currencies & Commodities
Currencies:
| Pair | Rate | Source |
|---|---|---|
| EUR/USD | 1.1598 | FRED DEXUSEU (2026-08-28) |
| USD Index | 118.75 | FRED DTWEXBGS (2026-08-28) |
| USD/JPY | 160.27 | web search |
| GBP/USD | 1.3507 | web search |
| USD/CHF | 0.8125 | web search |
The FRED currency observations are from 28 August and are therefore several sessions stale, which is worth flagging on a day when the dollar was reported bid on the risk-off move. The web-sourced pairs are contemporaneous. USD/JPY at 160.27 is the number that matters most: it is the level that has drawn official commentary and is a principal reason the BOJ is expected to move this month.
Commodities (all from front-month futures):
| Commodity | Price | Day Chg % | Ticker | Source |
|---|---|---|---|---|
| Brent Crude | 95.24 | +0.62% | BZ=F | yfinance |
| WTI Crude | 90.62 | +0.44% | CL=F | yfinance |
| Gold ($/oz) | 4,434.10 | +0.86% | GC=F | yfinance |
| Silver ($/oz) | 65.92 | +0.84% | SI=F | yfinance |
| Copper ($/lb) | 6.606 | +0.08% | HG=F | yfinance |
| Nat Gas ($/MMBtu) | 2.990 | +2.96% | NG=F | yfinance |
Day changes are last trade (2 September, 16:25 ET) vs the prior session's settlement (1 September). Today's settlements had not yet published, so the commodity rows are last-trade figures rather than closing figures.
Crude is the day's engine, though both contracts gave back part of their gains into the US afternoon. Brent's last trade at $95.24 is 24.47% below its 52-week high of $126.10, in a 52-week range of $58.72 to $126.10, and WTI at $90.62 sits 24.15% below its own 52-week high of $119.48. Both contracts last set all-time highs in July 2008, far too long ago for a distance-from-record figure to describe anything actionable. The generic contracts are pointing at October WTI (CLV26, expiring 22 September) and November Brent (BZX26, expiring 1 October), so no roll discontinuity is imminent.
Gold's last trade is $4,434.10, which is 20.62% below its all-time high of $5,586.20, set on 29 January 2026. Silver at $65.92 is 45.66% below its all-time high of $121.30, from the same January date. Both records are recent enough to be meaningful comparisons, and both metals are a long way beneath them: today's modest gains do not change a picture in which the precious metals sold off hard from a January peak and have not recovered. That silver has fallen roughly twice as far as gold from the same peak is the usual pattern, silver being the higher-beta of the pair.
Copper is the exception and the one genuinely stretched commodity here. At $6.606 per pound it is slightly below its all-time high of $6.75, set on 26 August 2026, just a week ago. Natural gas was the day's largest percentage mover at $2.990, up 2.96%, though it remains near the bottom of a 52-week range of $2.483 to $7.827, and its 2005 record is not a useful reference point.
Crypto: no crypto moves are covered today.
Sector & Theme Highlights
The clearest sector signal today is the split between energy and semiconductors. A Brent print above $95 on renewed US-Iran fighting is directly accretive to producers and directly punitive to energy-intensive manufacturing and to transport, and the fact that the US indices rose while Asia fell is at least partly index composition: the S&P carries the producers, the Kospi and the Nikkei carry the chipmakers that led the selling.
Three cross-market themes are doing the work:
- The AI and semiconductor trade is global and correlated. Today it was sold in Seoul and Tokyo hardest, with the Kospi down 4% and the Nasdaq 100 up only 0.23% against a 0.46% gain for the broader S&P. The relative weakness of the Nasdaq within a positive US session is the same trade showing through.
- Term premium is the dominant fixed income theme, not inflation. The euro-area long end at 15-year highs, the OAT at a 2008 high, gilts above 5.2% and the US 30-year at 5.27% are a coordinated repricing of the cost of holding duration, and the real-rate decomposition above confirms only 31 bp of the US-euro gap is about inflation expectations.
- Energy security is back as a pricing input. The move in crude is geopolitical rather than demand-driven, which is why it coincided with a dollar bid and higher yields rather than the growth-optimism pattern that usually accompanies rising oil.
Top Stories (Global)
- Renewed US-Iran fighting pushed crude above $95 a barrel, triggering a broad risk-off session across Asia, driving government bond yields higher and sending investors into the dollar. This is the day's single dominant driver.
- Asian equities sold off hard on technology and semiconductors. The Kospi fell 3.99% and the Nikkei 225 2.85%, with press estimates putting roughly ¥31.8 trillion (about $202 billion) of value erased from Japanese stocks in one session.
- European government bond yields extended their selloff to 15-year highs, with the German 10-year Bund above 3.3% for the first time since May 2011 on web-sourced figures.
- The French 10-year OAT traded above 4.21%, its highest since November 2008, keeping the OAT-Bund spread near 85 bp and leaving France yielding more than Italy at the 10-year point.
- BOJ Governor Ueda hinted at a September rate hike with the yen near 160, ahead of the policy meeting on 17 and 18 September. The bank held at 1% on 31 July and market pricing has moved heavily toward a move this month.
- The Bank of Canada delivered a rate decision at 09:45 ET. The outcome is not covered here.
- US data flow was heavy but unquantified here: ADP employment for August, July factory orders and final durable goods, and the Fed's Beige Book all landed during the session. Actual figures against consensus are not covered here.
Looking Ahead
Central banks - BOJ policy meeting, 17 and 18 September. The most heavily anticipated event on the near horizon. Governor Ueda has signalled a hike is live, the yen is near 160, and core inflation is expected to exceed 2% from September. - Bank of Canada decision delivered today; watch for the accompanying guidance in the coming sessions. - Fed and ECB commentary in the wake of a global long-end selloff will be closely parsed, particularly any reference to term premium or to the pace of balance sheet runoff.
Economic releases - US non-farm payrolls for August, due Friday 4 September, is the week's main event, and it follows a July print that showed a net loss of 23,000 jobs. - Euro-area and US final PMI readings and the usual weekly US claims data through the rest of the week.
Geopolitical - The US-Iran situation is the single largest source of near-term price risk, and the oil market's reaction function is currently asymmetric: further escalation moves crude far more than de-escalation would retrace it. - French budget politics remains the driver of the OAT and, by extension, of the euro-area risk tone.
Market closures - Monday 7 September: United States (Labour Day), Canada (Labour Day) and Brazil (Independence Day). US and Canadian markets closed; expect thin liquidity in the Friday session ahead of it. - No closures are scheduled in the UK, Germany, France, Japan, Australia, Switzerland or South Korea in the next fourteen days. - India: no holiday data was available for 2026, so Indian closures are not covered here.