2026 09 10
Global Financial Briefing — Thursday, 10 September 2026
Americas index levels, commodities and day changes reflect the 10 September closing print; US Treasury figures, the curve spreads and the US yield curve chart use Treasury's settled 10 September par curve, and Oracle's after-close results are included. FX, credit, the VIX, policy rates, the euro area bond rows and the ECB curve chart are dated inline.
Market Overview
The ECB raised its deposit rate 25 bp to 2.50% today, the second hike of 2026, and the market's reaction told you the decision was never the point. Christine Lagarde called the move a "no brainer", said the energy shock could intensify and that second-round effects on wages and other prices could be larger than the bank had assumed, and declined to discuss the future path at all. Traders took that as licence: pricing for further ECB hikes through April 2027 rose to 60 bp from 51 bp before the announcement, another move is now priced by December, and the 10-year Bund pushed through 3.45% and was quoted at 3.48% to 3.50% by the afternoon, its highest since April 2011. The new staff projections put euro area inflation at 3.0% this year, 2.5% in 2027 and 2.1% in 2028, with growth nudged up to 0.9% for 2026. August HICP was 3.3% with energy at +14.3%, but core was 2.4% and services 3.0%, which is the ECB's dilemma in one line: the shock is almost entirely energy, and the bank is raising rates against it anyway to stop it spreading.
The oil market gave it every reason to. Iran claimed its largest wave of attacks on shipping since the war began, around ten vessels in and around the Strait of Hormuz, alongside Houthi strikes on Saudi assets, and crude did what it did after Tuesday's tanker strikes but harder: Brent traded as high as $107.04 and settled at $107.63, up 6.34% on the prior settlement, with WTI settling at $102.48, up 6.69%, back above $100. Underneath the headlines the supply picture is deteriorating in a more durable way. Saudi output fell to 6.24 mn b/d in August, the lowest since 1990 and down 1.9 mn b/d, Chinese imports rebounded 6.2% in the month and the US Strategic Petroleum Reserve is at record lows. Two weeks ago the oil market was pricing a threat; this week it is pricing a shortage.
The US absorbed all of that through the bond market rather than the equity market. August PPI printed 5.4% year on year against 5.3% expected, core PPI 4.6% and the highest since June, and the CME FedWatch probability of a 25 bp hike at next week's FOMC moved to roughly 70% to 74% from 62% before the data. The 10-year Treasury settled at 4.95%, +12 bp on the day (US Treasury par curve, 10 September), its highest since 2023; the 30-year settled at 5.37%, +9 bp, within sight of its 2007 peak; the 5-year was the worst-hit point at 4.75%, +14 bp, and the 2-year rose 13 bp to 4.56%, a move led by the belly and the front end that says the market is repricing the Fed rather than the term premium. Against that the S&P 500 closed down 0.58% at 7,591.70, a fourth straight loss and the longest run since March, with the Nasdaq 100 off 1.08% and the Dow off 0.60%; the selling picked up in the afternoon, as the midday print had shown the S&P down only 0.49%. Europe fell again, the STOXX 600 down 0.69% to 635.97, near two-month lows, with miners down 3.9% as copper collapsed and energy up 0.7% near a record; Asia had taken the oil move first, the Hang Seng down 1.27% and the ASX 200 down 1.03%. The other story of the day is in metals: copper settled 4.95% lower at $6.5475/lb after a Reuters report that the White House is reconsidering the 15% refined-copper tariff due in January, silver dropped 5.4% and gold 1.2%. The VIX at 16.46 (FRED VIXCLS, 9 September) is moderate; US high yield at 271 bp and investment grade at 81 bp are still historically tight. Credit and volatility have watched a fortnight of oil, rates and now a central bank hiking into an energy shock and moved a handful of basis points. That is either resilience or the last thing to reprice.
Global Indices Snapshot
Americas
| Index | Level | Day Chg | Day Chg % | Source |
|---|---|---|---|---|
| S&P 500 | 7,591.70 | -44.66 | -0.58% | yfinance ^GSPC |
| Nasdaq 100 | 29,103.51 | -318.04 | -1.08% | yfinance ^NDX |
| Dow Jones | 52,064.10 | -316.56 | -0.60% | yfinance ^DJI |
| Brazil IBOV | 188,268.60 | +2,639.55 | +1.42% | yfinance ^BVSP |
Americas data reflects the 10 Sep close. FRED's SP500 series independently reports the S&P 500 close for 10 September at 7,591.70, matching the figure above to the cent. The Bovespa was the one major index to rise: a commodity-exporter index on a day crude gained six dollars, with Petrobras the obvious beneficiary, and it extended its gain into the close.
Europe
| Index | Level | Day Chg | Day Chg % | Source |
|---|---|---|---|---|
| Euro STOXX 600 | 635.97 | -4.44 | -0.69% | yfinance ^STOXX |
| CAC 40 | 8,116.76 | -39.91 | -0.49% | yfinance ^FCHI |
| DAX | 25,361.15 | -215.30 | -0.84% | yfinance ^GDAXI |
| FTSE 100 | 10,608.92 | -61.14 | -0.57% | yfinance ^FTSE |
| SMI (Swiss) | 13,740.10 | -64.60 | -0.47% | yfinance ^SSMI |
European data reflects today's cash close (10 Sep). The Euro STOXX 50 closed at 6,268.97, down 0.67%. For the CAC 40, DAX, FTSE 100 and SMI, yfinance's previousClose field lags a session and disagrees with price − change; the day changes shown reconcile exactly with the 9 September closes published yesterday (8,156.67, 25,576.45, 10,670.06 and 13,804.70), so it is the change fields that are right. Over two sessions the CAC 40 has lost 2.4%, the DAX 2.5% and the SMI 2.3%.
Asia-Pacific
| Index | Level | Day Chg | Day Chg % | Source |
|---|---|---|---|---|
| Nikkei 225 | 65,270.95 | +128.17 | +0.20% | yfinance ^N225 |
| Hang Seng | 24,954.47 | -320.49 | -1.27% | yfinance ^HSI |
| Shanghai Comp | 3,934.40 | -17.10 | -0.43% | yfinance 000001.SS |
| ASX 200 | 8,819.40 | -92.00 | -1.03% | yfinance ^AXJO |
| Kospi (Korea) | 7,033.92 | -17.72 | -0.25% | yfinance ^KS11 |
Asia-Pacific data reflects today's close (10 Sep). The Hang Seng's previousClose field also lags a session; the change shown reconciles with yesterday's published close of 25,274.96. The Hang Seng Tech sub-index fell more than 2%. The Hang Seng is now below 25,000 and below both its 50- and 200-day averages; the Nikkei's gain was the region's exception and leaves it 10% below its record.
Emerging Markets
| Index | Level | Day Chg % | Source |
|---|---|---|---|
| MSCI EM (EEM) | 67.00 | -2.16% | yfinance EEM |
| India Nifty 50 | 23,477.80 | +0.20% | yfinance ^NSEI |
| South Africa | 69.54 | -2.48% | yfinance EZA |
EEM and EZA are USD-denominated ETF proxies and now reflect the 10 September NYSE close. Both fell further into the close and finished well behind the S&P 500: EEM carries the Hong Kong and Korea weight plus a dollar that firmed on the yield move, and EZA is a mining-heavy index on the day copper fell 5%. The Nifty 50 is a settled 10 September close; its previousClose also lags a session and the change reconciles with yesterday's 23,431.50.
Index Valuations & Investment Risk
Valuation Table
| Index | Trailing P/E (live) | Hist avg trailing P/E (†) | Premium / discount to midpoint |
|---|---|---|---|
| S&P 500 | 24.51x | ~16-18x | +44% |
| Nasdaq 100 | 28.96x | ~25-30x | +5% |
| Euro STOXX 600 | 17.51x | ~15-17x | +9% |
| CAC 40 | 16.66x | ~14-16x | +11% |
| DAX | 18.36x | ~15-17x | +15% |
| FTSE 100 | 17.83x | ~13-15x | +27% |
| Nikkei 225 | 21.96x | ~20-22x | +5% |
| MSCI EM | 14.31x | ~13-15x | +2% |
(†) Hist avg trailing P/E: static long-run reference constants, not live data. Trailing P/E (live): yfinance trailingPE on ETF proxies (SPY, QQQ, EXSA.DE, CAC.PA, EXS1.DE, ISF.L, 1321.T, EEM), as of 10 September 2026 at 17:59 CEST. The US-listed proxies (SPY, QQQ, EEM) were priced during the US session at that time; at the 10 September close each differed by less than 1% (SPY 24.49x, QQQ 28.89x, EEM 14.25x), so the table stands. Bold marks a premium above 20% to the historical midpoint.
The multiples have compressed a little on two down sessions but the ranking has not changed. The S&P 500 at 24.5x is the only index that is historically stretched on this measure; everything in Europe sits within 15% of its own long-run range, and the FTSE 100 at 17.8x is the one European index that has drifted well above its history, more because its earnings base has shrunk than because its price has run.
Investment Risk Assessment for ETF Investors
United States (S&P 500 / Nasdaq ETFs)
The S&P 500 at 7,591.70 is 2.9% below its record of 7,816.70 and, after four down sessions, has closed fractionally below its 50-day average (7,604) for the first time in this run; it remains 6.1% above the 200-day (7,157) and in the upper part of a 6,316.91 to 7,816.70 52-week range. The Nasdaq 100 is 5.4% below its own record and closed a fraction below its 50-day (29,206).
The earnings yield on SPY is (1÷24.51) = 4.08%, against a settled 10-year Treasury of 4.95% (US Treasury par curve, 10 September): an earnings yield gap of −0.87 pp, the widest negative reading of the summer, and 12 bp wider than yesterday's −0.75 pp because the whole of the move came from the bond side. On the real-yield version, 4.08% less the 10-year TIPS yield of 2.55% (US Treasury real curve, 10 September) gives +1.53 pp, so the ~2.4 pp inflation correction still flips the sign, as it has all summer. See the note under Bond Portfolio Implications for what this comparison does and does not tell you: it describes today's trade-off between a bond coupon and an equity earnings stream and forecasts nothing. The Nasdaq 100 earnings yield is (1÷28.96) = 3.45%, 1.50 pp below the nominal 10-year.
Today's specific risk is that the market is now assigning a 70% probability to a Fed hike next week, with 5-year yields up 14 bp on the day. An index on 24.5x trailing earnings whose concentration sits in long-duration AI capex names is the asset most exposed to a rising real discount rate, and DFII10 settled at 2.55%, up 9 bp on the day and 14 bp from 2.41% a month ago. The fact that the index lost only 0.58% on a day of that size says the equity market still believes earnings, particularly technology earnings, will carry it, and Oracle's results after the close made that case for it: revenue of $19.35bn and adjusted EPS of $1.92 both beat, cloud infrastructure revenue rose 121% to $7.4bn, full-year revenue guidance was set at $90bn or more, and the shares rose as much as 7% in extended trading after closing the regular session at $152.94.
Europe (STOXX 600 / CAC 40 / DAX ETFs)
The STOXX 600 earnings yield is (1÷17.51) = 5.71%, against the ECB AAA 10-year of 3.43% (ECB YC API, 9 September): a euro earnings yield gap of +2.28 pp, comfortably positive where the US is negative. The web-sourced Bund at 3.48% to 3.50% today would trim that by a few basis points. Against the constructed euro real 10-year of 1.39% (AAA nominal 3.43% less the ECB SPF long-term HICP expectation of 2.04%, 2026 Q3 round) the real gap is +4.32 pp.
Part of the 3 pp difference between the US and euro nominal gaps is simply the difference between the two currencies' inflation and policy paths rather than a difference in risk compensation. Decomposed, today's 152 bp nominal gap between the 10-year Treasury (4.95%, settled 10 September) and the euro AAA 10-year (3.43%, 9 September) is 36 bp of expected inflation (US breakeven 2.40% vs SPF 2.04%) and 116 bp of real rates (2.55% vs 1.39%). The real-yield component has narrowed from 130 bp a month ago because the euro real yield has risen faster than the US one, which is what an ECB hiking cycle does, though today's 9 bp jump in the US real yield took back some of that narrowing; the euro leg is a day behind and the ECB's own decision has not yet reached it. See Real Yields below for why the euro figure is the softer of the two.
The relative valuation case for Europe remains intact on the numbers (a 29% P/E discount to the S&P 500 on 17.5x against 24.5x), but the direction of travel this week is the risk case, not the value case: the euro area is the region importing the energy shock, its central bank is hiking into it, and its index is weighted toward the industrials, banks and miners that a rising-rate energy shock hits first. The CAC 40 is now 7.3% below its record and 3.9% below its 50-day average; the DAX is 4.7% below its record. For a euro-based investor there is no currency effect on the quoted value of a EUR-denominated fund, but the exposure lives inside the earnings: CAC 40 and STOXX 600 constituents earn a large share of revenue abroad, so this is a smaller and slower currency exposure rather than none.
Japan (Nikkei / TOPIX ETFs)
The Nikkei at 65,270.95 is 10.4% below its record of 72,831.73 and below its 50-day average (66,347), though well above the 200-day (59,199). At 21.96x trailing it sits within its historical range. The BOJ meets on 17 to 18 September with a move to 1.25% widely expected, the highest in roughly 31 years, and an adviser to the prime minister has said a further hike is likely by January; the 10-year JGB at 2.92% is off the 3.00% it touched on 1 September, a 1996 level. With the yen at 153.38 a euro-based investor's hedging decision still dominates the equity call, and the cost of that hedge falls as the BOJ closes the rate gap.
Emerging Markets (MSCI EM ETFs)
EEM at 14.31x is fairly valued against its own history and carries a 42% discount to the S&P 500. It fell 2.16% today with the Hang Seng and a firmer dollar, weakening into the close, and sits 6.4% below its 52-week high of $71.57. China's August PPI at 3.8% year on year (3.6% expected) is commodity-driven rather than demand-driven, and BofA trimmed its 2027 and 2028 China growth forecasts to 4.2% and 4.0% on weak domestic demand. The Kospi, the standout of 2026, is 25% below its record. EM is the region where an oil-price shock and a rising dollar arrive together, and the ETF's 2.2% loss on a day the S&P lost 0.6% is that sensitivity showing.
Overall Risk Score (qualitative, not financial advice): - US: high valuation risk / low margin of safety. 24.5x trailing, a negative nominal earnings yield gap that widened to −0.87 pp, a 10-year settled at a three-year high of 4.95% and a Fed that may hike next week. - Europe: moderate, deteriorating. Fair-to-modest premium on valuation and a positive earnings yield gap, but the region is on the wrong side of the energy shock and the ECB has just hiked into it. - Japan: moderate. Fair valuation, but a BOJ hike next week and a currency call that dominates. - EM: moderate. Attractive relative valuation, offset by oil, dollar and China growth risks that all pointed the same way today.
Disclaimer: This is financial information, not personalised investment advice. Past valuations do not guarantee future returns. Consult a financial advisor before investing.
US Economic Indicators (FRED - authoritative)
| Indicator | Current | Prior | Delta | Reference Date | FRED Series |
|---|---|---|---|---|---|
| CPI YoY % | 3.30% | — | — | Jul 2026 | CPIAUCSL |
| Core CPI YoY % | 2.47% | — | — | Jul 2026 | CPILFESL |
| Unemployment Rate | 4.1% | — | — | Aug 2026 | UNRATE |
| Nonfarm Payrolls | +162k | — | monthly chg | Aug 2026 | PAYEMS |
| 10Y TIPS Real Yield | 2.55% | 2.41% (5 Aug) | +14 bp | 10 Sep 2026 | DFII10 (US Treasury real curve) |
The FRED series give the latest observation and the year-on-year rate but not the prior month's rate, so the Prior and Delta cells for the monthly series are left blank rather than filled from memory. July CPI is the latest available; August CPI is due tomorrow. The TIPS prior is the 5 August observation from the 7 August briefing.
Other economic releases today (web search):
| Release | Actual | Consensus | Prior | Reaction |
|---|---|---|---|---|
| US PPI, Aug, m/m | +0.4% | +0.4% | — | In line |
| US PPI, Aug, y/y | 5.4% | 5.3% | 4.8% | Hotter; Fed hike odds rose to ~70% |
| US core PPI, Aug, m/m | +0.2% | +0.3% | — | Softer |
| US core PPI, Aug, y/y | 4.6% | 4.6% | 4.3% | In line, highest since June |
| US initial jobless claims (w/e 5 Sep) | 206k | 205k | 207k | In line; continuing claims 1.774M |
| US existing home sales, Aug | 3.98M | 3.98M | — | In line, −2% m/m; inventory 4.9 months, most since 2015 |
| US wholesale inventories, Jul | +1.3% | +1.3% | — | In line; sales +0.8% |
| Euro area HICP, Aug (cited by ECB) | 3.3% | — | — | Energy +14.3%; core 2.4%, services 3.0% |
| China PPI, Aug, y/y | 3.8% | 3.6% | 3.5% | Hotter; energy-driven |
The producer-price print is the one that moved markets. A 5.4% headline PPI is the first hard US inflation data to carry the summer's crude move, and it landed on a bond market that had already been pushed higher by the Bund. Tomorrow's CPI (consensus around +0.4% m/m, 3.4% y/y headline, 2.4% core) is the last major print before the FOMC.
Fixed Income & Bond Analysis
Policy Rates
| Central Bank | Rate | Source |
|---|---|---|
| Fed Funds (upper) | 3.75% | FRED DFEDTARU |
| Fed Funds (lower) | 3.50% | FRED DFEDTARL |
| Effective FFR | 3.63% | FRED DFF (8 Sep 2026) |
| ECB Deposit Rate | 2.50% | ECB decision 10 Sep 2026 (web); FRED ECBDFR still shows 2.25% as of 10 Sep and will update |
| BOJ Policy Rate | 1.00% | web search |
| BOE Bank Rate | ~3.73% | FRED IUDSOIA (SONIA proxy, 8 Sep 2026) |
The ECB's three rates are now 2.50% deposit, 2.65% main refinancing and 2.90% marginal lending. Lagarde said the Governing Council did not debate the future path and would decide meeting by meeting; the market's answer is 60 bp more by April 2027. The Fed decides on 16 September with a hike now the base case at roughly 70% to 74%; the BOJ follows on 17 to 18 September with a move to 1.25% widely expected. Three of the four major central banks in the table are now either hiking or priced to hike within a week, and all of them against the same barrel of crude.
Government Bond Yields
| Country | 2Y Yield | 10Y Yield | 30Y Yield | Day Chg (10Y) | Source |
|---|---|---|---|---|---|
| USA | 4.56% | 4.95% | 5.37% | +12.0 bp | US Treasury par curve (10 Sep 2026) |
| Germany | 2.98% | 3.43% | 3.78% | — | ECB YC API AAA curve (9 Sep 2026) |
| France | — | 4.44% | — | — | web (10 Sep 2026) |
| UK | — | 5.29% | — | — | web (10 Sep 2026) |
| Japan | — | 2.92% | — | +3.2 bp | web (10 Sep 2026) |
| Italy | — | 4.38% | — | — | web (10 Sep 2026) |
The USA row is the settled US Treasury par curve for 10 September, with the day change against the 9 September session (10-year 4.83%). The settled move was larger than the midday quotes had suggested: the 2-year rose 13 bp to 4.56%, the 5-year 14 bp to 4.75%, the 10-year 12 bp to 4.95% and the 30-year 9 bp to 5.37%, with the 3-month bill up 5 bp to 4.00%. The German row is the ECB AAA composite for 9 September, up 5 bp at the 10-year from the 8 September curve. Web-sourced quotes for today put the 10-year Bund at 3.48% to 3.50%, up about 6 bp, its highest since April 2011; a 2-year Bund quote of 3.21% from the same source disagrees with the AAA curve by 23 bp and is not shown. The JGB 10-year rose 3.2 bp to 2.92%, tracking Treasuries; no 30-year JGB was retrieved.
The UK remains the outlier and has moved further out. A 10-year gilt at 5.29% is its highest since August 2007 and 34 bp above the equivalent settled Treasury, up 32 bp in four weeks, with UK natural gas at its highest since late 2022 compounding the crude move. Italy at 4.38% now yields less than France at 4.44%, which has been the case for much of this year and is the single most telling number in the table for a French reader.
Yield Curve Spreads (US Treasury par curve, 10 September 2026): - 10Y-2Y spread: +39 bp. Positively sloped and out of the 2022 to 2024 inversion, but well short of the ~75 bp that would count as steep. The settled move was close to parallel between two and ten years (+13 bp against +12 bp), so the spread narrowed by only 1 bp; the flattening was at the long end, where the 30-year rose 9 bp against the 10-year's 12. - 10Y-3M spread: +95 bp. Wider by 7 bp, because the bill rose only 5 bp. No recession signal from the classic indicator, and none likely while the front end is anchored by a Fed that may be about to hike.
The 20-year settled at 5.39% and the 30-year at 5.37%, so the small inversion between those two points, which had closed on 9 September, is back.
OAT-Bund Spread: roughly 94 bp on today's web quotes (OAT 4.44%, Bund 3.50%, both tradingeconomics, 10 September), against 84.7 bp on 4 September. If that holds it is a widening of nearly 10 bp in a week during which the French 10-year has reached its highest since November 2008, and it means France is bearing more of the euro area's repricing than Germany. Both legs come from a single web source and the spread should be read as approximate until a settled OAT print is available.
Yield Curve Charts
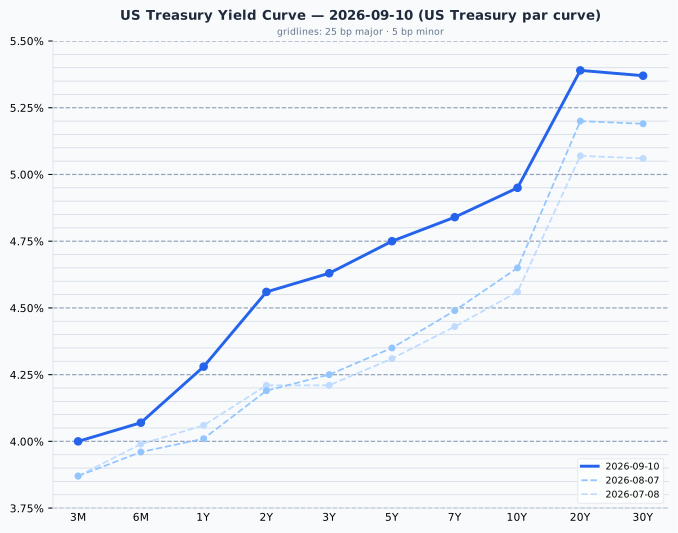
The US curve (US Treasury par curve, 10 September) is positively sloped from 4.00% at three months to 4.95% at ten years and 5.39% at twenty, with the 30-year at 5.37% a fraction below the 20-year. Against the 7 August curve it has shifted up by 27 to 40 bp everywhere from one year to ten (the 2-year up 37 bp, the 5-year 40 bp, the 10-year 30 bp) but only 18 to 19 bp at twenty and thirty years: the month's move has been a repricing of the Fed path, and the long end has lagged it.
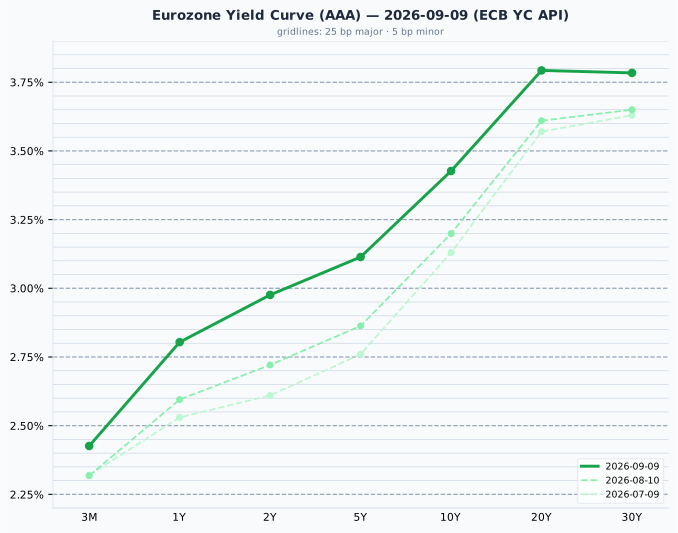
The euro AAA curve (ECB YC API, 9 September) runs from 2.43% at three months to 3.43% at ten years and 3.79% at twenty, with the 30-year a fraction below the 20-year. Against the 10 August curve it is up 11 bp at three months, 25 bp at two years and 23 bp at ten: a near-parallel upward shift concentrated at the front, which is a hiking cycle being priced, and today's decision confirmed it.
Sanity check: the 3-month Treasury at 4.00% sits 38 bp above the Fed Funds midpoint of 3.625%, beyond the usual ~25 bp tolerance but short of the 50 bp anomaly threshold, and consistent with bills pricing a hike next week.
Credit Markets (from FRED: authoritative)
| Market | OAS Spread | Series ID |
|---|---|---|
| US Investment Grade | 81 bp | BAMLC0A0CM (9 Sep 2026) |
| US High Yield | 271 bp | BAMLH0A0HYM2 (9 Sep 2026) |
| Euro High Yield | 266 bp | BAMLHE00EHYIOAS (9 Sep 2026) |
US high yield at 271 bp is historically tight (the normal range is 300 to 500 bp and stress starts above 500), and investment grade at 81 bp sits at the bottom of its 80 to 150 bp range. Both are unchanged to within a few basis points across the fortnight in which Brent has gone through $100 and on to $107. Euro high yield at 266 bp is now tighter than US high yield despite the euro area being the region the shock hurts. Credit is not pricing what the oil market, the Bund market or the ECB are pricing.
Real Yields (US and Euro Area)
| Region | Nominal 10Y | Expected inflation | Real 10Y | How the real yield is obtained |
|---|---|---|---|---|
| United States | 4.95% (US Treasury par curve, 10 Sep) | 2.40% (residual: nominal − real) | 2.55% (US Treasury real curve, 10 Sep) | Measured. TIPS trade, so the market quotes a real yield directly; expected inflation is the breakeven residual |
| Euro area | 3.43% (ECB YC API AAA, 9 Sep) | 2.04% (ECB SPF long-term HICP, 2026 Q3, measured) | 1.39% (residual: nominal − expected) | Constructed. No euro inflation-linked benchmark is published, so a survey expectation is subtracted from the nominal yield |
The two rows are built in opposite directions: the US measures the real yield and infers inflation, the euro area measures inflation and infers the real yield, and only the US figure is something anyone trades. Two mismatches when comparing them: the US breakeven carries an inflation risk premium that a survey does not, and the SPF horizon is five years against the bond's ten. Decomposed, the 152 bp nominal gap between the regions is 36 bp of expected inflation and 116 bp of real rates, still mostly a real-rate story but less so than a month ago (18 bp and 130 bp on 7 August), because the euro real yield has risen 28 bp while the US real yield has risen 14, nine of them today. The euro leg is the 9 September curve and does not yet carry the ECB decision.
A note for euro-based readers: the higher US real yield is a structural feature that has held every quarter since 2014, not an opportunity. Hedged into euros, the forward rate removes the interest differential and the advantage disappears; unhedged, it is a currency bet rather than a bond decision. And a real yield is real in its own currency: 2.55% above US inflation is not a real return for someone who spends euros.
Bond Portfolio Implications
On nominal yields, a 10-year Treasury settled at 4.95% pays 87 bp more than the S&P 500's 4.08% earnings yield; the euro AAA 10-year at 3.43% pays 228 bp less than the STOXX 600's 5.71%. On the real-yield version, both gaps are positive: +1.53 pp in the US and +4.32 pp in Europe. That is the earnings yield gap, not the equity risk premium, which would need a growth estimate the gap deliberately omits; it describes the income available today from each instrument and forecasts nothing about which one wins. Two caveats carry weight: an equity holder receives only the dividend and buyback portion of the earnings yield as cash, and the nominal comparison ignores that earnings grow roughly with inflation while a coupon does not, which is why the real version is the cleaner statement and why the ~2.4 pp correction flips the US sign.
For duration, the arithmetic this week is unforgiving. The 10-year has risen 30 bp on the settled curve in a month, 12 of them today, and a 100 bp rise costs roughly 8 to 9% of price on a 10-year bond. A euro investor who bought the AAA 10-year at 3.20% on 10 August is down about 2% on price in a month. The front end is the safer place to be paid to wait: 4.56% on a 2-year Treasury and 2.98% on 2-year euro AAA paper, in a world where both central banks may still be raising, is a coupon without the duration risk. The case for extending is that 5.37% on the 30-year Treasury and 3.79% on the 20-year euro AAA are the highest long-end yields most investors under 45 have ever been able to buy; the case against is that the last two weeks have shown the top is not in.
Currencies & Commodities
Currencies:
| Pair | Rate | Source |
|---|---|---|
| EUR/USD | 1.1618 | FRED DEXUSEU (4 Sep 2026) |
| USD Index | 118.07 | FRED DTWEXBGS (4 Sep 2026) |
| USD/JPY | 153.38 | web search (10 Sep 2026) |
| GBP/USD | 1.3544 | web search (10 Sep 2026) |
| USD/CHF | 0.8093 | web search (10 Sep 2026) |
The two FRED series are four business days stale. A live EUR/USD quote of 1.1619 mid-morning (web) is essentially unchanged from the FRED figure, so the ECB hike and the Bund move have not translated into a stronger euro against a dollar backed by a 4.9% 10-year and a Fed hike next week. The yen firmed 0.11% to 153.38 and is 3.7% stronger on the month, the BOJ hike trade in progress.
Commodities (all front-month futures):
| Commodity | Price | Day Chg % | Ticker | Source |
|---|---|---|---|---|
| Brent Crude | 107.63 | +6.34% | BZ=F | yfinance |
| WTI Crude | 102.48 | +6.69% | CL=F | yfinance |
| Gold ($/oz) | 4,407.30 | -1.20% | GC=F | yfinance |
| Silver ($/oz) | 64.927 | -5.42% | SI=F | yfinance |
| Copper ($/lb) | 6.5475 | -4.95% | HG=F | yfinance |
| Nat Gas ($/MMBtu) | 2.834 | +0.43% | NG=F | yfinance |
Day changes are settlement to settlement, the 10 September settlement against the 9 September settlement, which is the market convention for a completed session. These are closing figures, not last trades: the contracts traded on for hours after settlement was struck, and their last prints are not the figures shown. Contract months are October for WTI (CLV26, expiring 22 September) and natural gas (NGV26), November for Brent (BZX26) and December for the metals (GCZ26, SIZ26, HGZ26); the front month is unchanged from the original capture, so no roll distorts any day change here.
Crude settled up more than six dollars, the larger of two five-dollar-plus sessions this week. Brent's settlement of $107.63 is 14.6% below its 52-week high of $126.10 and 83.3% above its 52-week low of $58.72; WTI at $102.48 is 14.2% below its 52-week high of $119.48. Both contracts' record prices date from July 2008 and describe a different market, so distance to them carries no useful information. What matters is the composition of today's move: the attacks on shipping are the trigger, but the Saudi production figure (6.24 mn b/d in August, the lowest since 1990), the rebound in Chinese imports and a depleted SPR are the reasons the market treated it as a supply loss rather than a risk premium. The October WTI contract expires on 22 September, so the generic will roll to November in under two weeks; note the discontinuity when it comes.
Copper settled 4.95% lower at $6.5475/lb, which after two consecutive record settlements leaves it 3.8% below its all-time high of $6.8055 set yesterday. The trigger was a Reuters report that the White House is reconsidering the 15% refined-copper import tariff scheduled for 1 January 2027, with a step to 30% in 2028, on affordability grounds. Much of the record run had been positioning for that tariff to pull metal into the US ahead of the deadline, and the unwind was violent: LME copper fell more than 3% to $14,329.50/t, Freeport-McMoRan lost 8% and European miners fell 3.9% as a sector. The structural story (mine supply against grid, data-centre and electrification demand) is unchanged; the tariff premium on top of it has been taken out in a day.
The precious metals both fell, and silver fell like an industrial metal. Silver settled at $64.927, 46.5% below its all-time high of $121.30 (29 January 2026), down 5.42% on the day and giving back more than yesterday's 2.46% gain; it is now well below where it started the month. Gold settled at $4,407.30, 21.1% below its all-time high of $5,586.20 from the same day, down 1.20%, on a session with a six-dollar oil move, an ECB hike and Iranian attacks on ten ships. Both records are inside the last twelve months and coincide with their 52-week highs, so these are real drawdowns from a recent peak. Gold's failure to respond to geopolitical stress for a third session is now a pattern: a 10-year real yield that settled at 2.55%, up 9 bp on the day, and a dollar firming with it, are doing to gold what they always do, and the safe-haven bid is going into the front end of the Treasury curve instead.
Natural gas settled at $2.834, up 0.43%, reversing a 1.3% midday loss, and remains near the floor of its $2.483 to $7.827 52-week range. Henry Hub is a domestic market, insulated from Gulf shipping risk, and the small gain says nothing about crude: it went the opposite way on Tuesday's oil session and merely failed to on this one.
Crypto: no notable moves retrieved.
Sector & Theme Highlights
Best performing: energy, in every region. European energy stocks rose 0.7% and are near a record; the Bovespa was the only major index in the world to rise today, up 1.42% at the close, on the strength of its oil and iron-ore weight; and in China coal, shipping, defence and non-ferrous metal names led. In the US, AeroVironment rose 9% on a first-quarter beat ($0.59 EPS against $0.25 expected), Meta rose about 1% on a JPMorgan upgrade to overweight and the launch of its Muse assistant, and Reddit was the S&P 500's top performer, up 5%. Enbridge is buying Tallgrass Energy's crude business for $2.55bn, and Morgan Stanley upgraded DT Midstream and TC Energy: the pipeline sector is repricing on the assumption that North American crude is worth more with Hormuz shut.
Worst performing: mining and materials, on the copper unwind. European miners fell 3.9% as a sector, the worst on the STOXX 600 by a distance, Freeport-McMoRan lost 8% and South Africa's EZA proxy closed down 2.48%. Hang Seng Tech fell more than 2%. Among US single names, Cooper Cos fell 14% to 18% on a revenue miss, cut guidance and a wave of downgrades, Biohaven 15% on an FDA partial clinical hold, American Eagle 11% on inventory costs, Skillsoft 25% on a guidance cut, and Associated British Foods 9.1% in London on weak Primark sales, its worst day since January. The consumer names are the ones to watch: an energy shock is a tax on the consumer, and the earnings calls this week are starting to say so.
Themes. Three central banks, one barrel. The ECB hiked today, the Fed is 70% priced to hike next Wednesday and the BOJ is expected to hike the day after, all responding to the same energy shock, and the bond market has been pricing this for a fortnight while credit and volatility have not. The tariff trade in metals has cracked: copper's record was built partly on a tariff deadline the White House may not keep, and a five percent day is what a crowded positioning trade does when the premise wobbles. And the geographic divergence sharpened again: an energy exporter with a technology index (the US) lost just over half a point, an energy exporter with a commodity index (Brazil) gained nearly one and a half, and energy importers with industrial indices (the euro area, Hong Kong, Australia) lost between half a point and one and a half.
Top Stories (Global)
- The ECB raised its deposit rate 25 bp to 2.50%, the second hike of 2026, with the refinancing rate at 2.65% and marginal lending at 2.90%. Lagarde called the decision a "no brainer", said the energy shock could intensify and that second-round effects could be larger than assumed, and would not discuss the future path. Staff projections: inflation 3.0% in 2026, 2.5% in 2027, 2.1% in 2028; growth 0.9% in 2026. Markets now price 60 bp more by April 2027.
- Iran claimed its largest wave of attacks on shipping since the war began, around ten vessels in and around the Strait of Hormuz, with Houthi strikes on Saudi assets alongside. Brent settled at $107.63, up 6.34%, and WTI at $102.48, up 6.69%, back above $100. Saudi August output of 6.24 mn b/d is the lowest since 1990.
- US PPI rose 5.4% year on year in August, against 5.3% expected and 4.8% in July; core PPI 4.6%, the highest since June. Fed hike odds for 16 September rose to roughly 70% to 74% from 62%.
- The 10-year Treasury settled at 4.95%, its highest since 2023, up 12 bp on the day, with the 30-year at 5.37%, the 5-year up 14 bp to 4.75% and the 2-year up 13 bp to 4.56%.
- The 10-year Bund reached 3.48% to 3.50%, its highest since April 2011; the 10-year gilt at 5.29% is its highest since August 2007; the JGB 10-year rose to 2.92%. The OAT-Bund spread widened to roughly 94 bp on today's quotes.
- Copper fell 5% after a Reuters report that the White House is reconsidering the 15% refined-copper tariff due 1 January 2027, a day after its second consecutive record settlement. LME copper fell 3% to $14,329.50/t, Freeport-McMoRan 8%, European miners 3.9%; silver settled down 5.4% and gold 1.2%.
- The S&P 500 closed down 0.58% at 7,591.70, a fourth straight decline and the longest run since March, with the Nasdaq 100 off 1.08%, Meta higher on a JPMorgan upgrade and Cooper Cos down 14% to 18%.
- Oracle beat on first-quarter fiscal 2027 results after the close: revenue of $19.35bn against roughly $19.1bn expected, up 30% year on year, adjusted EPS of $1.92, cloud infrastructure revenue up 121% to $7.4bn, and full-year revenue guidance of at least $90bn with adjusted EPS of $8.10. The shares closed the regular session at $152.94 and rose as much as 7% in extended trading, a first answer to the question of whether AI capex earnings can carry an index on 24.5x.
Looking Ahead
Central banks - Wednesday 16 September: FOMC. A 25 bp hike is now the base case at roughly 70% to 74%. Tomorrow's CPI is the last input; a print at or above the 3.4% consensus would make it close to a certainty. The dot plot and the press conference will have to reconcile a hike with unemployment at 4.1% and payrolls at +162k, which is a tightening into a still-growing economy rather than into weakness. - Thursday 17 to Friday 18 September: BOJ. A move to 1.25% is widely expected and a further hike by January has been floated from the prime minister's office. The yen has firmed 3.7% in a month on it. - ECB: no meeting until October, but speakers will be parsed for whether "no debate on the path" was a shrug or a signal. Markets price another hike by December.
Economic releases - Friday 11 September: US CPI for August. Consensus around +0.4% m/m, 3.4% y/y headline, 2.4% core; today's PPI puts the risk to the upside. The University of Michigan preliminary sentiment survey follows, with its inflation expectations components watched closely given the energy shock. - Euro area final HICP for August and industrial production follow; UK GDP for July is due.
Earnings - Oracle has reported (see Top Stories); the read-across to the AI capex complex plays out in Friday's session. Adobe is expected later in the week.
Geopolitical - The escalation to watch is whether the tit-for-tat between Washington and Tehran extends from tankers and ships to fixed export infrastructure, and whether Hormuz transit is interrupted in fact rather than harassed. Saudi output at a 36-year low and the Houthi attacks on Saudi assets are the second front. - The White House copper-tariff decision is now a live market variable; a confirmation or withdrawal either way will move the metal several percent. - French fiscal risk, with the OAT-Bund spread widening toward 95 bp, and the UK gilt market at 2007 yields remain the European sovereign stories.
Market closures - No closures in the next five trading days across the US, UK, Germany, France, Japan, Australia, Switzerland, Canada, Korea or Brazil. - Further out: Japan 21 September (Respect for the Aged Day) and 23 September (Autumnal Equinox Day), the first falling three days after the BOJ decision; Korea 24 to 26 September (Chuseok); Canada 30 September (National Day for Truth and Reconciliation). - The holiday cache holds no data for India, so Indian closures cannot be checked from it.