2026 09 21
Global Financial Briefing — Monday, 21 September 2026
Americas index levels, commodities and day changes reflect the 21 Sep closing print. The US Treasury curve, the 10-year TIPS real yield and the euro AAA curve are the 21 Sep closes; FX, credit spreads and the monthly macro series are dated inline.
Market Overview
The week opened with the energy trade running in reverse. Oil fell hard, WTI's November future settling at $92.37 (−3.86% against Friday's $96.08 settlement) and Brent's December at $96.24 (−3.07% against $99.29), after President Trump said the Iran war would "end soon", that he would "probably" be open to meeting Iran's President Pezeshkian at the UN General Assembly this week, and confirmed talks with the Houthis; US Central Command reported crude and LNG flows through the Strait of Hormuz at a six-month high with the main transit lanes clear of mines, Middle East shipments averaging 17.1 million barrels a day over the past ten days, and Aramco is reported to expect to restore about half of the East-West pipeline's capacity within days, with Saudi exports back above 4 million barrels a day in September from about 2.4 million in August (Trading Economics, Saxo, Bloomberg via search). The financial press quoted WTI near $95.60 through the session, which is the expiring October contract, trading for the last time tomorrow (Trading Economics); the roughly $3 between it and the November contract in the table is the backwardation the 18 September briefing recorded when Yahoo's generic rolled, and it is the price of prompt supply rather than a difference of view about the quarter. What the fall in oil did to rates is the day's main move: the 10-year Treasury settled at 4.96% (US Treasury par curve, 21 September), 5 bp below Friday's 5.01%, which had matched Wednesday's 5.01%, the highest since 2007, at the end of an eight-session rise; the 30-year settled at 5.29% (−5 bp) and the 5-year at 4.83% (−3 bp), while the 3-month bill rose 3 bp to 4.17%, so the fall was in the part of the curve oil and inflation price. Equities took the lower yields and ran: the S&P 500 closed at 7,764.70 (+1.49%), the Nasdaq 100 at 30,482.35 (+2.83%) and the Dow at 52,048.83 (+0.71%), the AI hardware names again in front for a third session after Thursday's 3% gain in the chipmakers and Friday's further rise (18 September briefing): Intel closed up 12.2% on a Micro LED packaging partnership with Taiwan's AUO and the continuation of last week's breakout, AMD 10.0% and at about a $1 trillion market value, and Warner Bros Discovery (+7%) and Paramount Skydance (+6%) rose on a Wall Street Journal report of progress in resolving the legal opposition to their $81 billion merger (CNBC, Investing.com, Invezz via search). The FRED SP500 series' 21 September close of 7,764.70 matches the index close above to the cent. The other support is diplomatic: US and Chinese officials began preparatory talks in New York ahead of Thursday's Trump-Xi summit, and Treasury Secretary Bessent called the discussions on AI, trade and investment "very successful" (Saxo).
Europe recovered most of Friday's fall and, unusually, did so with the bond market on its side. The STOXX 600 rose 1.02% to 641.93, the Euro STOXX 50 1.31% to 6,318.20, the DAX 1.07% to 25,575.01, the CAC 40 0.92% to 8,138.94, the SMI 1.23% to 13,956.58 and the FTSE 100 0.75% to 10,739.01; against Friday's falls of 1.1% to 1.6%, that leaves the STOXX 600 down 0.1% over the two sessions and the DAX down 0.5%. Banks led everywhere (Société Générale +3.7%, BNP Paribas +1.2%, Crédit Agricole +1.0%; Commerzbank and Deutsche Bank in Frankfurt; Barclays +1.8%, HSBC +1.7%, Standard Chartered +1.8% in London), the technology and capital-goods names followed (Siemens and Infineon each more than 2%, Schneider Electric +2.7%, Safran +1.9%, SAP, Siemens Energy, MTU), the miners rose with copper (Antofagasta +3.5%, Anglo American +2.6%), and the oil majors were the drag (BP −3%, Shell −1.3%), with Volkswagen and Daimler Truck lower in Frankfurt (Trading Economics). The euro-area curve rallied with Treasuries: the 10-year Bund fell 7 bp to 3.45% from Friday's 3.52% (Tuesday's 3.57% was its highest since June 2009), the 2-year to 3.20%, the 10-year OAT 10 bp to 4.47%, the 10-year BTP 10 bp to 4.34% and Spain 8 bp to 3.91% (Trading Economics, 21 September intraday). Two pieces of weekend news did not move prices today but belong in the record. Scope Ratings cut France to A+ from AA− after Friday's close, with a stable outlook, putting it level with Fitch and S&P; it cited persistent deficits, which it projects at 5.4% of GDP this year, rising interest costs and a political fragmentation it expects to persist beyond the 2027 presidential election (Bloomberg, Newsquawk via search). The OAT-Bund spread is about 102 bp today from 105 bp on Friday, and the OAT still yields 13 bp more than the BTP. In Germany, Sunday's state elections went badly for the chancellor's party: Die Linke won Berlin with 25.7% ahead of the CDU's 18.8% and the AfD's 16.3%, the AfD is projected to have won Mecklenburg-Vorpommern with about 38%, and Friedrich Merz called the results a "disaster" for the political centre (CNN, NPR via search). The DAX's 1.07% gain says the market read them as a regional rather than a federal event, for now.
Asia rose without Tokyo. Japan was closed for Respect for the Aged Day, so the Nikkei's 65,018.95 is Friday's close, when it rose 1.38% on the BOJ's hike to 1.25%, and the 10-year JGB's 2.99% is likewise Friday's mark. The Kospi rose 1.65% to 7,007.72, a second gain after Friday's 2.66% rise to 6,894.23, on Korea's export figures for the first 20 days of September (+78% year on year, semiconductor shipments +259% to $34.1 billion) and Samsung Electronics (+4.8%), SK Square (+4.4%) and the financials (Shinhan +2.9%); the Hang Seng rose 1.18% to 25,042.71 on Tencent (+2.6%) and the health-tech names (XtalPi +5.9%, Genscript +5.2%), with the newly listed Transwarp Technology up 6.2% on its debut; Shanghai rose 0.97% to 3,949.91, the Nifty 50 0.29% to 23,414.30 and the ASX 200 was flat at 8,731.90 (Trading Economics). The yen is the exception to the risk-on pattern: USD/JPY pushed above 157 toward 158 in Asian hours before a reported Bank of Japan rate check pulled it back to about 157 (Tickmill, Saxo), and it is at 157.48 (+0.40%) at 18:00 CEST, weaker than before Friday's hike; the dollar index is at 100.41 (+0.19%) and EUR/USD at 1.1471 (−0.17%). MSCI EM (EEM) closed up 2.69% at 68.83 on the Korea and Hong Kong moves. Copper is the commodity that rose, settling at $6.76/lb (+1.06%), 0.6% below its 9 September record; gold settled at $4,383.90 (−0.93%), 21.5% below its 29 January record, and the US 10-year real yield eased 6 bp to 2.62% (US Treasury real curve, 21 September), coming off Friday's 2.68%, which was the highest in this briefing's archives.
Global Indices Snapshot
Americas
| Index | Level | Day Chg | Day Chg % | Source |
|---|---|---|---|---|
| S&P 500 | 7,764.70 | +114.20 | +1.49% | yfinance ^GSPC |
| Nasdaq 100 | 30,482.35 | +838.18 | +2.83% | yfinance ^NDX |
| Dow Jones | 52,048.83 | +366.19 | +0.71% | yfinance ^DJI |
| Brazil IBOV | 186,595.60 | +1,366.42 | +0.74% | yfinance ^BVSP |
Americas data reflects the 21 Sep close. The S&P 500 is 1.9% above its 50-day average (7,617), 8.1% above its 200-day (7,183) and 0.7% below its record of 7,816.70; the Nasdaq 100 is 4.5% above its 50-day (29,176) and 0.9% below its record of 30,762.20; the Dow is 1.6% under its 50-day (52,882), 3.9% above its 200-day and 4.9% below its record, still the weakest of the three on a day the rate-sensitive names should have led. The Bovespa is 5.6% above its 50-day and 6.4% below its record of 199,355. The FRED SP500 close for 21 September (7,764.70) matches the S&P 500 close above to the cent.
Europe
| Index | Level | Day Chg | Day Chg % | Source |
|---|---|---|---|---|
| Euro STOXX 600 | 641.93 | +6.48 | +1.02% | yfinance ^STOXX |
| CAC 40 | 8,138.94 | +73.92 | +0.92% | yfinance ^FCHI |
| DAX | 25,575.01 | +270.95 | +1.07% | yfinance ^GDAXI |
| FTSE 100 | 10,739.01 | +79.88 | +0.75% | yfinance ^FTSE |
| SMI (Swiss) | 13,956.58 | +169.86 | +1.23% | yfinance ^SSMI |
European data reflects today's cash close (21 Sep). The Euro STOXX 50 closed at 6,318.20, up 1.31%. The previousClose fields reconcile with Friday's closes for all five indices (635.45, 8,065.02, 25,304.06, 10,659.13, 13,786.72), so the changes are used as returned. The rebound leaves the STOXX 600 0.9% under its 50-day average (648), 3.4% above its 200-day (621) and 3.2% below its record of 663.41; the DAX 0.7% under its 50-day and 3.9% below its record; the FTSE 100 within 0.1% of its 50-day (10,750) and 2.3% below its record of 10,989.50; the SMI 2.4% under its 50-day. The CAC 40 at 8,138.94 is 3.2% under its 50-day (8,409), 1.2% under its 200-day (8,241) and 7.0% below its record of 8,755.03, still the only one of the five below both averages, with the Scope downgrade and a 4.47% OAT the reasons.
Asia-Pacific
| Index | Level | Day Chg | Day Chg % | Source |
|---|---|---|---|---|
| Nikkei 225 | 65,018.95 † | — | — | yfinance ^N225 |
| Hang Seng | 25,042.71 | +291.93 | +1.18% | yfinance ^HSI |
| Shanghai Comp | 3,949.91 | +38.04 | +0.97% | yfinance 000001.SS |
| ASX 200 | 8,731.90 | +0.70 | +0.01% | yfinance ^AXJO |
| Kospi (Korea) | 7,007.72 | +113.49 | +1.65% | yfinance ^KS11 |
† Nikkei 225: 21 September is Respect for the Aged Day; market closed today. The level is the 18 September close (+1.38% that day), confirmed by regularMarketTime. Tokyo is closed again on Wednesday 23 September (Autumnal Equinox Day). Other Asia-Pacific data reflects today's close (21 Sep). The Nikkei is 1.0% under its 50-day average (65,657) and 10.7% below its record of 72,831.73; the Kospi at 7,007.72 is 4.6% above its 50-day (6,699) and 25.3% below its record of 9,385.59; the Hang Seng is 1.0% under its 50-day and 2.2% under its 200-day; Shanghai is 1.3% above its 50-day and 1.5% under its 200-day.
Emerging Markets
| Index | Level | Day Chg % | Source |
|---|---|---|---|
| MSCI EM (EEM) | 68.83 | +2.69% | yfinance EEM |
| India Nifty 50 | 23,414.30 | +0.29% | yfinance ^NSEI |
| South Africa | 68.23 | −0.38% | yfinance EZA |
EEM and EZA are US-listed ETFs and reflect the 21 Sep close, as does the Nifty 50. EEM at 68.83 is 4.5% above its 50-day average (66) and 3.8% below its record of 71.57; the Nifty 50 is 2.8% under its 50-day (24,079) and 4.4% under its 200-day (24,487), 11.2% below its record; EZA is 16.5% below its record of 81.76 and 1.5% under its 200-day.
Index Valuations & Investment Risk
Valuation Table
| Index | Trailing P/E (live) | 50-day avg | 100-day avg | 200-day avg |
|---|---|---|---|---|
| S&P 500 | 24.9x | 26.0x | — | — |
| Nasdaq 100 | 30.0x | 30.5x | — | — |
| Euro STOXX 600 | 17.7x | 18.2x | — | — |
| CAC 40 | 16.6x | 17.4x | — | — |
| DAX | 18.1x | 18.7x | — | — |
| FTSE 100 | 15.3x | 17.7x | — | — |
| Nikkei 225 | 21.6x | 21.7x | — | — |
| MSCI EM | 14.6x | 16.3x | — | — |
Averages of the daily trailing P/E readings recorded since 1 May 2026 (n = 93); shown for reference only. Trailing P/E is yfinance trailingPE on the ETF proxies (SPY, QQQ, EXSA.DE, CAC.PA, EXS1.DE, ISF.L, 1321.T, EEM). The three US-listed proxies (SPY, QQQ, EEM) were re-read against the 21 September close: each moved by less than 1% (SPY to 25.0x, QQQ to 30.2x, EEM to 14.7x), below the threshold at which a row is restated, so the table stands as recorded at 18:00 CEST and the earnings yields below run on these values.
Investment Risk Assessment for ETF Investors
United States (S&P 500 / Nasdaq ETFs)
The S&P 500's earnings yield is (1÷24.90) = 4.02%. Against the settled 10-year at 4.96% (US Treasury par curve, 21 September) the earnings yield gap is −0.94 pp: the 10-year Treasury pays 94 bp more than the index earns, before any growth. Against the 10-year real yield of 2.62% (US Treasury real curve, 21 September) the gap is +1.40 pp, the 2.34 pp difference being the market-implied inflation rate that a fixed coupon does not grow with and earnings, roughly, do. That correction flips the sign, and its size is the point of interest: on quoted prices alone a bond paying 4.96% beats an index earning 4.02%, and only once inflation is credited to the equity leg does the index come out ahead. The day narrowed the nominal gap from Friday's 99 bp by moving the bond leg, not the equity one: the 10-year fell 5 bp while the index rose enough to leave the P/E where rounding had it. The Nasdaq 100 at 30.0x earns 3.33%, 1.63 pp under the 10-year and 0.71 pp over the real yield. An equity holder does not receive the full earnings yield; only the dividend and buyback portion arrives as cash, so the income comparison flatters the index. The index is 1.9% above its 50-day average and 0.7% below its record of 7,816.70, with the Nasdaq 100 4.5% above its 50-day; the VIX at 14.81 (FRED VIXCLS, 18 September) is low. The concentration is the risk the day illustrates: a 1.49% index gain built on Intel +12.2%, AMD +10.0% and the rest of the AI hardware chain is the same mechanism that took the Nasdaq 100 down last week, and it is not a mechanism that diversifies across an index-tracking fund. The rate sensitivity is the other: the 10-year real yield settled at 2.62%, only 6 bp below Friday's 2.68%, the highest in this briefing's archives, and the Fed's dot plot on 16 September had 16 of 18 participants expecting at least one more hike this year; this week's first Fed speakers since the blackout, Wednesday's flash PMIs and Friday's PCE are the tests of whether today's oil-led rally in Treasuries holds.
Europe (STOXX 600 / CAC 40 / DAX ETFs)
The STOXX 600's earnings yield is (1÷17.67) = 5.66%. Against the euro AAA 10-year at 3.47% (ECB YC API, 21 September) the euro earnings yield gap is +2.19 pp; against the 10-year Bund quote at 3.45% it is +2.21 pp, the two differing only by the few basis points that separate the ECB's fitted AAA composite from on-the-run Bunds. The euro real-yield version is available today: subtracting the SPF's 2.04% long-term HICP expectation (2026-Q3) from the AAA 10-year gives a euro real yield of 1.44%, so the gap on a real basis is +4.22 pp. The CAC 40 at 16.6x earns 6.03%, +1.56 pp over the 10-year OAT at 4.47%; the DAX at 18.1x earns 5.52%, +2.07 pp over the Bund; the FTSE 100 at 15.3x earns 6.54%, +1.32 pp over a 10-year gilt at 5.22%. The US-euro comparison, −0.94 pp against +2.19 pp, overstates Europe's advantage by the difference between the two currencies' inflation and policy paths, which the real-basis gaps net out: +1.40 pp for the US against +4.22 pp for the STOXX 600, both on 21 September curves, so the ordering survives the correction as it did on 18 September (+1.40 pp and +4.27 pp). Relative to the US, the STOXX 600 trades at a 29% P/E discount (17.7x against 24.9x). The European risks sit in the bond table and the weekend's news: an OAT-Bund spread at 102 bp the day after Scope's downgrade to A+, with the French 2027 budget due in parliament in early October; a Bund 10-year that touched its highest since June 2009 last week; an ECB that has hiked twice since June (2.25% on 17 June, 2.50% on 10 September), with the 2-year Bund at 3.20% still pricing a third; and a German government whose party has just recorded its worst state-election results since the war. A euro-based holder of EUR-quoted European funds has no FX effect on the quoted value but does carry currency exposure inside the earnings, since the CAC 40 and STOXX 600 constituents earn much of their revenue abroad; it is smaller and slower than a US holding's, not absent.
Japan (Nikkei / TOPIX ETFs)
The Nikkei 225 at 21.6x earns 4.63%, +1.64 pp over the 10-year JGB at 2.99% (18 September close; Tokyo closed today). The BOJ raised its policy rate to 1.25% on Friday 18 September, its second hike this year after the move from 0.75% to 1.00% on 16 June, with the new rate effective on Thursday 24 September, and the yen has weakened rather than strengthened since: USD/JPY at 157.48 tonight is about 4 yen weaker than the 153.43 of 16 September, and today's reported BOJ rate check near 158 is the first sign the authorities are uncomfortable with the pace. For a EUR- or USD-based holder the currency decision remains the larger one: an unhedged position has lost about 2.5% to the yen in three sessions while the index rose 1.4%, and the hedge cost has narrowed only a quarter-point against a Fed that has also just hiked. The Nikkei is 1.0% under its 50-day average and 10.7% below its record of 72,831.73, and trades on the same AI hardware chain as Korea and Taiwan.
Emerging Markets (MSCI EM ETFs)
EEM at 14.6x earns 6.86%, a 41% P/E discount to the S&P 500 and the widest in the table. Today's 2.69% gain at the close is Korea and Hong Kong: the Kospi's 1.65% rise on the export data and the Hang Seng's 1.18% on the technology names ahead of Thursday's Trump-Xi summit. The two risks are the same as they were: the China weight, which makes the fund a bet on the summit's trade and technology-restriction outcomes, and the dollar, which at 100.41 on the ICE index is firm and, with the US real yield at 2.62% within 6 bp of the top of this briefing's archived range, is not the tailwind EM funds have had in past cycles. The 4 September step down in the P/E to about 14.5x was an earnings update (the MSCI factsheet confirms it), not a price move, so the discount is real rather than a data artefact.
Overall Risk Score: High valuation risk / low margin of safety for the US, where the 10-year Treasury out-yields the S&P 500's earnings by 94 bp and the real yield, at 2.62%, sits just off the top of the archived range; moderate, fair value, for Europe, Japan and EM, where the earnings yield gaps are positive on nominal yields, with France carrying the sovereign risk and Japan the currency risk.
US Economic Indicators (FRED - authoritative)
| Indicator | Current | Prior | Delta | Reference Date | FRED Series |
|---|---|---|---|---|---|
| CPI YoY % | 3.35% | 3.30% | +0.05 pp | Aug 2026 (prior Jul 2026) | CPIAUCSL |
| Core CPI YoY % | 2.45% | 2.47% | −0.02 pp | Aug 2026 (prior Jul 2026) | CPILFESL |
| Unemployment Rate | 4.1% | 4.1% | 0.0 pp | Aug 2026 (prior Jul 2026) | UNRATE |
| Nonfarm Payrolls | +162k | +21k | +141k | Aug 2026 (prior Jul 2026), monthly chg | PAYEMS |
| 10Y TIPS Real Yield | 2.62% | 2.68% | −6 bp | 21 Sep 2026 (prior 18 Sep) | DFII10 (US Treasury real curve) |
Macro data is monthly and lags four to six weeks; the August CPI and payrolls are the latest. Headline CPI at 3.35% is up 5 bp on July and 135 bp above the 2% target, core is drifting down at 2.45%, and payrolls rebounded to +162k from July's +21k: the mix the Fed hiked into on 16 September. The real yield settled 6 bp lower at 2.62%, giving back part of Friday's rise to 2.68%: the day's fall in nominal yields was largely a fall in the real component, with the breakeven at 2.34% barely changed.
Other economic releases today (from web search): no major US or euro-area releases were scheduled. South Korea's exports for the first 20 days of September rose 78% year on year, with semiconductor shipments up 259% to $34.1 billion (Trading Economics), the reason the Kospi led Asia. Wednesday's flash PMIs for the euro area, the UK and the US are the first activity read after the three September hikes (Fed, ECB, BOJ) and the energy shock.
Fixed Income & Bond Analysis
US Treasury yields are the settled 21 September par curve from Treasury's own feed; the euro AAA curve is the ECB's own 21 September publication. The French, UK, Japanese and Italian yields are web-sourced quotes and are dated in the table.
Policy Rates
| Central Bank | Rate | Source |
|---|---|---|
| Fed Funds (upper) | 4.00% | FRED DFEDTARU (21 Sep 2026) |
| Fed Funds (lower) | 3.75% | FRED DFEDTARL (21 Sep 2026) |
| Effective FFR | 3.88% | FRED DFF (17 Sep 2026) |
| ECB Deposit Rate | 2.50% | FRED ECBDFR (21 Sep 2026) |
| BOJ Policy Rate | 1.25% | web search (CNBC, Japan Times; decision 18 Sep 2026, effective 24 Sep) |
| BOE Bank Rate | ~3.73% (SONIA) | FRED IUDSOIA (17 Sep 2026); BOE held 6 to 3 on 17 Sep |
The Fed's range has stood at 3.75% to 4.00% since the 25 bp hike on 16 September, its first increase since 2023; the ECB's deposit rate at 2.50% since 10 September, its second hike this year after 17 June's move to 2.25%; the BOJ's 1.25% is Friday's decision, its second hike this year after 16 June's move to 1.00%. Trading Economics reports the market pricing about an 80% probability of a BOE hike in November and 56% odds of a second by year-end.
Government Bond Yields
| Country | 2Y Yield | 10Y Yield | 30Y Yield | Day Chg (10Y) | Source |
|---|---|---|---|---|---|
| USA | 4.76% | 4.96% | 5.29% | −5 bp | US Treasury par curve (2026-09-21) |
| Germany | 3.15% | 3.47% | 3.73% | −6 bp | ECB YC API (2026-09-21) |
| France | 3.47% | 4.47% | 5.11% | −10 bp | web (Trading Economics, 21 Sep intraday) |
| UK | 4.66% | 5.22% | 5.71% | −7 bp | web (Trading Economics, 21 Sep intraday) |
| Japan | 1.85% | 2.99% | 4.08% | — | web (Trading Economics, 18 Sep close; Tokyo closed 21 Sep) |
| Italy | — | 4.34% | — | −10 bp | web (Trading Economics, 21 Sep intraday) |
The USA row is the settled 21 September par curve throughout, and its day change is that curve against Friday's 5.01%. The Germany row is now the ECB's fitted AAA euro-area curve for 21 September, which is what the euro real yield and the euro earnings yield gap are computed against; the on-the-run 10-year Bund quoted at 3.45% and the 2-year at 3.20% during the session (Trading Economics), a few basis points from the fitted curve by construction, and the OAT-Bund spread below is quoted on those Bunds so that both legs are on-the-run bonds. The French, UK and Italian rows are the original run's intraday quotes: Trading Economics' bonds overview rendered the day's changes without sign, the country pages give them as declines (France −10.3 bp, UK −7.2 bp), and the signs above are taken from those. Spain's 10-year is 3.91% (−8 bp). The UK remains the outlier: a 10-year gilt at 5.22% is 26 bp over the equivalent Treasury and 175 bp over the AAA curve, and the 30-year gilt at 5.71% is the highest long yield in the table.
Yield Curve Spreads: - 10Y-2Y spread: +20 bp (US Treasury par curve, 21 September), 5 bp flatter on the day: the 10-year fell 5 bp with oil while the 2-year held at 4.76%. At the boundary of flat and normal: the curve has a positive slope, but a 2-year at 4.76% against a target range of 3.75% to 4.00% says the front end is pricing the further hike the dots showed, and the 10-year is only 20 bp above it. - 10Y-3M spread: +79 bp (US Treasury par curve, 21 September), from +87 bp on 18 September, the bill up 3 bp as the 10-year fell 5 bp. Comfortably positive; no recession signal from the term structure, which reflects a hiking Fed rather than one expected to cut.
The 3-month bill at 4.17% sits 30 bp above the 3.875% midpoint of the target range, inside the 50 bp tolerance the sanity check allows; it is consistent with the market pricing a further 25 bp hike within the bill's life.
OAT-Bund Spread: about 102 bp (4.47% against 3.45%, Trading Economics, 21 September intraday), from about 105 bp on Friday and 96 bp on Thursday. The OAT yields 13 bp more than the 10-year BTP (4.34%). Scope's Friday-evening downgrade to A+ from AA− aligns it with Fitch and S&P and leaves Moody's as the remaining higher rating; the agency's 5.4% of GDP deficit projection for this year is the number the 2027 budget, due in early October, has to answer. Today's 3 bp narrowing is the rally in all euro-area bonds, not a French recovery: the OAT fell 10 bp with the BTP, and the Bund 7 bp.
Yield Curve Charts
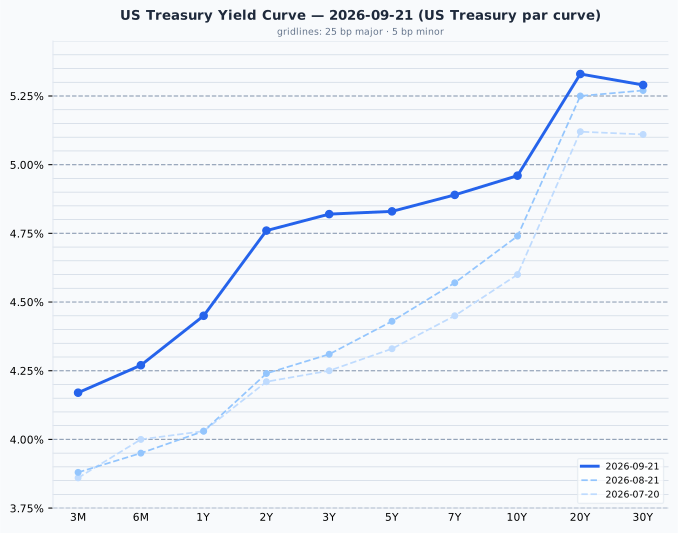
The settled 21 September curve is positively sloped from the 3-month bill at 4.17% to the 20-year at 5.33%, with the 30-year at 5.29% a touch below it, and a 2-year at 4.76% that makes the 2s10s slope 20 bp. The day's move pivoted on the 2-year: everything shorter rose 1 to 3 bp and everything longer fell 3 to 5 bp, which is the shape an oil-led fall in inflation compensation makes when the policy path is unchanged. Against the 21 August curve the term structure is still 2 to 52 bp higher, the rise concentrated in the front: the 2-year +52 bp (4.24% to 4.76%), the 5-year +40 bp, the 10-year +22 bp (4.74% to 4.96%), the 30-year +2 bp (5.27% to 5.29%). The month's move is a bear flattening led by the front end pricing the Fed's hike and the further one the dots showed; the 20 July curve shows the 10-year 36 bp lower still, at 4.60%.
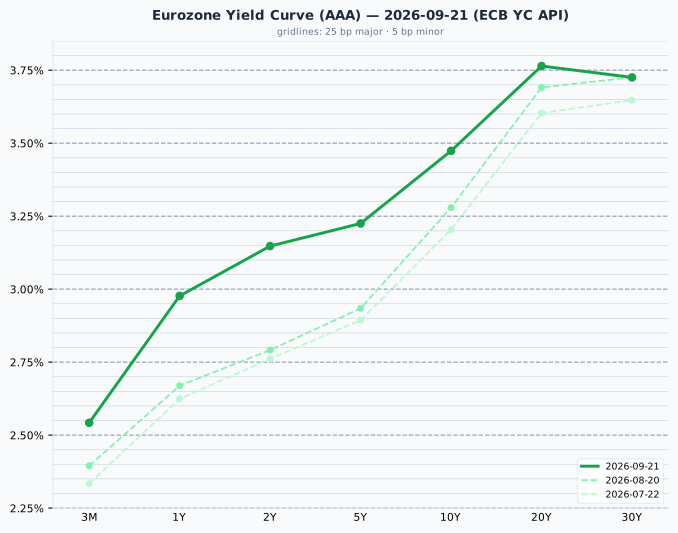
The curve plotted is the euro area's own 21 September AAA curve. It is positively sloped from 2.54% at 3 months to 3.76% at 20 years, with the 30-year at 3.73% just below the 20-year, and a 2-year at 3.15% that makes the 2s10s slope 33 bp. On the day the curve fell with Treasuries and by a similar amount: the 10-year 6 bp to 3.47% from Friday's 3.53%, the 2-year 7 bp and the 30-year 2 bp, so the euro rally was also concentrated where inflation compensation sits. Against the 20 August curve it is 15 to 36 bp higher across the front and belly, the 2-year +36 bp (2.79% to 3.15%), the 5-year +29 bp, the 10-year +19 bp (3.28% to 3.47%), with the 30-year unchanged: the euro curve has bear-flattened over the month on the same mechanism as the US one, an ECB that hiked on 10 September and a 2-year that prices a third move. The on-the-run Bunds quoted during the session sit close to the fitted curve, 5 bp above at the 2-year (3.20% against 3.15%), 7 bp above at the 30-year (3.80% against 3.73%) and 2 bp below at the 10-year (3.45% against 3.47%), which is about the distance the two measures normally keep, since one is a fitted AAA composite and the other a single issuer's benchmark bonds.
Credit Markets (from FRED, authoritative)
| Market | OAS | Obs. date | vs prior obs | Series ID |
|---|---|---|---|---|
| US Investment Grade | 77 bp | 2026-09-18 | −1 bp | BAMLC0A0CM |
| US High Yield | 268 bp | 2026-09-18 | −2 bp | BAMLH0A0HYM2 |
| Euro High Yield | 267 bp | 2026-09-18 | −2 bp | BAMLHE00EHYIOAS |
Change is 2026-09-18 vs 2026-09-17. Credit spreads are the 18 September close; today's session is not in them yet.
Both high-yield markets are below 300 bp, historically tight against the 300 to 500 bp normal band, and US investment grade at 77 bp is below the 80 to 150 bp band. Friday's 1 to 2 bp tightening across all three came on a session in which Treasuries sold off and European equities fell 1% to 1.6%, which says the credit market is not treating the 5% 10-year as a solvency problem for borrowers; against a month ago the readings are within a few basis points of where they were, so the six-week rise in nominal yields has been absorbed entirely in the risk-free leg. Tight spreads at record-adjacent equity levels and a 5% Treasury is the configuration that leaves little room for a growth disappointment, and Wednesday's PMIs are the first data point that could supply one.
Real Yields (US and Euro Area)
| Region | Nominal 10Y | Expected inflation | Real 10Y | How the real yield is obtained |
|---|---|---|---|---|
| United States | 4.96% (US Treasury par curve, 21 Sep) | 2.34% (nominal − real, residual) | 2.62% (US Treasury real curve, 21 Sep) | Measured. TIPS trade, so the market quotes a real yield directly; expected inflation is the residual (the breakeven) |
| Euro area | 3.47% (ECB AAA curve, 21 Sep) | 2.04% (ECB SPF long term, 2026-Q3) | 1.44% (nominal − survey) | Constructed. No euro inflation-linked benchmark is published, so a survey expectation is subtracted from the nominal yield |
The US real yield is a market price; the euro figure is a survey expectation subtracted from a fitted nominal curve, and is the softer of the two. The 10-year TIPS yield settled at 2.62% on 21 September, 6 bp below 18 September's 2.68%, and the breakeven at 2.34% is the market's implied inflation compensation, which carries an inflation risk premium a survey would not. Both legs carry the same date: the 149 bp nominal gap (4.96% against 3.47%) splits into about 30 bp of expected inflation (2.34% against 2.04%) and about 118 bp of real yield (2.62% against 1.44%), so the greater part of what a dollar bond pays over a euro one is a higher real rate rather than more inflation. On 18 September the same decomposition, with the euro leg a session behind, gave 29 bp and 123 bp. The persistent US-euro real rate gap is a structural feature of the two economies, not a trade: hedged into euros the advantage disappears, because the forward rate removes the interest differential, and unhedged it is a currency bet rather than a bond decision. A real yield is real in its own currency; 2.68% is 2.68% above US inflation, not a real return for someone who spends euros.
Bond Portfolio Implications
On quoted prices alone bonds beat US equities on income: the 10-year Treasury at 4.96% out-yields the S&P 500's 4.02% earnings yield by 94 bp, and a 2-year at 4.76% does so by 74 bp with a fraction of the duration. Corrected for the growth that earnings carry and a coupon does not, by quoting the gap against the 2.62% real yield, US equities come out 1.40 pp ahead, so the sign of the answer depends on whether one credits inflation to the equity leg; the 2.34 pp size of that correction is the point, not the agreement of two arrangements of the same equation. In the euro area the nominal gap is positive and larger, +2.19 pp for the STOXX 600 against the AAA curve and +1.56 pp for the CAC 40 against the OAT, so European equities out-earn their governments' bonds before any growth is credited, and the real-basis gap of +4.22 pp is three times the US one. None of this is a forecast of which asset outperforms: the earnings yield gap compares today's incomes, and adding the bond yield to the earnings yield is known to make the equity forecast worse, not better.
At the settled par yields a further 100 bp rise costs about 7.5% on a 10-year and 13.4% on a 30-year (modified duration 7.81 and 14.96), against about 1.9% on a 2-year. The trade-off in the current environment: the front end pays 4.76% for two years with a rate risk that a single further hike would barely dent, while the long end pays 33 bp more for a duration that would lose more than two years of coupon on a 100 bp move, and the 30-year's 5.29% is being set by the fiscal and inflation questions today's oil move only partly answered. For a euro-based investor the same logic applies to the AAA curve: a 2-year at 3.15% carries 8 bp less than the 5-year and 33 bp less than the 10-year, so the curve is paying little for the extra duration.
Currencies & Commodities
Currencies (live yfinance quotes):
| Pair | Rate | Day chg % | Source |
|---|---|---|---|
| EUR/USD | 1.1471 | −0.17% | yfinance (18:00 CEST) |
| USD Index (DXY, ICE) | 100.41 | +0.19% | yfinance (17:50 CEST) |
| USD/JPY | 157.48 | +0.40% | yfinance (18:00 CEST) |
| GBP/USD | 1.3371 | −0.16% | yfinance (18:00 CEST) |
| USD/CHF | 0.8215 | −0.03% | yfinance (18:00 CEST) |
FX quotes as of 18:00 CEST; day change vs the previous 17:00 ET close. The dollar is firm across the board on a day US yields fell, which says the move in Treasuries was oil rather than a repricing of the Fed. The yen is the one pair with news: USD/JPY traded toward 158 in Asian hours before a reported BOJ rate check pulled it back, and at 157.48 it is about 4 yen weaker than on 16 September, the day before the FOMC hike, despite the BOJ's own hike on Friday. The ICE index at 100.41 is a different index from FRED's broad trade-weighted DTWEXBGS (118.21 on 11 September), and the two are not comparable.
Commodities (front-month futures via yfinance):
| Commodity | Price | Day Chg % | Ticker | Source |
|---|---|---|---|---|
| Brent Crude | $96.24 | −3.07% | BZZ26 | yfinance |
| WTI Crude | $92.37 | −3.86% | CL=F | yfinance |
| Gold ($/oz) | $4,383.90 | −0.93% | GC=F | yfinance |
| Silver ($/oz) | $66.42 | −1.09% | SI=F | yfinance |
| Copper ($/lb) | $6.76 | +1.06% | HG=F | yfinance |
| Nat Gas ($/MMBtu) | $2.84 | −2.61% | NGV26 | yfinance |
Prices and day changes are the 2026-09-21 settlement against the 2026-09-18 settlement, the basis the wires print for a completed session. Brent and natural gas are quoted on the dated contracts the briefing followed, BZZ26 and NGV26, because Yahoo's generics have since moved to BZX26 and NGX26.
The crude rows are the November WTI (CLX26, expiring 20 October) and the December Brent (BZZ26, expiring 2 November), the contracts Yahoo's generics pointed at on 21 September. WTI settled $3.71 lower at $92.37 and Brent $3.05 lower at $96.24, 22.7% and 23.7% below their 52-week highs of $119.48 and $126.10; the drivers are the diplomatic signals on Iran, the six-month high in Hormuz flows and Aramco's expected partial restoration of the East-West pipeline, set against a US State Department alert that the Saudi-Houthi conflict could "escalate rapidly". The all-time highs for both crude contracts date from July 2008 and describe a different market; the 52-week range is the relevant context. Two contract changes have happened since then and neither is a price move: Yahoo's Brent generic now points at the November contract (BZX26), which settled $4.10 above the December one at $100.34, and its gas generic has rolled to November (NGX26) at $2.99, a week before the October contract the table quotes expires on 28 September. Natural gas on that October contract settled at $2.84, down 2.61%. Gold settled at $4,383.90, 21.5% below its all-time high of $5,586.20 (29 January 2026), and fell 0.93% on a day the real yield it competes with came off its archive high; silver settled at $66.42, 45.2% below its all-time high of $121.30, also set on 29 January, and its 52-week range of $43.30 to $121.30 is the widest in the table in proportional terms. Copper settled at $6.76/lb (+1.06%), 0.6% below its all-time high of $6.81 set on 9 September, so still at record highs, with the White House copper-tariff decision unresolved and Trading Economics citing expectations of tighter supply and resilient Chinese demand; it is the one commodity in the table trading on its own fundamentals rather than on the Gulf.
Crypto: no move above 3% was reported today; omitted.
Sector & Theme Highlights
- Semiconductors and AI hardware, third session of leadership. After Thursday's 3% gain in the chipmakers and Friday's further rise, Intel (+12.2%), AMD (+10.0%, at about a $1 trillion market value), Samsung Electronics (+4.8%), Infineon and Siemens (each +2%) and the Korean export print (chip shipments +259% year on year) carried every region today. The Nasdaq 100's +2.83% against the Dow's +0.71% is the width of the gap.
- Banks led Europe. Société Générale +3.7%, Barclays +1.8%, Standard Chartered +1.8%, HSBC +1.7%, with Commerzbank and Deutsche Bank higher in Frankfurt: the sector that fell 3% on Friday's rate scare rebounded on the rally in sovereigns, and it remains the main beneficiary of a 2-year Bund at 3.20%.
- Energy the laggard. BP −3%, Shell −1.3% as crude settled 3% to 4% lower; the oil majors and the Gulf supply premium are the same trade in reverse.
- Miners with copper. Antofagasta +3.5%, Anglo American +2.6%, on copper settling 0.6% below its record.
- Autos still weak. Volkswagen and Daimler Truck fell more than 1% in a rising DAX, after Volkswagen's 5.5% fall on Friday on cut margin guidance.
- Media consolidation. Warner Bros Discovery +7% and Paramount Skydance +6% on reported progress in clearing the legal opposition to their $81 billion merger.
- Cross-market theme: the energy-inflation-rates chain running backwards. Oil down, breakevens and nominal yields down, equities up, dollar firm. The chain is symmetric, and the State Department's escalation warning is the reminder that it can run forward again on one headline.
Top Stories (Global)
- Oil settles 3% to 4% lower on Iran diplomacy and Hormuz flows. President Trump said the war would "end soon" and that he would "probably" be open to meeting Iran's President Pezeshkian at the UN this week; CENTCOM reported Hormuz crude and LNG flows at a six-month high with transit lanes clear of mines, and Aramco is reported to expect to restore about half of the East-West pipeline's capacity within days, with September exports back above 4 million barrels a day (Trading Economics, Saxo, Bloomberg via search).
- Treasuries rally with oil. The 10-year settled at 4.96%, 5 bp below Friday's 5.01%, the highest since 2007; the 30-year at 5.29% (−5 bp), with the 2-year unchanged at 4.76%, so the curve flattened to a 20 bp 2s10s slope. Against the 21 August curve the 10-year is still 22 bp higher and the 2-year 52 bp.
- AI hardware leads a broad rally. Intel closed +12.2% on an AUO Micro LED packaging partnership, AMD +10.0% at about $1 trillion, the Nasdaq 100 +2.83% and the Nasdaq Composite at a record close, Kospi +1.65% on Korea's 20-day export data (+78%, chips +259%) (CNBC, Yahoo Finance, Investing.com, Trading Economics via search).
- Scope downgrades France to A+. The cut from AA− on Friday evening, stable outlook, aligns Scope with Fitch and S&P; it projects a 5.4% of GDP deficit this year and expects political fragmentation to persist beyond the 2027 presidential election. The OAT-Bund spread is about 102 bp today, from 105 bp on Friday (Bloomberg, Newsquawk via search; Trading Economics).
- German state elections punish the CDU. Die Linke won Berlin (25.7%, CDU 18.8%, AfD 16.3%); the AfD is projected to have won Mecklenburg-Vorpommern with about 38%; Merz called the results a "disaster" for the centre (CNN, NPR, Al Jazeera via search). The DAX rose 1.07%.
- US-China talks ahead of Thursday's summit. Preparatory discussions in New York on AI, trade and investment, described by Treasury Secretary Bessent as "very successful" (Saxo); the Hang Seng rose 1.18%.
- Yen: BOJ rate check near 158. USD/JPY pulled back to about 157 after a reported rate check, three days after the BOJ's hike to 1.25% (Tickmill, Saxo); it is 157.48 at 18:00 CEST.
- Warner Bros Discovery +7%, Paramount Skydance +6% on a WSJ report of progress resolving the legal opposition to their $81 billion merger (search summary).
Looking Ahead
Central banks - Fed: no meeting until late October. The blackout ended last week, so this week brings the first Fed speakers since the 16 September hike to 3.75% to 4.00%, read against a 10-year that touched 5.01% and a dot plot with 16 of 18 participants expecting at least one more hike this year. - ECB: no meeting until October. The 2-year AAA yield at 3.15%, and the 2-year Bund quoted at 3.20%, still price a third hike after 17 June's 2.25% and 10 September's 2.50%; Wednesday's flash PMIs are the test of whether the energy hit to growth argues against it. - BOJ: the 1.25% rate takes effect on Thursday 24 September; Tokyo is closed on Wednesday. Today's rate check near 158 is the first sign of the authorities leaning against the yen's fall since the hike. - BOE: next meeting in November, with about 80% of a hike priced (Trading Economics); the 2-year gilt at 4.66% fell with the rest of the curve today. - Norges Bank, SNB and Riksbank on Thursday 24 September: Norges Bank has more than 50% of a hike priced; the SNB and Riksbank are expected to hold (Tickmill).
Economic releases - Tuesday 22 September: the WTI October contract expires; UK public finances; the Trump-GCC meeting at the UN. - Wednesday 23 September: flash PMIs for the euro area, UK and US for September, the first activity read on both sides of the Atlantic after the three September hikes (Fed, ECB, BOJ) and the energy shock; German IFO; ECB Economic Bulletin; Japan closed. - Thursday 24 September: US durable goods and new home sales for August; the Trump-Xi summit; the BOJ's new rate takes effect; Costco earnings; Korea closed for Chuseok (24 to 26 September). - Friday 25 September: US PCE inflation for August, the first inflation print the Fed sees after its hike, with the third Q2 GDP estimate and consumer sentiment.
Earnings - Costco on Thursday is the one large report; the AI hardware names, which carried every market today, trade on supply-chain and policy headlines until the October reporting season.
Geopolitical - The Iran diplomacy the oil market is now pricing: a possible Trump-Pezeshkian meeting at the UN General Assembly, Gulf-leader talks, and the Houthi channel, against a State Department alert that the Saudi-Houthi conflict could escalate rapidly. - The Saudi East-West pipeline: Aramco reported to expect about half of capacity restored within days; interim exports via Hormuz and ship-to-ship transfers, with Chinese and Korean refiners taking the redirected cargoes. - Thursday's Trump-Xi summit, with trade and technology restrictions the focus for the Hang Seng and the chipmakers. - The French 2027 budget, due in parliament in early October, now with the Scope downgrade and an OAT-Bund spread at 102 bp behind it. - The German government after Sunday's state elections, with the chancellor standing his ground; a coalition question rather than a market one, for now. - The White House copper-tariff decision remains unresolved; copper is within 0.5% of its record.
Market closures - Japan: Wednesday 23 September, Autumnal Equinox Day (Tokyo also closed today, Respect for the Aged Day). - South Korea: Thursday 24 to Saturday 26 September, Chuseok. - No closures in the next five days for the US, UK, Germany, France, Australia, Switzerland, Canada or Brazil (Canada's next is 30 September, National Day for Truth and Reconciliation). - No Indian holiday data is available here, so Indian closures are not checked.
Data sources: US Treasury par and real curves (21 September settle), the euro AAA curve from the ECB YC API (21 September), FRED (policy rates, VIX, credit OAS, macro), yfinance (index and ETF closes, P/E proxies, commodity settlements; the FX quotes are the 18:00 CEST snapshot), Trading Economics (French, UK and Japanese yields, the October WTI settle, regional equity commentary), CNBC, Yahoo Finance, Bloomberg, Saxo, Tickmill, Investing.com, Invezz, Newsquawk, CNN, NPR and Al Jazeera via web search. The SPF long-term expectation is the ECB's 2026-Q3 reading.