Global Financial Briefing — Thursday, 6 August 2026
Americas index levels, commodities and day changes reflect the 6 August closing print. Fixed income, FX and macro figures are dated inline.
Market Overview
Global markets split sharply along a single fault line today: semiconductors. What began as overnight profit-taking in US AI names became a rout in Asia, where South Korea's Kospi fell 4.58% to 6,296 and triggered a sell-side circuit breaker after intraday losses exceeded 5% — the second consecutive session in which Korean stabilisation mechanisms fired, following a buy-side breaker the previous day. SK Hynix dropped 10.67% and Samsung Electronics 6.50%. Hang Seng lost 1.49% and the Nikkei 0.93%. That the same market needed a buy-side halt on Wednesday and a sell-side halt on Thursday tells you more about the state of AI-complex positioning than any valuation metric will.
Europe simply ignored it. The STOXX 600 closed up 0.16% at 658.19, within 0.3% of its record, the CAC 40 rose 0.35% to 8,699.71 — a fresh record close — and the Euro STOXX 50 added 0.39%. The DAX was flat (+0.05%) and only the FTSE (−0.19%) and SMI (−0.23%) gave ground. Europe's index composition, light on semiconductors and heavy on banks, industrials and luxury, insulated it almost completely from the Asian selling. The US sat in between: the S&P 500 closed off 0.18%, the Nasdaq 100 0.39% and the Dow a heavier 0.85% — this comes a day after the Dow and S&P set record closes on strong earnings. The final hours split the two large-cap benchmarks: the S&P pared its decline into the close while the Nasdaq 100 extended its loss, leaving the tech-heavy index the day's weaker of the pair. That is consistent with selling concentrated in the AI-hardware complex rather than spread across the market.
The macro backdrop was mildly hawkish. Initial jobless claims came in at 199K against a 203K consensus, keeping claims below 200,000 and reinforcing a labour market that is not loosening enough to accelerate Fed cuts; Treasury yields rose in response, and the rising long end was the proximate cause of the US equity drift lower. Two other threads matter. Crude rallied hard — WTI +2.75% to $77.29 and Brent +3.83% to $82.49 — on fresh maritime attacks in the Red Sea and Gulf of Aden, rebuilding a geopolitical risk premium that had been draining out of the oil market all summer. And in FX, the yen has become the dominant G10 story after a coordinated US-Japan intervention drove a roughly 5% three-session rally; USD/JPY has now steadied near 158, with Treasury Secretary Bessent publicly reaffirming Washington's support for Tokyo.
Global Indices Snapshot
Americas
| Index | Level | Day Chg | Day Chg % | Source |
|---|---|---|---|---|
| S&P 500 | 7,709.96 | −13.59 | −0.18% | yfinance ^GSPC |
| Nasdaq 100 | 29,373.33 | −114.46 | −0.39% | yfinance ^NDX |
| Dow Jones | 53,885.10 | −464.02 | −0.85% | yfinance ^DJI |
| Brazil IBOV | 175,546.36 | −2,179.81 | −1.23% | yfinance ^BVSP |
Americas data reflects the 6 Aug close.
Cross-checked against FRED SP500, which publishes the official S&P 500 close: 7,709.96 for 2026-08-06, matching the yfinance close to the cent. FRED's 7,723.55 for 5 August likewise matches the prior close used to compute the day change.
Europe
| Index | Level | Day Chg | Day Chg % | Source |
|---|---|---|---|---|
| Euro STOXX 600 | 658.19 | +1.05 | +0.16% | yfinance ^STOXX |
| Euro STOXX 50 | 6,502.56 | +25.58 | +0.39% | yfinance ^STOXX50E |
| CAC 40 | 8,699.71 | +30.42 | +0.35% | yfinance ^FCHI |
| DAX | 26,140.13 | +13.83 | +0.05% | yfinance ^GDAXI |
| FTSE 100 | 10,867.89 | −20.41 | −0.19% | yfinance ^FTSE |
| SMI (Swiss) | 14,518.75 | −32.81 | −0.23% | yfinance ^SSMI |
European data reflects today's close (6 Aug).
Asia-Pacific
| Index | Level | Day Chg | Day Chg % | Source |
|---|---|---|---|---|
| Nikkei 225 | 65,683.26 | −617.18 | −0.93% | yfinance ^N225 |
| Hang Seng | 25,530.28 | −385.54 | −1.49% | yfinance ^HSI |
| Shanghai Comp | 3,900.35 | +21.92 | +0.57% | yfinance 000001.SS |
| ASX 200 | 9,271.60 | +43.80 | +0.47% | yfinance ^AXJO |
| Kospi (Korea) | 6,296.38 | −301.88 | −4.58% | yfinance ^KS11 |
Asia-Pacific data reflects today's close (6 Aug) in each local timezone.
The Kospi's −4.58% move was cross-checked before publication: it reproduces exactly from yesterday's independently archived close of 6,598.26, and is corroborated by contemporaneous reporting of a sell-side circuit breaker. It is genuine, not a data artifact. Separately, yfinance reports a 52-week low of exactly 0.0 for ^KS11 — that field is a data error and has been omitted throughout.
Emerging Markets
| Index | Level | Day Chg % | Source |
|---|---|---|---|
| MSCI EM (EEM) | 65.02 | −1.07% | yfinance EEM |
| India Nifty 50 | 24,636.00 | +0.05% | yfinance ^NSEI |
| South Africa | 66.88 | +0.04% | yfinance EZA |
EEM and EZA are NYSE-listed and reflect
the 6 Aug close. EEM extended its loss into the close; EZA reversed a small intraday decline to
finish marginally higher. India's Nifty 50 had already closed and is unchanged.
Index Valuations & Investment Risk
Valuation Table
| Index | Trailing P/E (live) | Hist avg trailing P/E (†) | Premium to hist. midpoint |
|---|---|---|---|
| S&P 500 | 25.88x | ~16-18x | +52.2% |
| Nasdaq 100 | 30.60x | ~25-30x | +11.3% |
| Euro STOXX 600 | 19.05x | ~15-17x | +19.1% |
| CAC 40 | 18.30x | ~14-16x | +22.0% |
| DAX | 19.11x | ~15-17x | +19.5% |
| FTSE 100 | 18.20x | ~13-15x | +30.0% |
| Nikkei 225 | 21.33x | ~20-22x | +1.6% |
| MSCI EM | 16.90x | ~13-15x | +20.7% |
(†) Hist avg trailing P/E: static long-run reference constants — the only
non-live figures in this briefing. Live trailing P/E from yfinance trailingPE on ETF proxies
(SPY, QQQ, EXSA.DE, CAC.PA, EXS1.DE, ISF.L, 1321.T, EEM). Bold marks a premium above 20%.
Reference benchmarks: S&P 500 long-run avg trailing P/E ~16-18x, Shiller CAPE long-run avg ~17x; Euro STOXX 600 ~15-17x; MSCI EM ~13-15x. A >20% premium to the historical average is elevated;
40% is historically stretched.
The striking feature is that nothing is cheap. Seven of eight indices trade above their long-run average, and only the Nikkei (+1.6%) sits at anything resembling fair value. The S&P 500's 52% premium is the outlier, and it is the one that carries the sharpest consequence below.
Investment Risk Assessment for ETF Investors
United States (S&P 500 / Nasdaq ETFs)
The S&P 500's trailing P/E of 25.88x implies an earnings yield of 3.86% (1÷25.88). The 10-year Treasury yields 4.63% (FRED DGS10, 2026-08-04). The equity risk premium is therefore −0.77% — negative. US equity investors are accepting a lower expected yield than the risk-free alternative offers, in exchange for taking equity risk. That is not a marginal signal: historically, a negative ERP has been a poor starting point for forward equity returns. The Nasdaq 100 is worse on this measure, with an earnings yield of 3.27% (1÷30.60) against the same 4.63% 10-year, an ERP of −1.36%.
The real-yield backdrop compounds it. The 10-year TIPS real yield is 2.40% (FRED DFII10, 2026-08-04), down 3 bps from 2.43% on 3 August but still historically high. A 2.4% real risk-free rate is a demanding discount rate to apply to the long-duration future earnings that justify a 25.9x multiple.
Technically, the index remains in an uptrend: the 7,709.96 close sits above both its 50-day (7,485.68) and 200-day (7,039.69) moving averages, 22% above its 52-week low of 6,310.32 and 1.1% below its all-time high of 7,793.68. The Nasdaq 100 is 4.5% off its record, and its close of 29,373.33 slipped fractionally below its 50-day average of 29,386.89 — it had been above that line mid-afternoon, so the last hour of trading took it through. The margin is 0.05%, too thin to call a trend break on its own, but it is the kind of level that matters if the semiconductor selling continues. So the picture is a strong trend on stretched valuations with a negative risk premium — the configuration that produces sharp, sentiment-driven drawdowns rather than slow de-ratings. Today's Korean semiconductor rout is a live demonstration of how quickly AI-complex positioning can unwind.
Europe (STOXX 600 / CAC 40 / DAX ETFs)
Europe is expensive relative to its own history but materially cheaper than the US, and the risk-premium arithmetic is far healthier. The STOXX 600's 19.05x trailing P/E gives an earnings yield of 5.25% (1÷19.05) against a euro area AAA 10-year of 3.15% (ECB YC API, 2026-08-05) — a euro ERP of +2.10%, nearly three percentage points better than the US. The DAX is comparable (5.23% earnings yield, ERP +2.08%) and the CAC 40 nominally better (5.47%, +2.32%) — though the CAC figure is measured against the AAA curve, and a French investor discounting against the OAT rather than the Bund would see a meaningfully smaller premium. For a euro-based investor this is the clearest relative-value signal in the data: European equities are being paid a real premium over European government bonds, while US equities are not.
Today reinforced the diversification case. Europe closed higher while Asia sold off on semiconductors, because the STOXX 600's composition simply does not carry that exposure. The CAC 40 set a record close.
The risks are the familiar ones. French fiscal and political risk remains the specific concern for a France-based investor — the OAT-Bund spread stood at 69 bps on 22 May 2026 with the OAT at 3.75% against a 3.06% Bund, and reporting indicates the French 10-year has since moved to trade above the Italian BTP, a historically unusual inversion of the periphery-core ordering. Today's spread was not retrieved and should not be assumed from the May level. For non-EUR investors, currency risk cuts both ways with EUR/USD at 1.1542.
Japan (Nikkei / TOPIX ETFs)
Japan is the one major market trading at fair value — 21.33x against a ~20-22x historical range, a premium of just 1.6%. But the currency has become the dominant variable. The coordinated US-Japan intervention that drove a ~5% three-session yen rally means unhedged foreign investors just took a significant mark against them, and hedged investors gained. With intervention risk now explicitly two-sided and official, the hedging decision matters more than the equity call. The BOJ holds at 1.00% — a 31-year high, reached in June — with roughly 54% market-implied probability of a further hike at the 18 September meeting. Higher rates plus a stronger yen is a double headwind for Japanese exporters. The Nikkei at 65,683 is 9.8% below its 52-week high of 72,831 and below its 50-day average of 67,131, so the market has already been consolidating.
Emerging Markets (MSCI EM ETFs)
The traditional EM valuation discount has largely closed: 16.90x is a 20.7% premium to the ~13-15x historical range, and EM now trades at only a modest discount to Europe. That erosion of the margin of safety comes precisely when EM's Asian technology weight — Korea and Taiwan semiconductors, China platforms — is the epicentre of today's volatility. EEM closed at 65.02, below its 50-day average (66.51) though well above its 200-day (60.47), and its −1.07% close was a wider loss than the −0.88% it showed mid-afternoon. Korea's back-to-back circuit breakers are the specific warning here. China is a partial offset: Shanghai rose 0.57% today and is the rare market with genuine valuation support, though it remains 36% below its all-time high.
Overall Risk Score (qualitative, not financial advice):
- United States — High valuation risk / low margin of safety. Negative ERP, 52% valuation premium, 2.4% real yields.
- Europe — Moderate. Elevated versus own history but a healthy +2.1% ERP and real diversification value.
- Japan — Moderate. Fair equity value; the risk has migrated to the currency and BOJ path.
- Emerging Markets — Moderate to high. Discount largely gone, concentrated tech risk actively unwinding.
Disclaimer: This is financial information, not personalised investment advice. Past valuations do not guarantee future returns. Consult a financial advisor before investing.
US Economic Indicators (FRED — authoritative)
| Indicator | Current | Prior | Delta | Reference Date | FRED Series |
|---|---|---|---|---|---|
| CPI YoY % | 3.46% | 4.17% | −0.70 pp | Jun 2026 | CPIAUCSL |
| Core CPI YoY % | 2.57% | 2.82% | −0.26 pp | Jun 2026 | CPILFESL |
| Unemployment Rate | 4.2% | 4.3% | −0.1 pp | Jun 2026 | UNRATE |
| Nonfarm Payrolls | +57K | — | monthly chg | Jun 2026 | PAYEMS |
| 10Y TIPS Real Yield | 2.40% | 2.43% | −3 bps | 2026-08-04 | DFII10 |
Total nonfarm payrolls stand at 158,984K. Note that FRED macro data is monthly and lags 4-6 weeks — the June reference month is the latest available.
The June inflation prints are genuinely encouraging: headline CPI fell 0.70 pp to 3.46% and core fell 0.26 pp to 2.57%, the latter approaching the Fed's target. Headline remains well above target, and today's crude rally is a reminder that the energy component that helped drive disinflation can reverse. Unemployment ticked down to 4.2%, and payroll growth of +57K is positive but modest — a labour market cooling without breaking.
Other economic releases today:
| Indicator | Actual | Consensus | Prior | Reaction |
|---|---|---|---|---|
| US Initial Jobless Claims (wk end 1 Aug) | 199K | 203K | 197K | Below consensus; claims stay under 200K. Treasury yields rose, equities drifted lower. |
Unadjusted initial claims totalled 171,246, down 5,289 (−3.0%) week-on-week. Q2 productivity and unit labour cost data were released alongside; figures (not retrieved).
Fixed Income & Bond Analysis
Policy Rates
| Central Bank | Rate | Source |
|---|---|---|
| Fed Funds (upper) | 3.75% | FRED DFEDTARU (2026-08-06) |
| Fed Funds (lower) | 3.50% | FRED DFEDTARL (2026-08-06) |
| Effective FFR | 3.63% | FRED DFF (2026-08-04) |
| ECB Deposit Rate | 2.25% | FRED ECBDFR (2026-08-06) |
| BOJ Policy Rate | 1.00% | web search (held July; raised to 1.00% June 2026) |
| BOE Bank Rate | ~3.73% | FRED IUDSOIA (SONIA proxy, 2026-08-04) |
The Fed-ECB policy gap remains 138 bps at the effective level, the structural support under the dollar. The SONIA proxy at 3.73% is consistent with a BOE Bank Rate held at 3.75% since 18 June.
Government Bond Yields
| Country | 2Y Yield | 10Y Yield | 30Y Yield | Source |
|---|---|---|---|---|
| USA | 4.20% | 4.63% | 5.18% | FRED (2026-08-04) |
| Euro AAA | 2.67% | 3.15% | 3.60% | ECB YC API (2026-08-05) |
| UK | (not retrieved) | ~4.90% | (not retrieved) | web (approx., see note) |
| Japan | (not retrieved) | 2.82% | (not retrieved) | web (2026-08-05) |
| France | (not retrieved) | (not retrieved) | (not retrieved) | — |
| Italy | (not retrieved) | (not retrieved) | (not retrieved) | — |
The "Euro AAA" row is the ECB's AAA-rated euro area government bond curve, of which Germany is the dominant constituent — it is a close Bund proxy but not a literal Bund quote. UK gilts: reporting described the 10-year as falling toward 4.90%, its lowest since 10 July, after softer oil earlier in the week; a precise same-day close was not retrieved, and Trading Economics showed 4.97% on 4 August. Treat the UK figure as approximate. Same-day French OAT and Italian BTP yields were not retrieved and are deliberately left blank rather than estimated.
Yield Curve Spreads (FRED pre-computed):
- 10Y-2Y spread: +45 bps (FRED T10Y2Y, 2026-08-05) — positive and moderately upward-sloping. This is neither flat (within ±25 bps) nor steep (>~75 bps historically); the curve is in the middle of a normalisation that has been running for some time.
- 10Y-3M spread: +74 bps (FRED T10Y3M, 2026-08-05) — clearly positive. The recession signal that this spread is best known for is not firing.
Together these say the market expects the Fed to hold or ease only gradually, with a rebuilt term premium at the long end rather than an imminent growth scare. The long end is where the action is: 20Y and 30Y are both at 5.18%, meaning the curve is flat across its final decade even as it slopes upward everywhere else — a classic term-premium rather than growth-expectation signature.
OAT-Bund Spread: (not retrieved for today.) The most recent figure located was 69 bps on 22 May 2026. Given that French political risk has been the dominant driver of this spread, a reading eleven weeks old should not be treated as current.
Yield Curve Charts
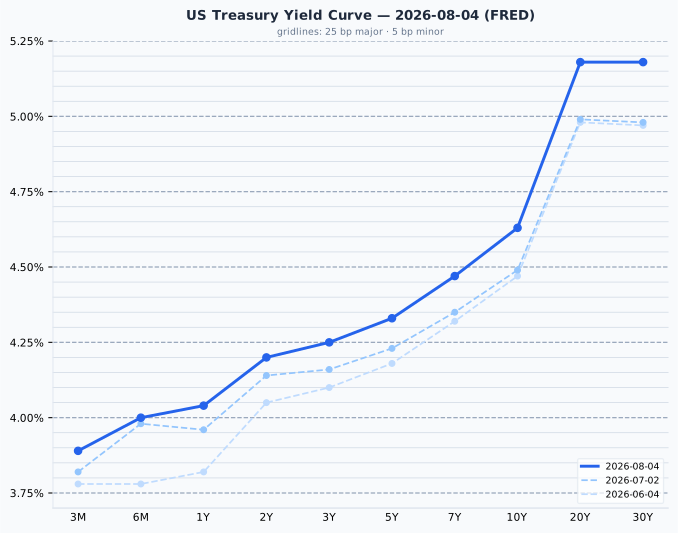
The US curve is upward-sloping across its entire length, from 3.89% at 3 months to 5.18% at 30 years, with the only flat segment between 20Y and 30Y where both sit at 5.18%. Since a month ago (7 July) the curve has bear-steepened: the 3-month rose 7 bps and the 2-year 6 bps, but the 10-year rose 14 bps and the 30-year 20 bps — the market has repriced long-dated term premium without materially changing its near-term Fed expectations.
One note on the front end: the 3-month bill at 3.89% sits about 27 bps above the Fed Funds target midpoint of 3.625%. That is a slightly wider gap than the usual near-alignment, though not large enough to suggest a data problem; it is consistent with modest bill supply pressure and no near-term cut being priced.
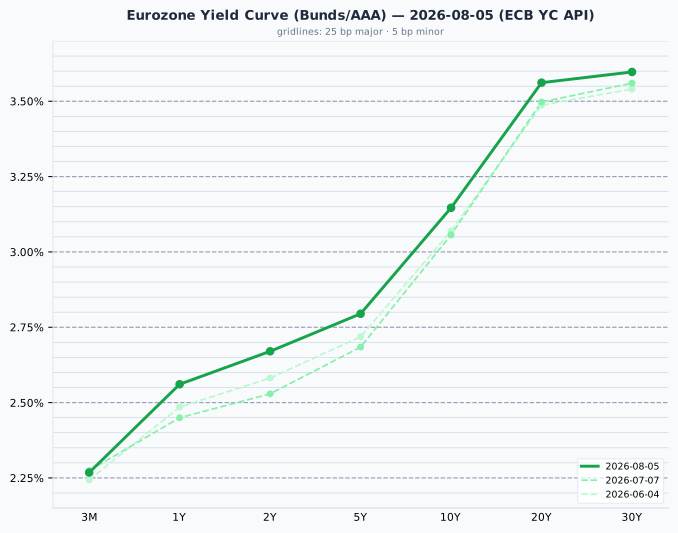
The euro AAA curve is also cleanly upward-sloping, from 2.27% at 3 months to 3.60% at 30 years, and sits roughly 150-160 bps below the US curve across all maturities. Since 7 July it has shifted up modestly but flattened: the 2-year rose 14 bps and the 10-year 9 bps, while the 30-year added only 4 bps — the opposite shape of the US move, and consistent with the market pulling forward the end of ECB easing rather than repricing long-run euro term premium.
Credit Markets (from FRED — authoritative)
| Market | OAS Spread | Series ID | Reference |
|---|---|---|---|
| US Investment Grade | 78 bps | BAMLC0A0CM | 2026-08-05 |
| US High Yield | 275 bps | BAMLH0A0HYM2 | 2026-08-05 |
| Euro High Yield | 265 bps | BAMLHE00EHYIOAS | 2026-08-05 |
Credit is signalling no stress at all — and arguably complacency. US high yield at 275 bps is below the 300-500 bps historically normal band, i.e. historically tight rather than merely comfortable, and nowhere near the >500 bps that marks stress. US investment grade at 78 bps is likewise just below its 80-150 bps normal range. Euro high yield at 265 bps is tighter still than its US equivalent, an unusual ordering reflecting the euro market's higher average credit quality and strong demand for euro carry.
Notably, spreads did not widen on today's Korean equity dislocation — credit and equity volatility markets are both pricing benign outcomes. With the VIX at 15.81 (FRED VIXCLS, 2026-08-05) — the lower half of the moderate 15-20 band, above the sub-15 complacency zone but not signalling stress — there is very little defensive positioning priced anywhere. That is a fragile configuration when US equity multiples carry a 52% premium and the equity risk premium is negative.
Bond Portfolio Implications
On the US numbers, bonds currently offer the better risk-adjusted proposition. A 4.63% nominal 10-year Treasury yield exceeds the S&P 500's 3.86% earnings yield outright, and the 2.40% real yield on TIPS locks in a positive real return without equity risk. For a US-dollar investor the question "are yields high enough to compete with equities?" has an unambiguous answer: yes, and by 77 bps.
In euro terms the calculus reverses. The AAA 10-year at 3.15% sits 210 bps below the STOXX 600's 5.25% earnings yield, so European equities retain a genuine premium over European bonds. A euro-based investor faces a different trade-off from a dollar-based one — and the two can be combined: euro equity exposure funded against euro duration, with US exposure tilted toward Treasuries rather than the S&P.
Duration risk cuts against enthusiasm at the long end. A 100 bps rise in yields costs roughly 8-9% in price on a 10-year bond, and today's long-end move shows the direction of pressure — the US 30-year is up 20 bps in a month. With the curve only moderately positive (+45 bps 10Y-2Y), the extra yield for extending from 2 years to 10 is thin compensation for that convexity risk. The belly of the curve (3-7 years, 4.25-4.47%) captures most of the available yield with materially less duration exposure, and remains the more attractive risk-adjusted segment.
Currencies & Commodities
Currencies:
| Pair | Rate | Source |
|---|---|---|
| EUR/USD | 1.1542 | ECB reference rate (2026-08-06) |
| EUR/USD | 1.1519 | FRED DEXUSEU (2026-07-31 — lagging) |
| USD Index | 119.70 | FRED DTWEXBGS (2026-07-31 — lagging) |
| USD/JPY | 157.83 | Derived from ECB reference rates (2026-08-06) |
| GBP/USD | 1.3467 | Derived from ECB reference rates (2026-08-06) |
| USD/CHF | 0.8097 | Derived from ECB reference rates (2026-08-06) |
FRED's FX series (DEXUSEU, DTWEXBGS) were last observed 31 July and are shown for continuity but are six days stale. Today's rates are derived from the ECB's 6 August euro reference rates (EUR/USD 1.1542, EUR/JPY 182.17, EUR/GBP 0.85705, EUR/CHF 0.9346), which are authoritative and same-day. Trading Economics separately quoted USD/JPY intraday at 158.14, +0.25% on the session — consistent with the ECB fix.
The yen is the story. Following a coordinated US-Japan intervention, the yen surged roughly 5% across three sessions before steadying near 158. Intervention risk, not rate differentials, is now the dominant driver in G10 FX.
Commodities (all from yfinance front-month futures):
| Commodity | Price | Day Chg % | Ticker | Source |
|---|---|---|---|---|
| Brent Crude | $82.49 | +3.83% | BZ=F | yfinance |
| WTI Crude | $77.29 | +2.75% | CL=F | yfinance |
| Gold ($/oz) | $4,299.60 | −0.13% | GC=F | yfinance |
| Silver ($/oz) | $61.61 | −1.09% | SI=F | yfinance |
| Copper ($/lb) | $6.709 | −0.28% | HG=F | yfinance |
| Nat Gas ($/MMBtu) | $2.640 | −1.79% | NG=F | yfinance |
Commodity figures are the 6 Aug settlement, replacing the intraday prints in the original briefing. Front-month futures settle at 20:30 CEST, after that briefing was written.
Crude was the day's standout, with Brent settling up 3.83% and WTI up 2.75% on reports of fresh maritime attacks in the Red Sea and Gulf of Aden, alongside an Iran-Oman agreement on a temporary Strait of Hormuz shipping route. WTI gave back a meaningful slice of its gain into the settle, having been up 3.19% mid-afternoon, so the rally was stronger in Brent than in the US benchmark, widening the Brent-WTI spread on the day. Even after the rally, both remain deeply below their records: Brent at $82.49 is 44.0% below its all-time high of $147.43 and 34.6% below its 52-week high of $126.10; WTI at $77.29 is 47.5% below its all-time high of $147.27. This is a risk-premium bounce within a well-established downtrend, not a structural repricing.
Precious metals were quiet and are a long way from their peaks. Gold at $4,299.60 is 23.0% below its all-time high of $5,586.20 (which is also its 52-week high), and silver at $61.61 is 49.2% below its all-time high of $121.30. Silver has given back essentially half its peak value — after an extraordinary run, the unwind has been correspondingly severe. Neither metal is anywhere near record territory despite the elevated geopolitical backdrop, which is itself notable: safe-haven demand is not currently expressing itself through metals.
Copper settled at $6.709/lb, 0.8% below its 52-week high of $6.7655 — near the top of its range
and well above the $4.3775 low. (Copper's yfinance range fields moved between the two captures:
the 52-week high from $6.8665 to $6.7655 and the ath from $6.723 to $6.728, a front-month
contract artifact rather than a market move. The ath still reads below the 52-week high, which
is internally inconsistent and therefore unreliable. Range context here uses the 52-week high
only; no all-time-high claim is made.) Natural gas settled at $2.640, near the bottom of its
52-week range ($2.483-$7.827) and 83.3% below its all-time high; its −1.79% settle was a
materially wider loss than the −1.15% showing intraday.
Crypto: no notable moves (>3%) retrieved. (not retrieved)
Sector & Theme Highlights
Worst performing: Semiconductors and the broader AI hardware complex, decisively. SK Hynix −10.67%, Samsung Electronics −6.50%, SK Square −13.40%, Samsung Electro-Mechanics −9.07%. The selling began with overnight profit-taking in US AI names and was amplified by news of a senior executive departure at Alphabet. Payments/fintech also had a poor day, with Fiserv −12% on a guidance cut.
Best performing: Energy, on the crude rally. European industrials, banks and luxury held the continent's indices in positive territory — the CAC 40's record close was built on exactly the sectors that Asia's selloff did not touch.
Cross-market themes:
- AI concentration risk is now demonstrably two-sided. Korea needing a buy-side circuit breaker one day and a sell-side breaker the next is not normal market behaviour; it reflects crowded, highly leveraged positioning in a narrow set of names. The Al Jazeera framing from late July — "AI-driven boom fades" — has been playing out for over a week, and the Kospi is now 32.9% below its 52-week high of 9,385.59.
- Geopolitical risk premium returning to energy after a summer of erosion, via Red Sea shipping attacks and Strait of Hormuz transit arrangements.
- Official FX intervention as a market force. Coordinated US-Japan yen buying, publicly reaffirmed at Treasury Secretary level, has changed the risk profile of every unhedged yen position.
- Regional decoupling. Europe closing green while Asia fell 1-5% on the same news is a real diversification signal, driven by index composition rather than sentiment.
Top Stories (Global)
- Kospi plunges 4.58% to 6,296, triggering a sell-side circuit breaker after intraday losses exceeded 5% — the second consecutive session of Korean stabilisation mechanisms firing, following a buy-side breaker the previous day. SK Hynix −10.67%, Samsung Electronics −6.50%.
- US jobless claims at 199K beat the 203K consensus, staying below 200,000 and keeping the labour market tight. Treasury yields rose in response; the Dow closed down 0.85%.
- Oil rallies, Brent +3.83% and WTI +2.75%, on fresh maritime attacks in the Red Sea and Gulf of Aden, plus an Iran-Oman deal on a temporary Strait of Hormuz shipping route.
- Yen steadies near 158 after coordinated US-Japan intervention drove a ~5% three-session rally; Treasury Secretary Bessent reaffirmed Washington's support for Tokyo.
- Fiserv tumbles 12% after cutting FY2026 adjusted EPS guidance to $7.20-$7.40 from $8.00-$8.30.
- SpaceX's first share lockup expires, with more than 900 million shares becoming eligible to trade — a potential supply overhang in a closely watched recent listing.
- CAC 40 closes at a record (8,699.71, +0.35%), with the STOXX 600 and Euro STOXX 50 both within 0.3% of their own records — Europe fully decoupled from the Asian semiconductor selloff.
- UK 10-year gilt yield falls toward 4.90%, its lowest since 10 July, as softer oil earlier in the week eased inflation concerns. Gilts had touched 5% in March, the highest since 2008.
Looking Ahead
Earnings (reported after the 6 August US close):
- Airbnb beat on both lines. EPS of $1.37 against $1.25 expected, revenue $3.61bn against $3.58bn consensus and up 17% year-on-year, with guidance for at least mid-teens annual revenue growth on demand strength described as spanning every region. Shares rose roughly 9% in extended trading.
- Cloudflare beat, with revenue of $696m accelerating to 36% year-on-year growth and record additions in total paying customers, large customers and platform developers. Q3 revenue is guided to $736-737m.
- Lyft was mixed — EPS of $0.13 missed the $0.15 consensus, but revenue of $1.84bn beat $1.81bn on gross bookings up 23% and a record 30.5 million active riders (+17%). Shares added about 1% after hours.
These three land against the semiconductor-led risk-off tone described above, and none of them is an AI-hardware name. Two clean beats and one revenue beat in consumer-facing tech is a counterweight to the Asian selling rather than a confirmation of it.
Central banks:
- BOJ, 18 September — roughly 54% market-implied probability of a hike from the current 1.00%. Given the intervention backdrop, BOJ communication between now and then is unusually market-sensitive.
- Fed speakers continue to shape expectations around the policy path; no scheduled FOMC meeting in the next five sessions.
Data:
- Next US CPI release will update the June reference month currently shown above — the crude rally makes the energy component worth watching.
- Q2 productivity and unit labour costs, released today, are worth revisiting once figures are available.
Market closures (from the Nager.Date holiday calendar):
- Japan — Tuesday 11 August, Mountain Day. Tokyo closed. This falls within the next five trading days.
- France — Saturday 15 August, Assumption Day. Falls on a weekend; no trading impact.
- South Korea — Monday 17 August, Liberation Day. Beyond the five-day window but worth noting given current Korean volatility.
- No US, UK, German, Australian, Swiss, Canadian or Brazilian closures in the next 14 days. Indian holiday data is absent from the calendar and was not checked.
Watch items:
- Whether Korean volatility propagates to Taiwan and the broader semiconductor supply chain, or stays contained as it did today in Europe and largely in the US.
- Whether credit spreads begin to respond to equity volatility — at 275 bps US high yield, there is a great deal of room to widen before reaching even historically normal levels.
- Further Red Sea developments and their pass-through to crude.
Special Analysis: What Explains the CAC 40 at an All-Time High
The record has very little to do with France, and quite a lot to do with what the index is made of.
Composition does most of the work. The CAC 40's record close of 8,699.71 (+0.35%) came on a day when the Kospi fell 4.58% into a sell-side circuit breaker, SK Hynix lost 10.67% and the Hang Seng lost 1.49%. That decoupling is not sentiment, it is arithmetic: the index carries almost no semiconductor or AI-hardware exposure and is weighted instead toward luxury, banks, industrials and energy — precisely the sectors Asia's selling did not touch. TotalEnergies took a direct lift from the crude rally (WTI +2.75% to $77.29, Brent +3.83% to $82.49). When the AI complex unwinds, Paris is simply not in the trade.
The luxury cycle has turned. This is the France-specific driver, and it matters more for the CAC than for any other major index because luxury is a far larger share of its weight than of the DAX's or the FTSE's. Press reporting this week attributes the move to Bain data showing stronger-than-expected second-quarter personal-luxury demand, particularly in the US, alongside strong Chanel results; Hermès rose about 5% on an analyst upgrade, with LVMH, L'Oréal and Kering also advancing. Paris extended the run into a fourth consecutive record session on 6 August, with an intraday print reported at 8,740.13 — a press figure, not a retrieved close, and not used anywhere else in this briefing.
The discount rate is European, not American. The CAC's 18.30x trailing P/E gives an earnings yield of 5.47% against a euro area AAA 10-year of 3.15%, an ERP of +2.32%. The S&P 500's equivalent is −0.77%. French private-sector payrolls fell 0.1% q/q, which reads as a nudge toward a more dovish ECB. European equities are being paid a real premium over European government bonds; US equities are not. That gap is a live rotation argument, and Paris is a direct beneficiary of it. Easing geopolitics — the Iran-Oman Strait of Hormuz arrangement — helped at the margin.
Three caveats. First, the CAC 40 is a price index: it excludes dividends, which is why its all-time-high headlines carry a drama the DAX, a total-return index by construction, never generates. On a gross-return basis the CAC passed its 2000 peak years ago. The record is real, but the framing flatters it. Second, a record is not cheap — at 18.30x the index sits 22.0% above its ~14-16x long-run midpoint, better value than the S&P's 52.2% premium but not value. Third, French fiscal and political risk has not gone away; it is merely absent from this index, because CAC 40 constituents earn the large majority of their revenue outside France. The OAT-Bund spread was 69 bps on 22 May 2026 and reporting indicates the French 10-year has since moved above the Italian BTP. A France-based investor should note that the +2.32% ERP above is measured against the AAA curve; discounted against the OAT instead, that premium shrinks meaningfully.
One thing that is not driving this: a weak euro. EUR/USD stands at 1.1542, firmer than the 1.1519 recorded on 31 July. The rally is happening despite the currency, not because of it.
Data sources: FRED (US Treasuries, policy rates, credit spreads, macro), ECB Yield Curve API and ECB euro reference rates (euro area curve, FX), yfinance (all index levels, P/E proxies, commodities), and targeted web search (non-US bond yields, central bank rates, economic releases, news). Every figure in this briefing is from a live source except the historical-average P/E column, which uses static reference constants marked (†). Cells marked "(not retrieved)" are deliberately blank — no figure has been estimated or recalled.