2026 07 27
Global Financial Briefing — Monday, 27 July 2026
Market Overview
Markets opened the week in relief-rally mode after the US and Iran reportedly paused military strikes over the weekend, easing fears of a Strait of Hormuz supply disruption. Oil prices cratered — WTI crude fell 8.1% to $82.09/bbl and Brent dropped 9.0% to $88.04/bbl (yfinance CL=F/BZ=F) — pulling energy-sensitive inflation expectations lower and lifting bonds, gold, and most global equities. But the rally lost momentum in the US session as a fresh geopolitical-tech shock hit semiconductors: reports that a Shanghai state-backed firm has begun mass production of a domestically developed immersion DUV lithography machine sent chip stocks tumbling (AMD -7%, Teradyne -5%, broad semiconductor ETF weakness), dragging the Nasdaq 100 down 0.74% intraday even as the Dow Jones held gains of 0.29% on broader participation.
The divergence was sharpest between the US and the rest of the world: Europe and Asia-Pacific — which had already closed for the day before the chip-stock story fully hit US trading — posted broad-based gains on the oil-driven relief rally, with the DAX up 1.04%, the ASX 200 up 1.39%, and the Shanghai Composite up 1.15%. US credit spreads remain historically tight (IG OAS 79 bps, HY OAS 277 bps), VIX sits at a moderate 18.70, and the Treasury curve stays modestly positive (10Y-2Y at +34 bps) rather than inverted — a backdrop of contained near-term stress even as valuation concerns simmer beneath the surface.
The week's dominant catalyst is still ahead: the FOMC meets Tuesday-Wednesday (decision Wednesday) under new Fed Chair Kevin Warsh, and Microsoft, Meta, Apple, and Amazon all report earnings this week, with investors laser-focused on AI capital-expenditure trajectories after a Deutsche Bank strategist flagged capex concerns as "overshadowing" an otherwise strong earnings season (Intel's Q2 beat notwithstanding).
Global Indices Snapshot
Americas
US markets intraday (as of ~2:29pm ET) — Brazil intraday as of ~3:14pm local; figures may move before the close.
| Index | Level | Day Chg | Day Chg % | Source |
|---|---|---|---|---|
| S&P 500 | 7,399.23 | -12.75 | -0.17% | yfinance ^GSPC |
| Nasdaq 100 | 27,921.49 | -206.85 | -0.74% | yfinance ^NDX |
| Dow Jones | 52,100.44 | +153.19 | +0.29% | yfinance ^DJI |
| Brazil IBOV | 174,839.38 | +797.42 | +0.46% | yfinance ^BVSP |
Europe
European data reflects today's close (27 Jul).
| Index | Level | Day Chg | Day Chg % | Source |
|---|---|---|---|---|
| Euro STOXX 600 | 644.62 | +0.11 | +0.02% | yfinance ^STOXX |
| Euro STOXX 50 | 6,282.21 | +1.27 | +0.02% | yfinance ^STOXX50E |
| CAC 40 | 8,406.06 | +33.78 | +0.40% | yfinance ^FCHI |
| DAX | 25,361.03 | +262.03 | +1.04% | yfinance ^GDAXI |
| FTSE 100 | 10,781.75 | +45.52 | +0.42% | yfinance ^FTSE |
| SMI (Swiss) | 14,421.97 | +94.77 | +0.66% | yfinance ^SSMI |
The SMI closed just 0.3% below its all-time high of 14,464.53 — effectively at record levels.
Asia-Pacific
Asia-Pacific data reflects today's close (27 Jul).
| Index | Level | Day Chg | Day Chg % | Source |
|---|---|---|---|---|
| Nikkei 225 | 64,931.19 | +320.04 | +0.50% | yfinance ^N225 |
| Hang Seng | 25,207.18 | +243.95 | +0.98% | yfinance ^HSI |
| Shanghai Comp | 3,858.25 | +44.05 | +1.15% | yfinance 000001.SS |
| ASX 200 | 8,894.00 | +121.70 | +1.39% | yfinance ^AXJO |
| Kospi (Korea) | 6,755.75 | +65.13 | +0.97% | yfinance ^KS11 |
Emerging Markets
| Index | Level | Day Chg % | Source |
|---|---|---|---|
| MSCI EM (EEM) | 63.19 | -0.22% | yfinance EEM |
| India Nifty 50 | 23,995.95 | +0.96% | yfinance ^NSEI |
| South Africa (EZA) | 61.75 | +1.11% | yfinance EZA |
Index Valuations & Investment Risk
Valuation Table
| Index | Trailing P/E (live) | Hist avg trailing P/E (†) | Premium/Discount |
|---|---|---|---|
| S&P 500 | 26.53x | ~16-18x | +56% above avg |
| Nasdaq 100 | 30.15x | ~25-30x | +10% above avg |
| Euro STOXX 600 | 18.62x | ~15-17x | +16% above avg |
| CAC 40 | 17.69x | ~14-16x | +18% above avg |
| DAX | 18.55x | ~15-17x | +16% above avg |
| FTSE 100 | 18.01x | ~13-15x | +29% above avg |
| Nikkei 225 | 21.11x | ~20-22x | +0.5% (in-line) |
| MSCI EM | 16.28x | ~13-15x | +16% above avg |
(†) Hist avg trailing P/E: static long-run reference constants.
Trailing P/E (live): sourced from yfinance trailingPE field on ETF proxies (SPY, QQQ, EXSA.DE,
CAC.PA, EXS1.DE, ISF.L, 1321.T, EEM). Premium/discount computed vs the historical band's midpoint.
Investment Risk Assessment for ETF Investors
United States (S&P 500 / Nasdaq ETFs) S&P 500 trailing P/E of 26.53x sits roughly 56% above its ~16-18x long-run average — the most stretched valuation in this survey. Earnings yield (1÷26.53 = 3.77%) is now below the 10Y Treasury yield of 4.71% (FRED DGS10, 2026-07-23), producing a negative Equity Risk Premium of about -0.94% — a historically reliable warning signal that bonds are compensating investors more than equities on a pure yield basis. The 10Y TIPS real yield of 2.43% (FRED DFII10) is also elevated versus its post-2015 norm, adding further discount-rate pressure on long-duration growth names — a dynamic visible today in the Nasdaq's underperformance versus the Dow. Nasdaq 100's 30.15x is only modestly (about 10%) above its own 25-30x historical band, but concentration risk in a handful of AI-capex-exposed mega-caps remains the key idiosyncratic risk heading into this week's Microsoft/Meta/Apple/Amazon earnings.
Europe (STOXX 600 / CAC 40 / DAX ETFs) European valuations are meaningfully cheaper than the US in absolute terms (STOXX 600 at 18.62x, CAC 40 at 17.69x, DAX at 18.55x) but all sit 16-18% above their own historical averages — elevated, though nowhere near the S&P 500's stretch. Using the ECB's euro-area AAA 10Y yield of 3.21% (ECB YC API, 2026-07-24) as the regional risk-free proxy, STOXX 600's earnings yield of 5.37% (1÷18.62) implies a positive Equity Risk Premium of about +2.16% — a meaningfully more attractive risk/reward than the US on this metric. Currency risk for USD-based investors is a live consideration given a softening dollar backdrop (EUR/USD near 1.144, FRED DEXUSEU); French fiscal/political risk (OAT-Bund spread) could not be independently verified; see note in Fixed Income section.
Japan (Nikkei / TOPIX ETFs) Nikkei 225's trailing P/E of 21.11x is essentially in line with its ~20-22x historical range — the cheapest-vs-history major developed market in this survey. The index remains about 11% below its all-time high of 72,831.73, reflecting a partial pullback from euphoric AI-related highs earlier in the cycle. The BOJ's June 2026 hike to 1.00% (first move to that level since 1995) and talk of a further move toward a ~2% neutral rate are the dominant policy risk; JPY weakness (USD/JPY ~163.85) continues to be a double-edged sword — a tailwind for exporter earnings but a currency-hedge cost for unhedged foreign holders.
Emerging Markets (MSCI EM ETFs) MSCI EM's 16.28x trades about 16% above its historical average — still a meaningful discount to the S&P 500 in absolute terms, but no longer "cheap" on its own historical basis. China (via Hang Seng +0.98% and Shanghai +1.15% today) and India (Nifty 50 +0.96%) both participated in today's broad risk-on move. South Africa (EZA) remains about 24% below its 52-week/all-time high, reflecting ongoing currency and political risk discounts.
Overall Risk Score (qualitative, not financial advice): - US large-cap: High valuation risk / low margin of safety — negative ERP is a genuine caution flag - Europe: Moderate — elevated vs. own history but a meaningfully positive ERP vs. bonds - Japan: Moderate-to-attractive — valuation roughly in line with history - Emerging Markets: Moderate — valuation discount to US persists but has narrowed
Disclaimer: This is financial information, not personalised investment advice. Past valuations do not guarantee future returns. Consult a financial advisor before investing.
US Economic Indicators (FRED - authoritative)
| Indicator | Current | Prior | Delta | Reference Date | FRED Series |
|---|---|---|---|---|---|
| CPI YoY % | 3.46% | 4.17% | -0.71pp | 2026-06 | CPIAUCSL |
| Core CPI YoY % | 2.57% | 2.82% | -0.26pp | 2026-06 | CPILFESL |
| Unemployment Rate | 4.2% | 4.3% | -0.1pp | 2026-06 | UNRATE |
| Nonfarm Payrolls | 158,984k | 158,927k | +57k | 2026-06 (MoM chg) | PAYEMS |
| 10Y TIPS Real Yield | 2.43% | 2.39% | +0.04pp | 2026-07-23 | DFII10 |
Both headline and core CPI YoY eased in June versus May, and unemployment ticked down to 4.2% — a combination that, alongside a cooling-but-still-positive payrolls print (+57k), argues for a Fed that is not under acute pressure to move quickly at this week's FOMC meeting.
Other economic releases today (from web search): US S&P Global Manufacturing PMI (July, consensus 63.1 vs. June's 62.1) and the ISM Manufacturing Index (July, consensus 60.8 vs. June's 60.6) are both due later today (9:45am/10:00am ET), alongside June construction spending (consensus +0.3% MoM). Actual prints were not yet available — (not retrieved: today's actuals; consensus/prior shown only).
Fixed Income & Bond Analysis
Policy Rates
| Central Bank | Rate | Source |
|---|---|---|
| Fed Funds (upper) | 3.75% | FRED DFEDTARU |
| Fed Funds (lower) | 3.50% | FRED DFEDTARL |
| Effective FFR | 3.63% | FRED DFF |
| ECB Deposit Rate | 2.25% | FRED ECBDFR |
| BOJ Policy Rate | 1.00% | web search (hiked to 1.00% effective 2026-06-17, first move to this level since 1995) |
| BOE Bank Rate | ~3.73% | FRED IUDSOIA (SONIA proxy) |
Government Bond Yields
| Country | 2Y Yield | 10Y Yield | 30Y Yield | Source |
|---|---|---|---|---|
| USA | 4.37% | 4.71% | 5.17% | FRED (2026-07-23) |
| Euro area (AAA) | 2.77% | 3.21% | 3.62% | ECB YC API (2026-07-24) |
| UK | (not retrieved) | 4.98% | (not retrieved) | web search |
| Japan | (not retrieved) | 2.81% | (not retrieved) | web search |
| France / Italy | (not retrieved) | (not retrieved) | (not retrieved) | see note below |
Note: no separate German Bund, French OAT or Italian BTP figures today, and no OAT-Bund spread. The euro-area AAA curve above is the best available proxy for regional euro rates. UK 2-year and 30-year gilt yields, and Japan's 2-year and 30-year yields, were not found in today's search results and are omitted rather than estimated.
Yield Curve Spreads (FRED pre-computed): - 10Y-2Y spread: +34 bps (2026-07-24) — modestly positive; well clear of inversion, but still flatter than a historically "steep" curve (>75 bps). Consistent with a curve that has normalized out of inversion but is not yet pricing a strong growth/inflation reacceleration. - 10Y-3M spread: +76 bps (2026-07-24) — also modestly positive, and no longer flashing the classic recession-warning inversion seen in prior cycles.
Yield Curve Charts
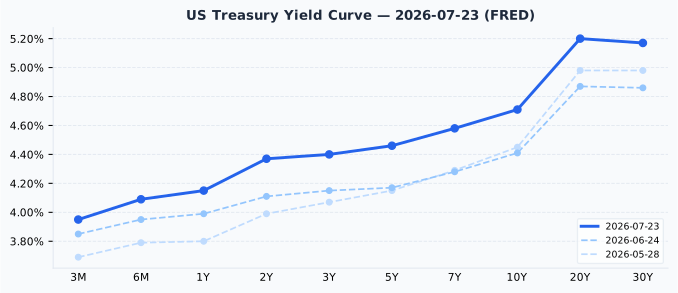
The US curve is upward-sloping across its full length, with a modest belly (2Y-5Y) flattening relative to the steeper long end (20Y-30Y around 5.17-5.20%). Versus one month ago (24 Jun) and two months ago (28 May), the entire curve has shifted up by roughly 20-30 bps at most maturities, with the front end (3M-2Y) rising fastest — consistent with the market pricing a slower pace of Fed easing than it did in late May.
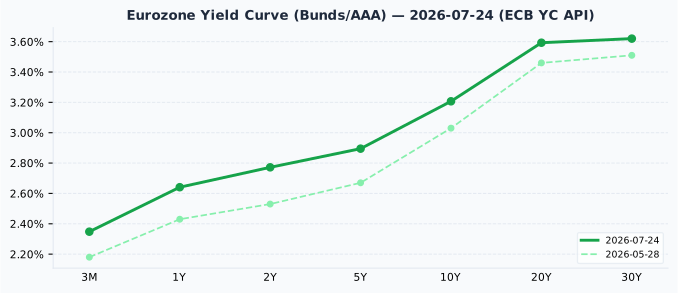
The euro-area AAA curve is also upward-sloping and has steepened noticeably since two months ago (28 May): every maturity from 3M to 30Y is roughly 15-20 bps higher, with the 10Y up from 3.03% to 3.21%. (No closer prior-month euro curve observation was available, so this comparison spans the full two-month window.)
Credit Markets (from FRED — authoritative)
| Market | OAS Spread | Series ID |
|---|---|---|
| US Investment Grade | 79 bps | BAMLC0A0CM |
| US High Yield | 277 bps | BAMLH0A0HYM2 |
| Euro High Yield | 250 bps | BAMLHE00EHYIOAS |
All three spreads sit at or below the low end of their typical long-run bands (US IG: 80-150 bps; US HY: 300-500 bps) — i.e., historically tight, not stressed. Tight spreads reflect strong demand for corporate credit and low near-term default-risk pricing, but historically tight spreads have also preceded periods of repricing when growth or liquidity conditions deteriorate — worth monitoring given the elevated equity valuations described above.
Bond Portfolio Implications
The negative US Equity Risk Premium (earnings yield 3.77% vs. DGS10 4.71%, or -0.94%) is a genuine signal that high-quality US Treasuries now offer a better nominal yield than S&P 500 forward earnings — historically this has been associated with weaker subsequent equity returns and stronger relative bond performance, though the signal can persist for extended periods without a near-term correction. By contrast, the euro-area ERP of roughly +2.16% (STOXX 600 earnings yield 5.37% vs. euro-area AAA 10Y 3.21%) still favors equities over bonds in Europe.
Duration risk cuts both ways here: if yields were to rise another 100 bps from current levels, a 10-year Treasury would suffer roughly an 8-9% price loss, but current real yields (DFII10 at 2.43%) already compensate long-duration holders more generously than at almost any point in the past decade. Given tight credit spreads, the marginal income pickup from moving down the credit-quality spectrum into high yield (277 bps over Treasuries) looks thin relative to the additional default and liquidity risk being taken on.
Currencies & Commodities
Currencies:
| Pair | Rate | Source |
|---|---|---|
| EUR/USD | 1.1440 | FRED DEXUSEU (2026-07-17) |
| USD Index | 120.53 | FRED DTWEXBGS (2026-07-17) |
| USD/JPY | 163.85 | web search |
| GBP/USD | 1.3321 | web search |
| USD/CHF | 0.8177 | web search |
Note: FRED's EUR/USD and Broad USD Index series (H.10 release) lag roughly 10 days; the values above are the latest FRED has published, not intraday levels.
Commodities (all from yfinance front-month futures):
| Commodity | Price | Day Chg % | Ticker | Source |
|---|---|---|---|---|
| Brent Crude | $88.04 | -9.03% | BZ=F | yfinance |
| WTI Crude | $82.09 | -8.08% | CL=F | yfinance |
| Gold ($/oz) | $4,077.00 | +0.15% | GC=F | yfinance |
| Silver ($/oz) | $58.61 | -0.51% | SI=F | yfinance |
| Copper ($/lb) | $6.39 | +0.44% | HG=F | yfinance |
| Nat Gas ($/MMBtu) | $2.78 | -3.81% | NG=F | yfinance |
Today's oil move is the headline commodity story: WTI and Brent both plunged as the US and Iran reportedly paused military strikes, evaporating the Middle East risk premium that had been built into prices. Even after today's drop, WTI at $82.09 is 44% below its all-time high of $147.27 and 31% below its 52-week high of $119.48 — the current level reflects a market that had already priced in a substantial geopolitical premium.
Gold at $4,077/oz is 27% below its all-time high of $5,586.20 (also its 52-week high) — a meaningful pullback from the record set within the past year, not "near highs" language. Silver at $58.61/oz is even more dramatic: it is 52% below its own all-time/52-week high of $121.30, having round-tripped from a historic spike back to roughly half that level — a reminder of how volatile precious-metals positioning has been over the past year. Copper, at $6.39/lb, is only about 4% below its all-time high of $6.65/lb — "slightly below" its record, one of the more resilient commodities in this survey.
Crypto: no notable (>3%) moves were surfaced in today's search results; omitted.
Sector & Theme Highlights
Energy was whipsawed by the Iran de-escalation headlines — the initial relief rally that lifted broad risk sentiment came at the direct expense of oil-linked equities as crude cratered 8-9%. Semiconductors were the day's clear underperformer in the US, with AMD (-7%) and Teradyne (-5%) leading declines and the VanEck Semiconductor ETF down more than 3%, after reports that a Shanghai state-backed firm has begun mass production of a domestically developed immersion DUV lithography machine — a potential long-term threat to the Western semiconductor equipment supply chain that overshadowed Intel's Q2 earnings beat. The dominant cross-market theme this week is AI capital expenditure: with Microsoft, Meta, Apple, and Amazon all reporting, investors are focused less on top-line beats and more on whether capex guidance can be reconciled with return expectations — a Deutsche Bank strategist's warning that capex concerns are "overshadowing" the earnings season captures the market's current unease.
Top Stories (Global)
- US and Iran reportedly pause military strikes, triggering a broad relief rally: oil prices tumble (WTI -8%, Brent -9%), while bonds and gold also gain on reduced geopolitical risk premium.
- Semiconductor stocks slide sharply after reports that a Shanghai state-backed company has begun mass production of a domestically developed immersion DUV lithography machine, raising competitive and supply-chain concerns for Western chip-equipment makers (AMD -7%, Teradyne -5%).
- Intel beats Q2 2026 estimates with EPS of $0.42 and revenue of $16.13bn, roughly 12% above consensus — a bright spot in an otherwise weak day for chip stocks.
- FOMC meets Tuesday-Wednesday this week (decision Wednesday) — the first meeting under new Fed Chair Kevin Warsh, against a backdrop of cooling CPI and a still-solid labor market.
- Big Tech earnings week: Microsoft, Meta Platforms, Apple, and Amazon all report, with AI capital-expenditure guidance the dominant focus for investors.
- A Deutsche Bank strategist flagged AI capex concerns as overshadowing an otherwise strong Q2 earnings season, citing this as a driver of recent equity de-risking.
- European and Asian equities broadly outperformed the US today, benefiting fully from the oil-driven relief rally before the chip-stock story hit US trading hours.
Looking Ahead
Key events in the next 1-5 trading days: - FOMC meeting: Tuesday-Wednesday (28-29 July), decision Wednesday — first meeting chaired by Kevin Warsh. - US data: July Manufacturing PMI and ISM Manufacturing Index, June construction spending — all due today (27 July), actuals not yet available. - Earnings: Microsoft, Meta Platforms, Apple, and Amazon all scheduled to report this week, with AI capex guidance the key focus. - Market closures (from holiday calendar, next 5 calendar dates with a closure somewhere): - 1 Aug 2026 — Switzerland: Swiss National Day (Bundesfeier) - 11 Aug 2026 — Japan: Mountain Day (山の日) - 15 Aug 2026 — France: Assumption Day (Assomption) - 17 Aug 2026 — South Korea: Liberation Day (광복절) - 31 Aug 2026 — UK: Summer Bank Holiday
India's 2026 holiday data was not available; Indian market closures are omitted from the list above rather than estimated.