Global Financial Briefing — Monday, 10 August 2026
Americas index levels, commodities and day changes reflect the 10 August closing print. Fixed income, FX and macro figures are dated inline.
Market Overview
Energy was the story today. A stalemate in the Iran–Oman talks over reopening the Strait of Hormuz, compounded by a Houthi claim of an attack on a Saudi refinery near the Red Sea, pushed crude sharply higher for a fourth session: both benchmarks settled roughly 5% up, Brent +4.99% at $87.72 and WTI +5.05% at $82.13, with Henry Hub natural gas up 4.96%. Crude firmed further into the settle than it had been mid-afternoon: a full percentage point of the move came in the closing hours. The move fed straight into the bond market. Ten-year yields rose in every major market — Bunds +5.6 bp to 3.19%, OATs +5.9 bp to 3.98%, BTPs +6.4 bp to 3.97%, gilts +9.1 bp to ~5.00% — on the familiar logic that an oil shock is an inflation problem before it is a growth problem.
The equity response was strikingly regional. Asia was the day's winner, with the Nikkei 225 up 2.08% to 66,970 on renewed buying in chip and AI-linked names and a wave of forecast upgrades from Japanese corporates; Hang Seng added 1.05% and Shanghai 0.67%. Europe held near its highs but went nowhere in particular — the STOXX 600 finished +0.03%, the DAX +0.02%, with only the Swiss SMI (+0.61%) showing real conviction and the FTSE 100 (−0.35%) held back by the gilt move. US indices finished modestly lower, but they split in the final hours: the S&P 500 pared its decline to −0.06% and the Dow to −0.11%, while the Nasdaq 100 extended its loss to −0.34%. The broad market recovered into the close and the megacap tech complex did not.
Underneath the oil headline sits a genuine tension in the US macro picture. July nonfarm payrolls fell 23k — the first outright decline in the current run, after +20k in June — and unemployment nonetheless ticked down to 4.1%. Headline CPI is 3.46% against core at 2.57%, a gap of almost a point that is itself largely energy. Yet the 3-month bill at 3.90% sits some 28 bp above the 3.50–3.75% funds target midpoint, which is not the pricing of a market expecting cuts. Softening labour demand and an energy-driven inflation impulse are pulling the front end in opposite directions, and this week's CPI (Wednesday) is the next thing to resolve it.
Global Indices Snapshot
Americas
| Index | Level | Day Chg | Day Chg % | Source |
|---|---|---|---|---|
| S&P 500 | 7,753.11 | −4.53 | −0.06% | yfinance ^GSPC |
| Nasdaq 100 | 29,621.81 | −100.50 | −0.34% | yfinance ^NDX |
| Dow Jones | 53,975.98 | −60.95 | −0.11% | yfinance ^DJI |
| Brazil IBOV | 172,154.92 | −358.50 | −0.21% | yfinance ^BVSP |
Americas data reflects the 10 Aug close.
FRED's SP500 series puts Monday's close at 7,753.11 (FRED SP500, 2026-08-10), matching the yfinance close above to the cent — the two sources agree. The prior session's close, 7,757.64 on 7 August, is the basis for the day change.
The Brazil IBOV row is left at its capture value: the closing print (172,179.94, −0.19%) differs from it by 1.5 bp, inside the noise threshold below which rows are left untouched.
Europe
| Index | Level | Day Chg | Day Chg % | Source |
|---|---|---|---|---|
| Euro STOXX 600 | 660.45 | +0.20 | +0.03% | yfinance ^STOXX |
| Euro STOXX 50 | 6,535.62 | +11.76 | +0.18% | yfinance ^STOXX50E |
| CAC 40 | 8,726.03 | +11.10 | +0.13% | yfinance ^FCHI |
| DAX | 26,323.88 | +4.43 | +0.02% | yfinance ^GDAXI |
| FTSE 100 | 10,862.50 | −38.59 | −0.35% | yfinance ^FTSE |
| SMI (Swiss) | 14,633.70 | +88.79 | +0.61% | yfinance ^SSMI |
European data reflects today's close (10 Aug).
The continental European indices are all sitting within half a percent of their record highs — STOXX 600 0.45% below, CAC 40 0.33% below, DAX 0.46% below, SMI 0.15% below. Europe is at record highs, it simply isn't moving much.
Asia-Pacific
| Index | Level | Day Chg | Day Chg % | Source |
|---|---|---|---|---|
| Nikkei 225 | 66,970.22 | +1,363.51 | +2.08% | yfinance ^N225 |
| Hang Seng | 25,937.49 | +269.46 | +1.05% | yfinance ^HSI |
| Shanghai Comp | 3,966.59 | +26.56 | +0.67% | yfinance 000001.SS |
| ASX 200 | 9,232.60 | −31.00 | −0.33% | yfinance ^AXJO |
| Kospi (Korea) | 6,299.66 | +40.89 | +0.65% | yfinance ^KS11 |
Asia-Pacific data reflects today's close (10 Aug).
Note on the Kospi: the day change is confirmed — the fetched previous close (6,258.77) matches Friday's archived close exactly. However, the 52-week range and moving averages returned for ^KS11 are internally inconsistent with a week of 6,200–6,600 prints, so those fields are omitted from this briefing rather than reported.
Emerging Markets
| Index | Level | Day Chg % | Source |
|---|---|---|---|
| MSCI EM (EEM) | 65.17 | −0.72% | yfinance EEM |
| India Nifty 50 | 24,583.80 | +0.05% | yfinance ^NSEI |
| South Africa | 69.73 | +0.11% | yfinance EZA |
EEM and EZA are US-listed ETFs and reflect the 10 Aug close; ^NSEI reflects the Mumbai close. EZA reversed into the close: fractionally lower at −0.05% mid-afternoon, it finished fractionally higher.
Index Valuations & Investment Risk
Valuation Table
| Index | Trailing P/E (live) | Hist avg trailing P/E (†) | Premium to hist midpoint |
|---|---|---|---|
| S&P 500 | 26.01x | ~16–18x | +53.0% |
| Nasdaq 100 | 30.83x | ~25–30x | +12.1% |
| Euro STOXX 600 | 19.11x | ~15–17x | +19.4% |
| CAC 40 | 18.34x | ~14–16x | +22.3% |
| DAX | 19.24x | ~15–17x | +20.3% |
| FTSE 100 | 18.16x | ~13–15x | +29.7% |
| Nikkei 225 | 21.75x | ~20–22x | +3.6% |
| MSCI EM | 16.92x | ~13–15x | +20.8% |
(†) Hist avg trailing P/E: static long-run reference constants — the only non-live figures in this briefing. Live trailing P/E from yfinance trailingPE on ETF proxies (SPY, QQQ, EXSA.DE, CAC.PA, EXS1.DE, ISF.L, 1321.T, EEM). Bold marks a premium above 20%.
The S&P 500 at 26.0x trailing is 53% above the midpoint of its long-run range — comfortably into "historically stretched" territory by the >40% threshold. Note the ordering oddity worth pausing on: the Nasdaq 100 carries the highest absolute multiple on this table (30.83x) yet the second-smallest premium to its own history (+12.1%), because its historical benchmark is already high. Expensive in absolute terms is not the same as expensive relative to what it has traded at — on that relative measure the S&P 500 is the more stretched of the two, by a wide margin.
The FTSE 100 at +29.7% is the surprise. A market that spent a decade as the cheap value corner of Europe is now the second-most extended index here against its own past.
Investment Risk Assessment for ETF Investors
United States (S&P 500 / Nasdaq ETFs) SPY at 26.01x trailing gives an earnings yield of 3.84% (1÷26.01). Against the 10-year Treasury at 4.69% (FRED DGS10, 2026-08-06), the earnings yield gap is −0.85 pp — a Treasury pays more current yield than the index earns. Measured against the real yield instead (DFII10, 2.43%), the gap is +1.41 pp; the ~2.3 pp correction is large enough to flip the sign, which is exactly why the nominal version should never be read on its own.
The index closed 0.52% below its all-time high, above both its 50-day (7,498) and 200-day (7,055) moving averages. QQQ at 30.83x yields 3.24%, below the bond in nominal terms by a wider margin. Concentration in a handful of AI-linked megacaps remains the dominant idiosyncratic risk, and with real yields at 2.43% the discount rate applied to those long-duration earnings is not a forgiving one.
Europe (STOXX 600 / CAC 40 / DAX ETFs) EXSA.DE at 19.11x gives an earnings yield of 5.23% (1÷19.11). Against the 10-year Bund at 3.19%, the euro earnings yield gap is +2.05 pp — positive, and 2.9 pp wider than the US equivalent. On real yields (euro real 10Y of 1.12%, constructed below) the euro gap is +4.12 pp.
That transatlantic gap difference is not all risk compensation. Part of it is simply that US and euro-area nominal yields embed different inflation and policy paths — and as the decomposition below shows, today that difference is overwhelmingly a real rate story rather than an inflation one, which makes the comparison more meaningful than usual but still not a clean one.
European equities are cheaper than the US on every measure here while sitting at record highs, which is a reminder that "at highs" and "expensive" are separate claims. The risks are the familiar ones: French fiscal politics (OAT–Bund at 79 bp), energy import exposure that today's oil move sharpens, and China demand sensitivity in the German industrial complex.
On currency: a euro-based investor holding EUR-quoted European funds has no FX effect on the quoted value of the holding, but real FX exposure persists inside the earnings — CAC 40 and STOXX 600 constituents are multinationals earning substantially abroad. The exposure is smaller and slower, not absent.
Japan (Nikkei / TOPIX ETFs) At 21.75x the Nikkei is the closest of any index here to its own historical average (+3.6%), and it sits 8.0% below its all-time high despite today's 2.08% jump. The live question is the BOJ: policy is at 1.00% after the 31 July hold (8–1, with Takata dissenting for 1.25%), and the bank explicitly warned core inflation will run "clearly above" 2% from the second half of FY2026, citing wage pass-through, crude prices and yen weakness. With USD/JPY at 158.5, an unhedged euro or dollar investor has been earning the equity return and losing part of it to the currency; a hedge here is a genuine decision, not a detail.
Emerging Markets (MSCI EM ETFs) EEM at 16.92x is 20.8% above its own long-run midpoint — EM is no longer the automatic value trade it is often assumed to be, though it remains a 35% discount to the S&P 500. The index is 8.9% off its high and below its 50-day average. China's weight dominates the risk profile, and a sustained oil move is a net negative for the large importing members (India, China, Korea) while helping the Gulf and Brazil.
Overall Risk Score (qualitative, not financial advice): High valuation risk / low margin of safety in the US; moderate in Europe and EM, where positive earnings yield gaps still exist; moderate in Japan, where valuation is near normal but policy and currency risk are elevated.
Disclaimer: This is financial information, not personalised investment advice. Past valuations do not guarantee future returns. Consult a financial advisor before investing.
US Economic Indicators (FRED — authoritative)
| Indicator | Current | Prior | Delta | Reference Date | FRED Series |
|---|---|---|---|---|---|
| CPI YoY % | 3.46% | 4.17% | −0.70 | Jun 2026 | CPIAUCSL |
| Core CPI YoY % | 2.57% | 2.82% | −0.26 | Jun 2026 | CPILFESL |
| Unemployment Rate | 4.1% | 4.2% | −0.1 | Jul 2026 | UNRATE |
| Nonfarm Payrolls | −23k | +20k | −43k | Jul 2026 (m/m) | PAYEMS |
| 10Y TIPS Real Yield | 2.43% | 2.41% | +0.02 | 2026-08-06 | DFII10 |
FRED macro data is monthly and lags by 4–6 weeks; reference months are shown above. The July payrolls print is the one to note — an outright contraction of 23k against +20k in June, and the unemployment rate falling anyway, which usually points to labour force withdrawal rather than strength. Headline CPI has fallen 0.70 pp in a month while core fell only 0.26 pp, so the disinflation is disproportionately energy — precisely the component today's oil move works against.
Other economic releases today: none of significance. The week's calendar is inflation-led: US CPI on Wednesday 12 August, PPI on Thursday 13 August, then retail sales and the preliminary University of Michigan sentiment reading on Friday 14 August.
Fixed Income & Bond Analysis
Policy Rates
| Central Bank | Rate | Source |
|---|---|---|
| Fed Funds (upper) | 3.75% | FRED DFEDTARU (2026-08-10) |
| Fed Funds (lower) | 3.50% | FRED DFEDTARL (2026-08-10) |
| Effective FFR | 3.63% | FRED DFF (2026-08-06) |
| ECB Deposit Rate | 2.25% | FRED ECBDFR (2026-08-10) |
| BOJ Policy Rate | 1.00% | web search (held 31 Jul, 8–1 vote) |
| BOE Bank Rate | ~3.73% (SONIA) | FRED IUDSOIA (2026-08-06) |
Government Bond Yields
| Country | 2Y Yield | 10Y Yield | 30Y Yield | Day Chg (10Y) | Source |
|---|---|---|---|---|---|
| USA | 4.25% | 4.69% | 5.22% | +6 bp | FRED (2026-08-06) |
| Germany | 2.80% | 3.19% | 3.68% | +5.6 bp | Trading Economics (10 Aug) |
| France | 2.98% | 3.98% | 4.76% | +5.9 bp | Trading Economics (10 Aug) |
| UK | 4.35% | ~5.00% | 5.73% | +9.1 bp | Trading Economics (10 Aug) |
| Japan | 1.62% | 2.81% | 3.96% | +0.7 bp | Trading Economics (10 Aug) |
| Italy | — | 3.97% | — | +6.4 bp | Trading Economics (10 Aug) |
US day change computed from consecutive FRED observations (DGS10: 4.63% on 2026-08-05 → 4.69% on 2026-08-06). Note FRED's daily Treasury series lag by two business days, so the US row is as of 6 August while the European and Japanese rows are today's — they are not strictly contemporaneous.
Yield Curve Spreads (FRED pre-computed, 2026-08-07): - 10Y−2Y: +46 bp — positively sloped, but shallow. Not inverted, and not steep either (a steep curve historically runs above ~75 bp). - 10Y−3M: +78 bp — positively sloped, no recession signal from this indicator.
The curve has disinverted and normalised, but the slope remains modest by historical standards. The more interesting feature is the front end: the 3-month bill at 3.90% against a funds midpoint of 3.625% implies the market is pricing policy moving higher, not lower — consistent with the reporting that weaker labour data merely trimmed expectations of another increase rather than introducing cuts.
OAT–Bund Spread: 3.98% − 3.19% = 79 bp. France's key fiscal risk gauge. For context, the BTP–Bund spread is now 78 bp — Italy is currently financing marginally tighter than France at ten years, a reversal that would have seemed implausible for most of the last fifteen years and which says more about French budget politics than about Italian credit improvement.
Yield Curve Charts
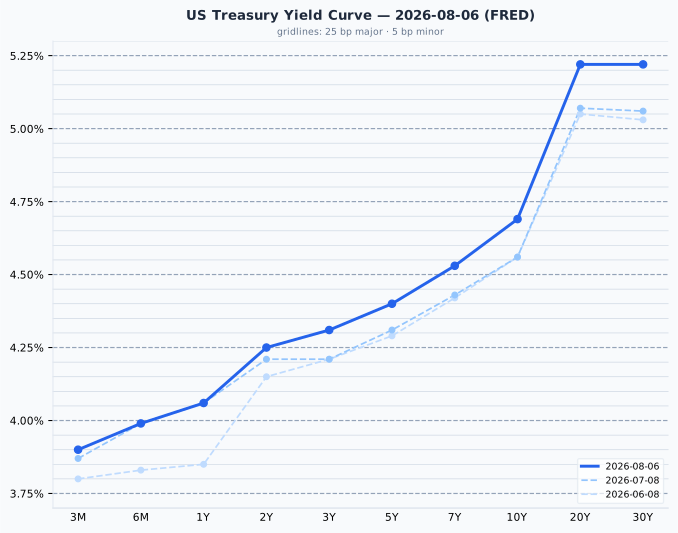
The US curve is upward-sloping across its whole length, with the 20Y and 30Y flat against each other at 5.22%. Since 10 July the curve has shifted up and steepened at the long end — the 10Y is 13 bp higher and the 20Y/30Y some 15–16 bp higher, while the 3M has barely moved (+3 bp), so the move is a term-premium story rather than a policy-expectations one.
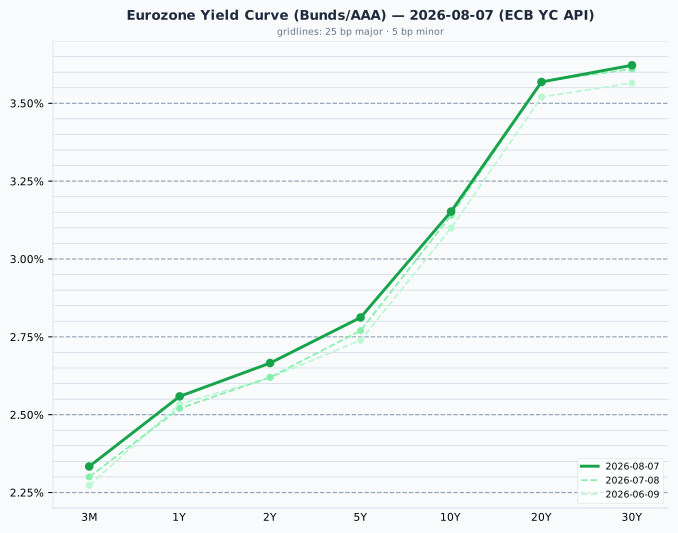
The euro AAA curve is likewise positively sloped, from 2.33% at 3 months to 3.62% at 30 years, and materially steeper front-to-back than the US in relative terms. Against 8 July the whole curve has drifted up by roughly 1–5 bp — a much smaller shift than the US saw over the same window, which is the mechanical source of the widening real-rate gap discussed below.
Credit Markets (FRED — authoritative, 2026-08-07)
| Market | OAS Spread | Series ID |
|---|---|---|
| US Investment Grade | 78 bp | BAMLC0A0CM |
| US High Yield | 270 bp | BAMLH0A0HYM2 |
| Euro High Yield | 261 bp | BAMLHE00EHYIOAS |
All three are historically tight. US high yield at 270 bp is below the 300–500 bp range that typically counts as normal, and investment grade at 78 bp is below its 80–150 bp norm. Credit markets are showing no stress whatsoever — which, set against a VIX of 14.9 and equity valuations 53% above long-run averages, is best read as complacency being priced consistently across asset classes rather than as independent confirmation that risk is low.
Real Yields (US and Euro Area)
| Region | Nominal 10Y | Expected inflation | Real 10Y | How the real yield is obtained |
|---|---|---|---|---|
| United States | 4.69% (FRED DGS10) | 2.26% (residual — the breakeven) | 2.43% (FRED DFII10) | Measured. TIPS trade, so the market quotes a real yield directly; expected inflation is backed out as the residual |
| Euro area | 3.15% (ECB YC, 2026-08-07) | 2.04% (measured — ECB SPF 2026-Q3) | 1.12% (residual) | Constructed. No euro inflation-linked benchmark is published, so a survey expectation is subtracted from the nominal yield |
The two rows are built in opposite directions. Only the US real yield is a price anyone actually trades; the euro figure is an arithmetic residual resting on a survey, and should be treated as the softer of the two. Two mismatches follow from that and should be stated whenever the pair is compared: the US breakeven embeds an inflation risk premium that a survey response does not, and the SPF horizon is five years against the bond's ten.
Decomposing the 154 bp nominal gap between the two 10-year yields: only 22 bp is a difference in expected inflation (2.26% vs 2.04%), while 131 bp is a difference in real rates (2.43% vs 1.12%). The transatlantic yield gap is almost entirely a real-rate phenomenon right now, not an inflation-expectations one. (The split moves with the cycle and is recomputed each run — a week ago it was 18 bp / 130 bp on a 148 bp gap, so the gap has widened slightly and the widening was real-rate driven.)
⚠️ The US–euro real rate gap is not an investment opportunity
The 131 bp real-yield advantage of US over euro-area bonds is a structural feature — it has been positive in every quarter since 2014 — reflecting higher US trend growth, euro-area excess savings, Bund scarcity and US fiscal supply. It is not a trade a euro-based investor can capture. Hedging the currency cancels it almost exactly, because the forward rate is set precisely to remove the interest differential; unhedged, it stops being a bond decision and becomes a currency bet.
A real yield is real in its own currency. 2.43% means 2.43% above US inflation, which is not a real return for someone who spends euros. The persistence of a gap this size over twelve years is itself the evidence that it is compensation for risk borne by dollar investors, not a mispricing waiting to be collected.
Bond Portfolio Implications
At 4.69% on the US 10-year and 3.19% on the Bund, bonds offer something they did not offer for most of the 2010s. The earnings yield gap below compares the income the two instruments offer today, using only quoted prices — no growth forecast, no assumptions:
| Market | Earnings yield | 10Y nominal | Nominal gap | vs real 10Y | Real gap |
|---|---|---|---|---|---|
| S&P 500 (SPY) | 3.84% (1÷26.01) | 4.69% | −0.85 pp | 2.43% | +1.41 pp |
| Euro STOXX 600 (EXSA.DE) | 5.23% (1÷19.11) | 3.19% | +2.05 pp | 1.12% | +4.12 pp |
Two structural biases to keep in view. First, the gap ignores growth: a bond coupon is fixed for a decade while the earnings behind the equity yield grow roughly with inflation, so the nominal gap understates equities by approximately expected inflation. The real-yield column corrects for that, and the size of the correction is the point of interest — about 2.3 pp for the US, enough to move the S&P from below the bond to 1.4 pp above it. Second, an equity holder does not receive the full earnings yield: only the dividend and buyback portion arrives as cash, and the remainder is retained on the balance sheet.
This is a snapshot of today's trade-off, not a forecast of relative returns. For a forward-looking valuation argument, the earnings yield measured against its own history is the measure that carries predictive weight.
Duration risk: a 100 bp rise in yields costs roughly 8–9% in price on a 10-year bond, and considerably more further out — the 30Y Treasury at 5.22% and the 30Y gilt at 5.73% carry duration near 15–17, so the same 100 bp move is a 15%+ drawdown. With the curve only 46 bp positive from 2s to 10s, the extra yield earned for that duration extension is thin. Today's oil-driven yield move is exactly the risk the long end is exposed to. The intermediate part of the curve (2–5 years) currently offers most of the yield with a fraction of the volatility.
Currencies & Commodities
Currencies:
| Pair | Rate | Source |
|---|---|---|
| EUR/USD | 1.1519 | FRED DEXUSEU (2026-07-31) |
| USD Index | 119.70 | FRED DTWEXBGS (2026-07-31) |
| USD/JPY | 158.50 | web search (10 Aug) |
| GBP/USD | 1.3497 | web search (10 Aug) |
| USD/CHF | 0.8072 | web search (10 Aug) |
The two FRED FX series are as of 31 July — ten days stale, as FRED's weekly-published FX data lags. Treat EUR/USD and the dollar index above as indicative of late July, not today.
Commodities (yfinance front-month futures):
| Commodity | Price | Day Chg % | Ticker | Source |
|---|---|---|---|---|
| Brent Crude | $87.72 | +4.99% | BZ=F | yfinance |
| WTI Crude | $82.13 | +5.05% | CL=F | yfinance |
| Gold ($/oz) | $4,419.70 | +0.45% | GC=F | yfinance |
| Silver ($/oz) | $65.272 | +2.79% | SI=F | yfinance |
| Copper ($/lb) | $6.6160 | +0.38% | HG=F | yfinance |
| Nat Gas ($/MMBtu) | $2.794 | +4.96% | NG=F | yfinance |
Front-month futures settled 20:30 CEST. Both crude benchmarks added roughly a percentage point into the settle; the settlement prices above are corroborated by press reports of the session.
Gold settled at $4,419.70, 20.9% below its all-time high of $5,586.20, which is also its 52-week high — a substantial drawdown from the peak, and a useful corrective to any assumption that the safe-haven bid is running hot. Its +0.45% is a muted response to a geopolitical energy shock. Silver at $65.272 is 46.2% below its all-time high of $121.30, though it outperformed gold at +2.79%, consistent with its heavier industrial weighting.
Copper at $6.6160/lb is the standout: 1.7% below its all-time high of $6.728, effectively at record levels. Crude, by contrast, remains far from its own extremes — Brent is 40.5% and WTI 44.2% below their 2008 peaks — so the day's move is a sharp repricing within a historically unremarkable range, not a price spike in absolute terms. Natural gas at $2.794 sits 82.3% below its all-time high despite the 4.96% jump.
Crypto: no moves above the 3% threshold were retrieved in today's searches — omitted.
Sector & Theme Highlights
- Energy was the clear global leader, mechanically following crude's fourth consecutive advance. ConocoPhillips named Andy O'Brien CEO effective 1 September, inheriting a $7bn free-cash-flow target tied to the Willow project in Alaska.
- Semiconductors and AI drove the Japanese rally, with Nikkei constituents extending gains on renewed — and by most accounts more selective — buying in the AI complex. Fujikura, Recruit Holdings and INPEX were among those raising forecasts on 7 August.
- Payments/consumer held up: Visa reported Q2 revenue of $11.63bn, +14.4% year on year and 2.2% ahead of consensus.
- European financials got a structural nudge as Deutsche Bank was appointed a renminbi clearing bank by China — a first for a European institution, enabling direct cross-border RMB settlement for European banks and corporates.
- Cross-market theme — the inflation/energy channel reopening. For most of this year, disinflation has been the tailwind under both equity multiples and the bond rally. A sustained Hormuz disruption reverses the sign on that, and today's simultaneous move in oil, global 10-year yields and industrial metals shows the market beginning to price it.
- Rate-sensitive UK assets underperformed, with the 10-year gilt at ~5.00% (+9.1 bp, the largest move of any major market) weighing on the FTSE 100.
Top Stories (Global)
- Strait of Hormuz stalemate drives oil higher. Iran and Oman failed to reach a deal to reopen the strait, while Houthi militants claimed an attack on a Saudi refinery near the Red Sea. Tehran had described an agreement as close over the weekend, but restated on Monday that reopening depends on the US lifting its blockade of Iranian shipping and paying compensation for damages — the condition that stalled the talks. Brent settled +4.99% at $87.72, WTI +5.05% at $82.13, natural gas +4.96%.
- Global bond yields rise on the energy-inflation channel. Bunds +5.6 bp, OATs +5.9 bp, BTPs +6.4 bp, gilts +9.1 bp. Trading Economics attributed the Bund move directly to the Hormuz stalemate keeping oil elevated.
- US July payrolls contracted by 23k (FRED PAYEMS), the first decline in the current sequence, with unemployment nonetheless easing to 4.1%. Softer labour data trimmed expectations for a further Fed increase.
- Nikkei 225 gained 2.08%, the strongest major index of the day, on AI/chip buying and a wave of Japanese corporate forecast upgrades.
- BOJ held at 1.00% on 31 July in an 8–1 vote, with Hajime Takata dissenting for 1.25%. The bank warned core inflation is likely to run "clearly above" 2% from H2 FY2026, citing wage pass-through, crude prices and yen depreciation. The 10-year JGB rose to 2.81%.
- Visa beat on Q2, with revenue of $11.63bn (+14.4% YoY), 2.2% above consensus.
- Deutsche Bank appointed RMB clearing bank by China, the first European institution to hold the role, allowing European banks and companies to settle cross-border renminbi directly.
Looking Ahead
Economic releases (next 5 trading days): - Wednesday 12 August — US CPI (July). The week's main event, and unusually consequential given the energy move: headline has been falling fast (3.46% from 4.17%) largely on energy, and that tailwind is now reversing. - Thursday 13 August — US PPI (July). - Friday 14 August — US retail sales (July) and preliminary University of Michigan consumer sentiment (August).
Central banks: - No scheduled Fed, ECB, BOE or BOJ decisions in the next five trading days. The BOJ's hawkish tilt and the 8–1 split make Japanese wage and inflation data the ones to watch between meetings.
Geopolitics: - Iran–Oman negotiations over the Strait of Hormuz remain the single largest swing factor for oil, and by extension for the inflation path priced into every major bond market. Red Sea security incidents are an active secondary risk.
Market closures (from the Nager.Date holiday calendar): - Tuesday 11 August — Japan: Mountain Day. Tokyo closed tomorrow; expect thinner Asian liquidity. - Monday 17 August — South Korea: Liberation Day. Seoul closed. - Saturday 15 August is Assumption Day in France, but falls on a weekend — no trading impact. - Monday 31 August is the UK Summer Bank Holiday, outside the five-day window. - India: the Nager.Date calendar returns no entries for India, so Indian closures could not be verified and are not reported here.